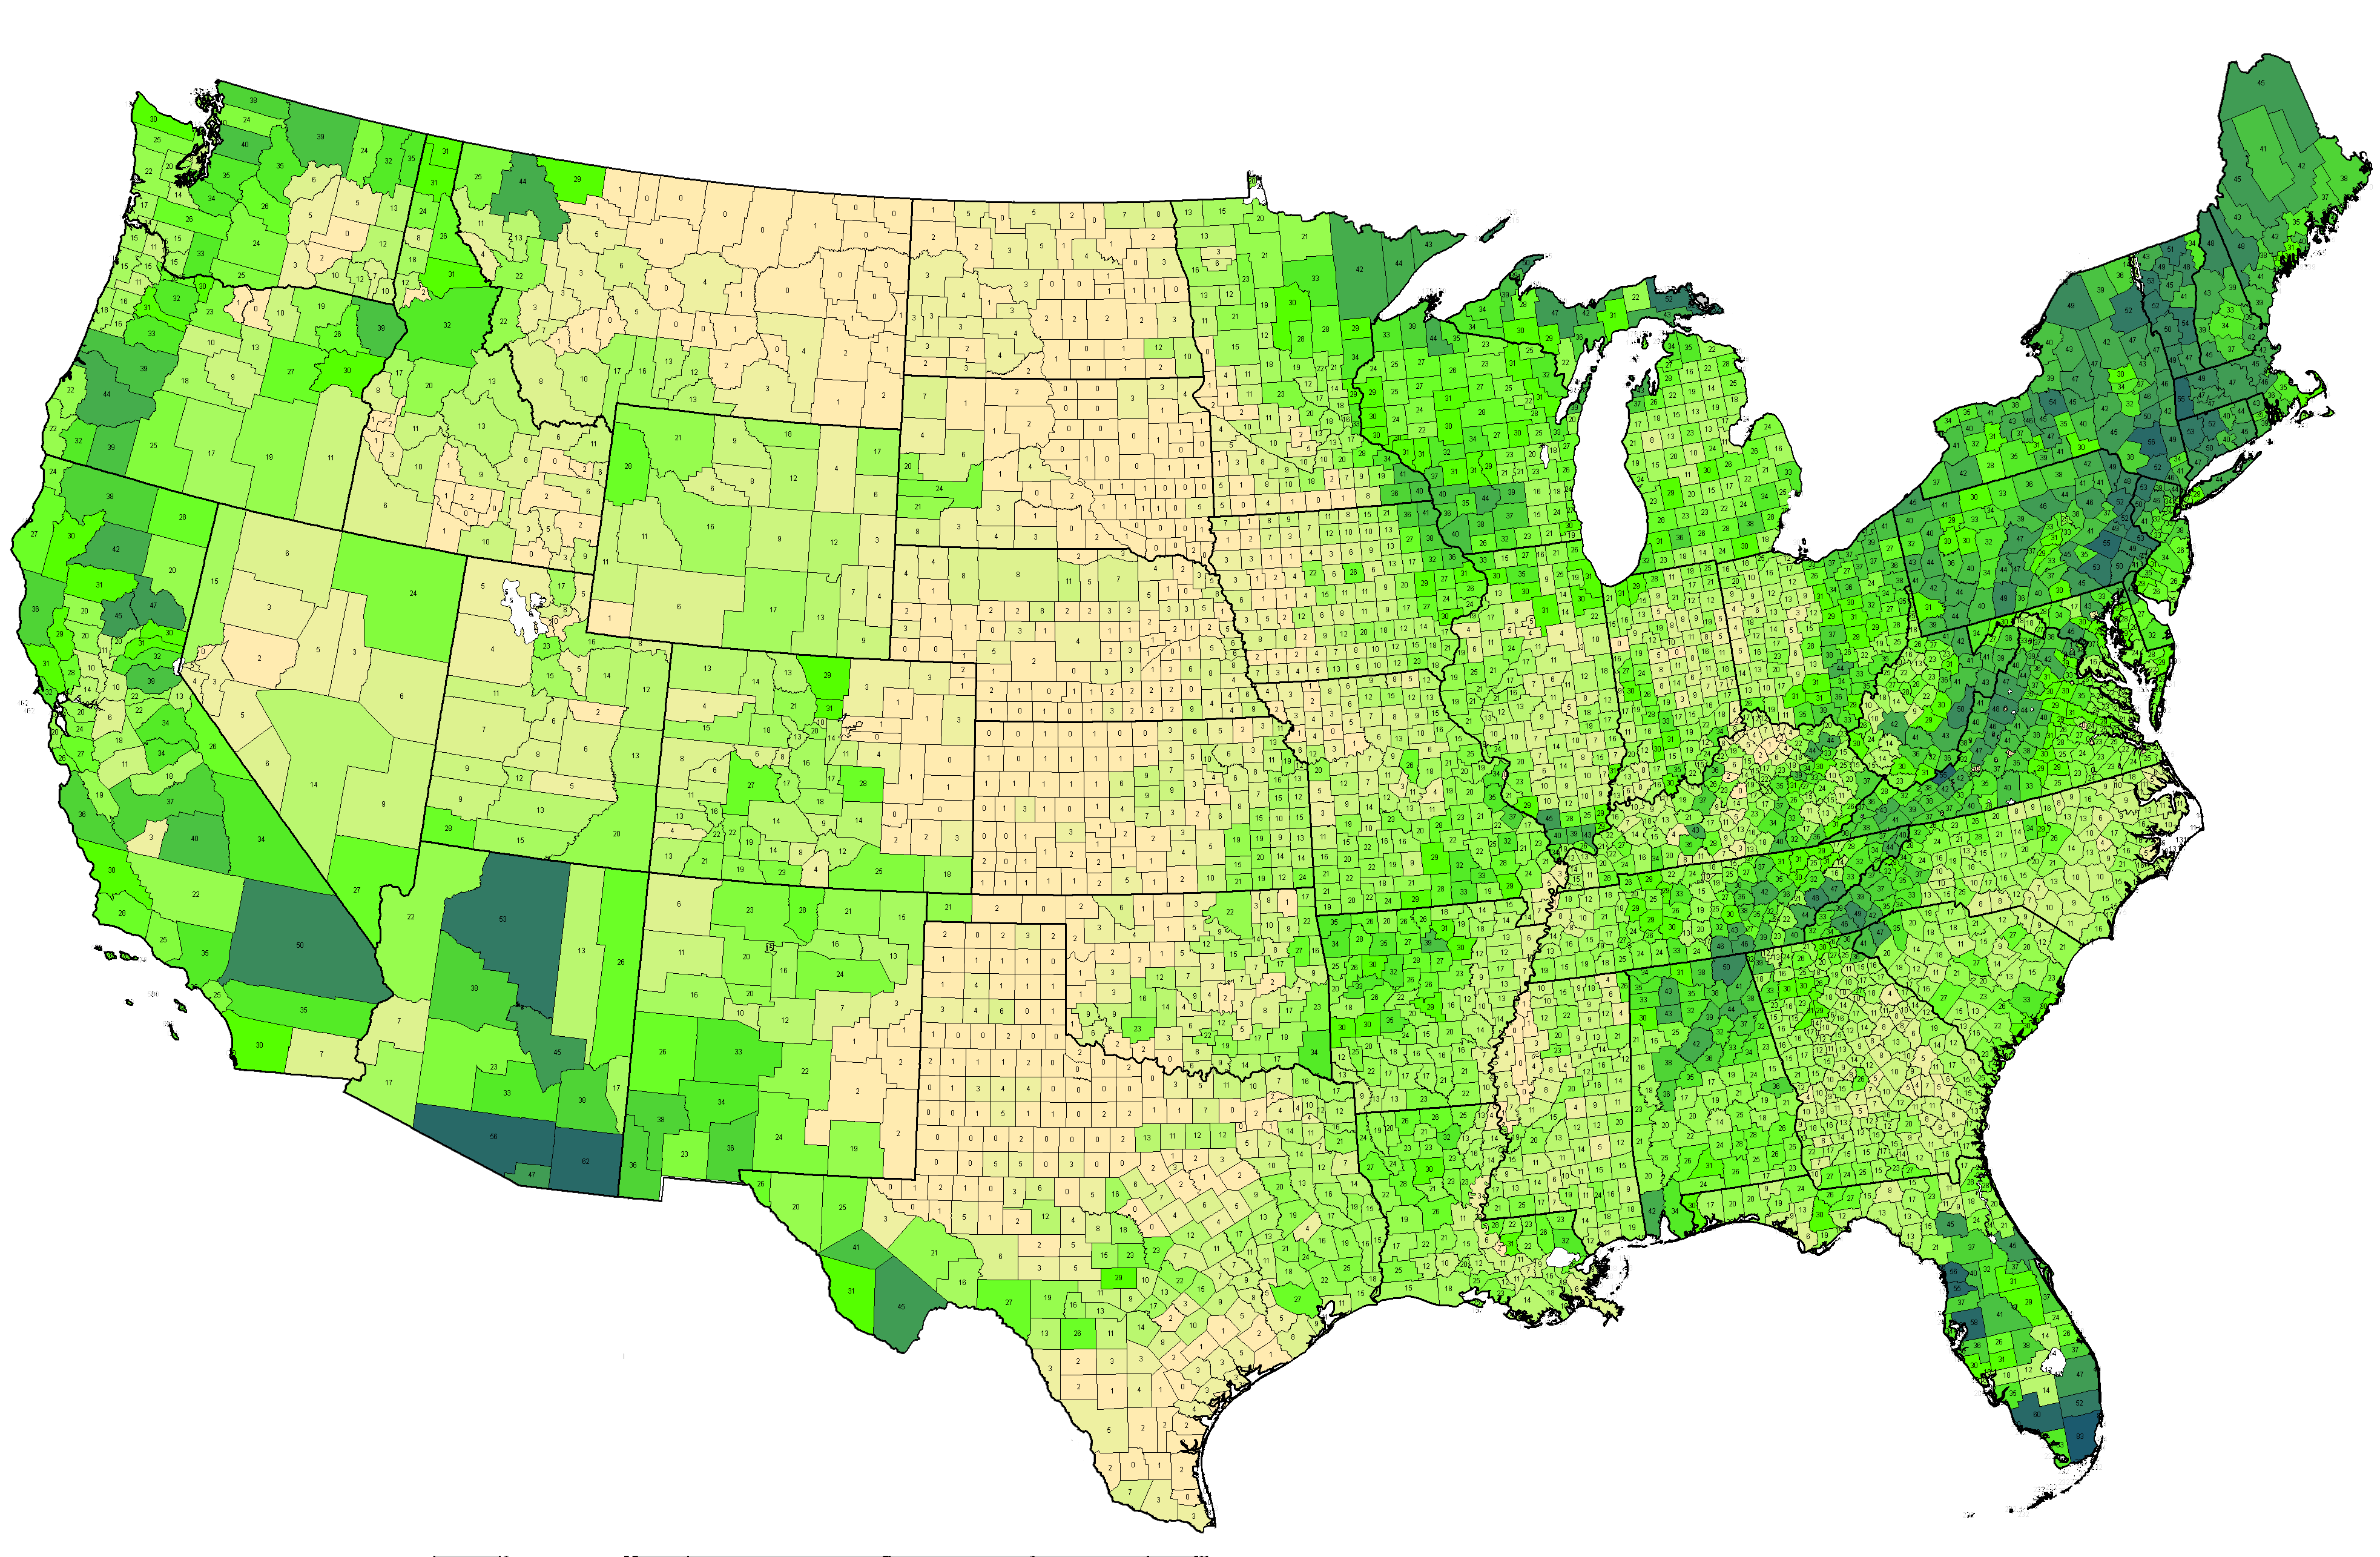
Actual number of US National Endemic taxa (excludes microspecies of Rubus and Crataegus) recorded from each county (data 2011). ©BONAP
| 
Actual number of US State Endemic taxa (excludes microspecies of Rubus and Crataegus) recorded from each county (data 2011). ©BONAP
| 
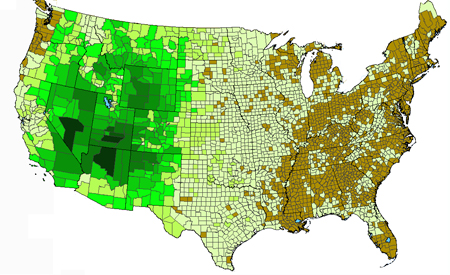
Plant species with limited distributions. The actual numbers reflect internal calculation values and do not indicate species numbers. (data 2008). ©BONAP
|
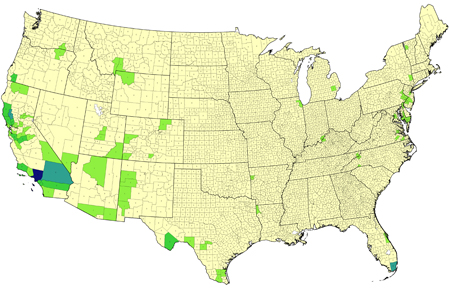
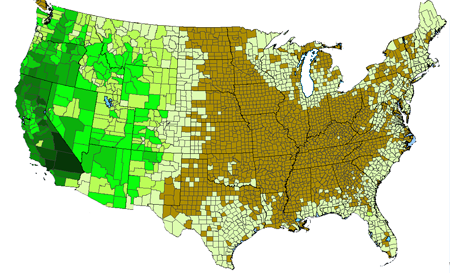
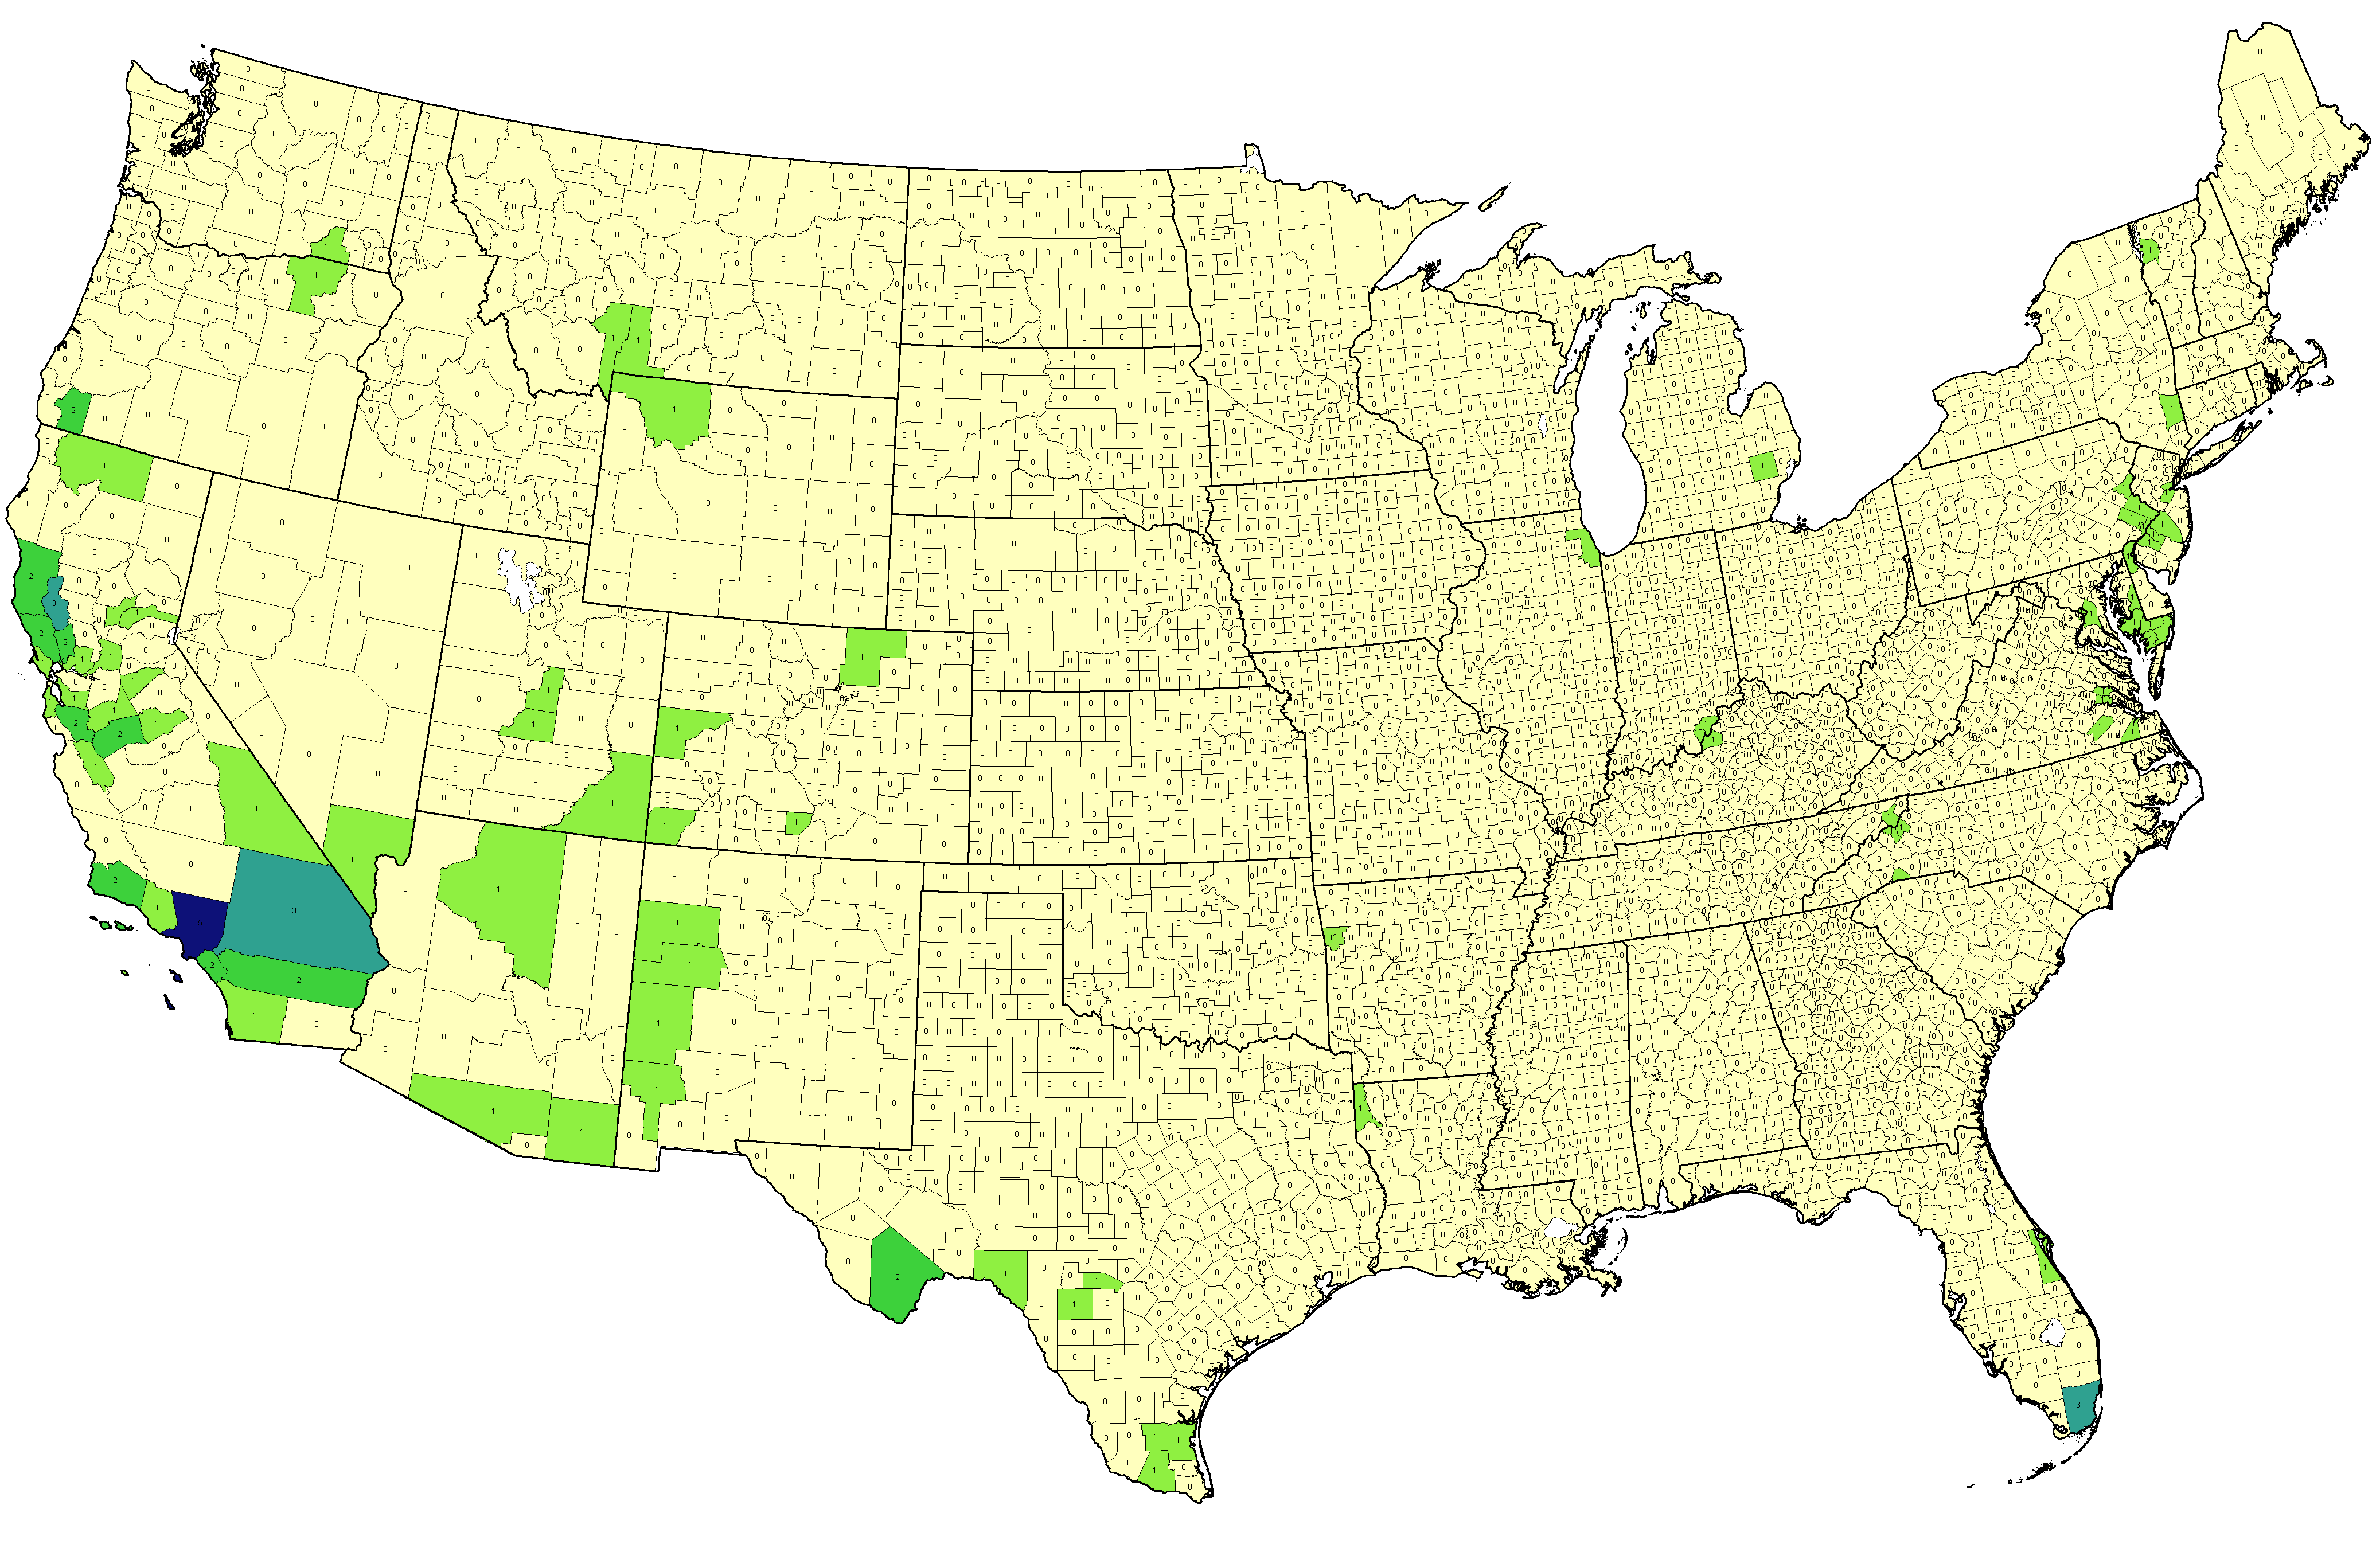
Actual number of extinct or possibly extinct species recorded from each county (data 2011). ©BONAP | 
Concentration of species saturation per county (data 2008). The actual numbers reflect internal calculation values and do not indicate species numbers. ©BONAP
| 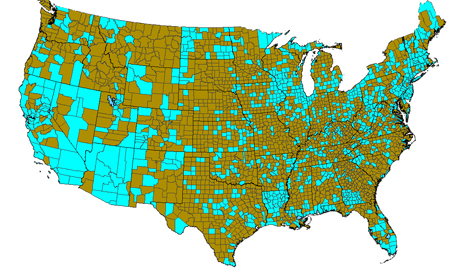
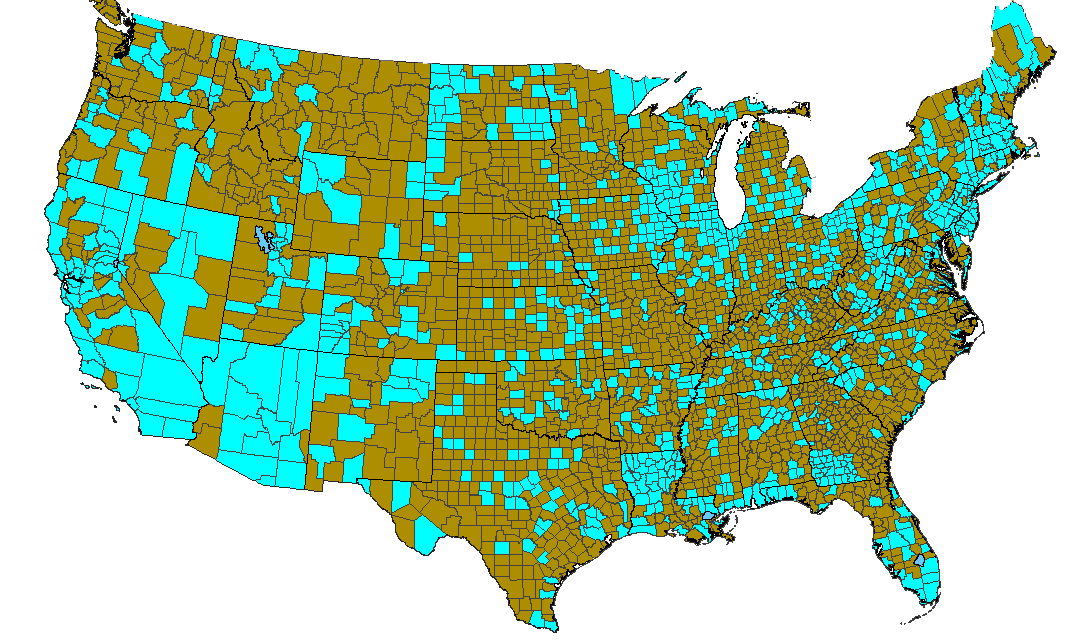
US Counties (in blue) with extensive floristic surveys/inventories plus those that house significant plant collections (herbaria/museums). (data 2011). ©BONAP |
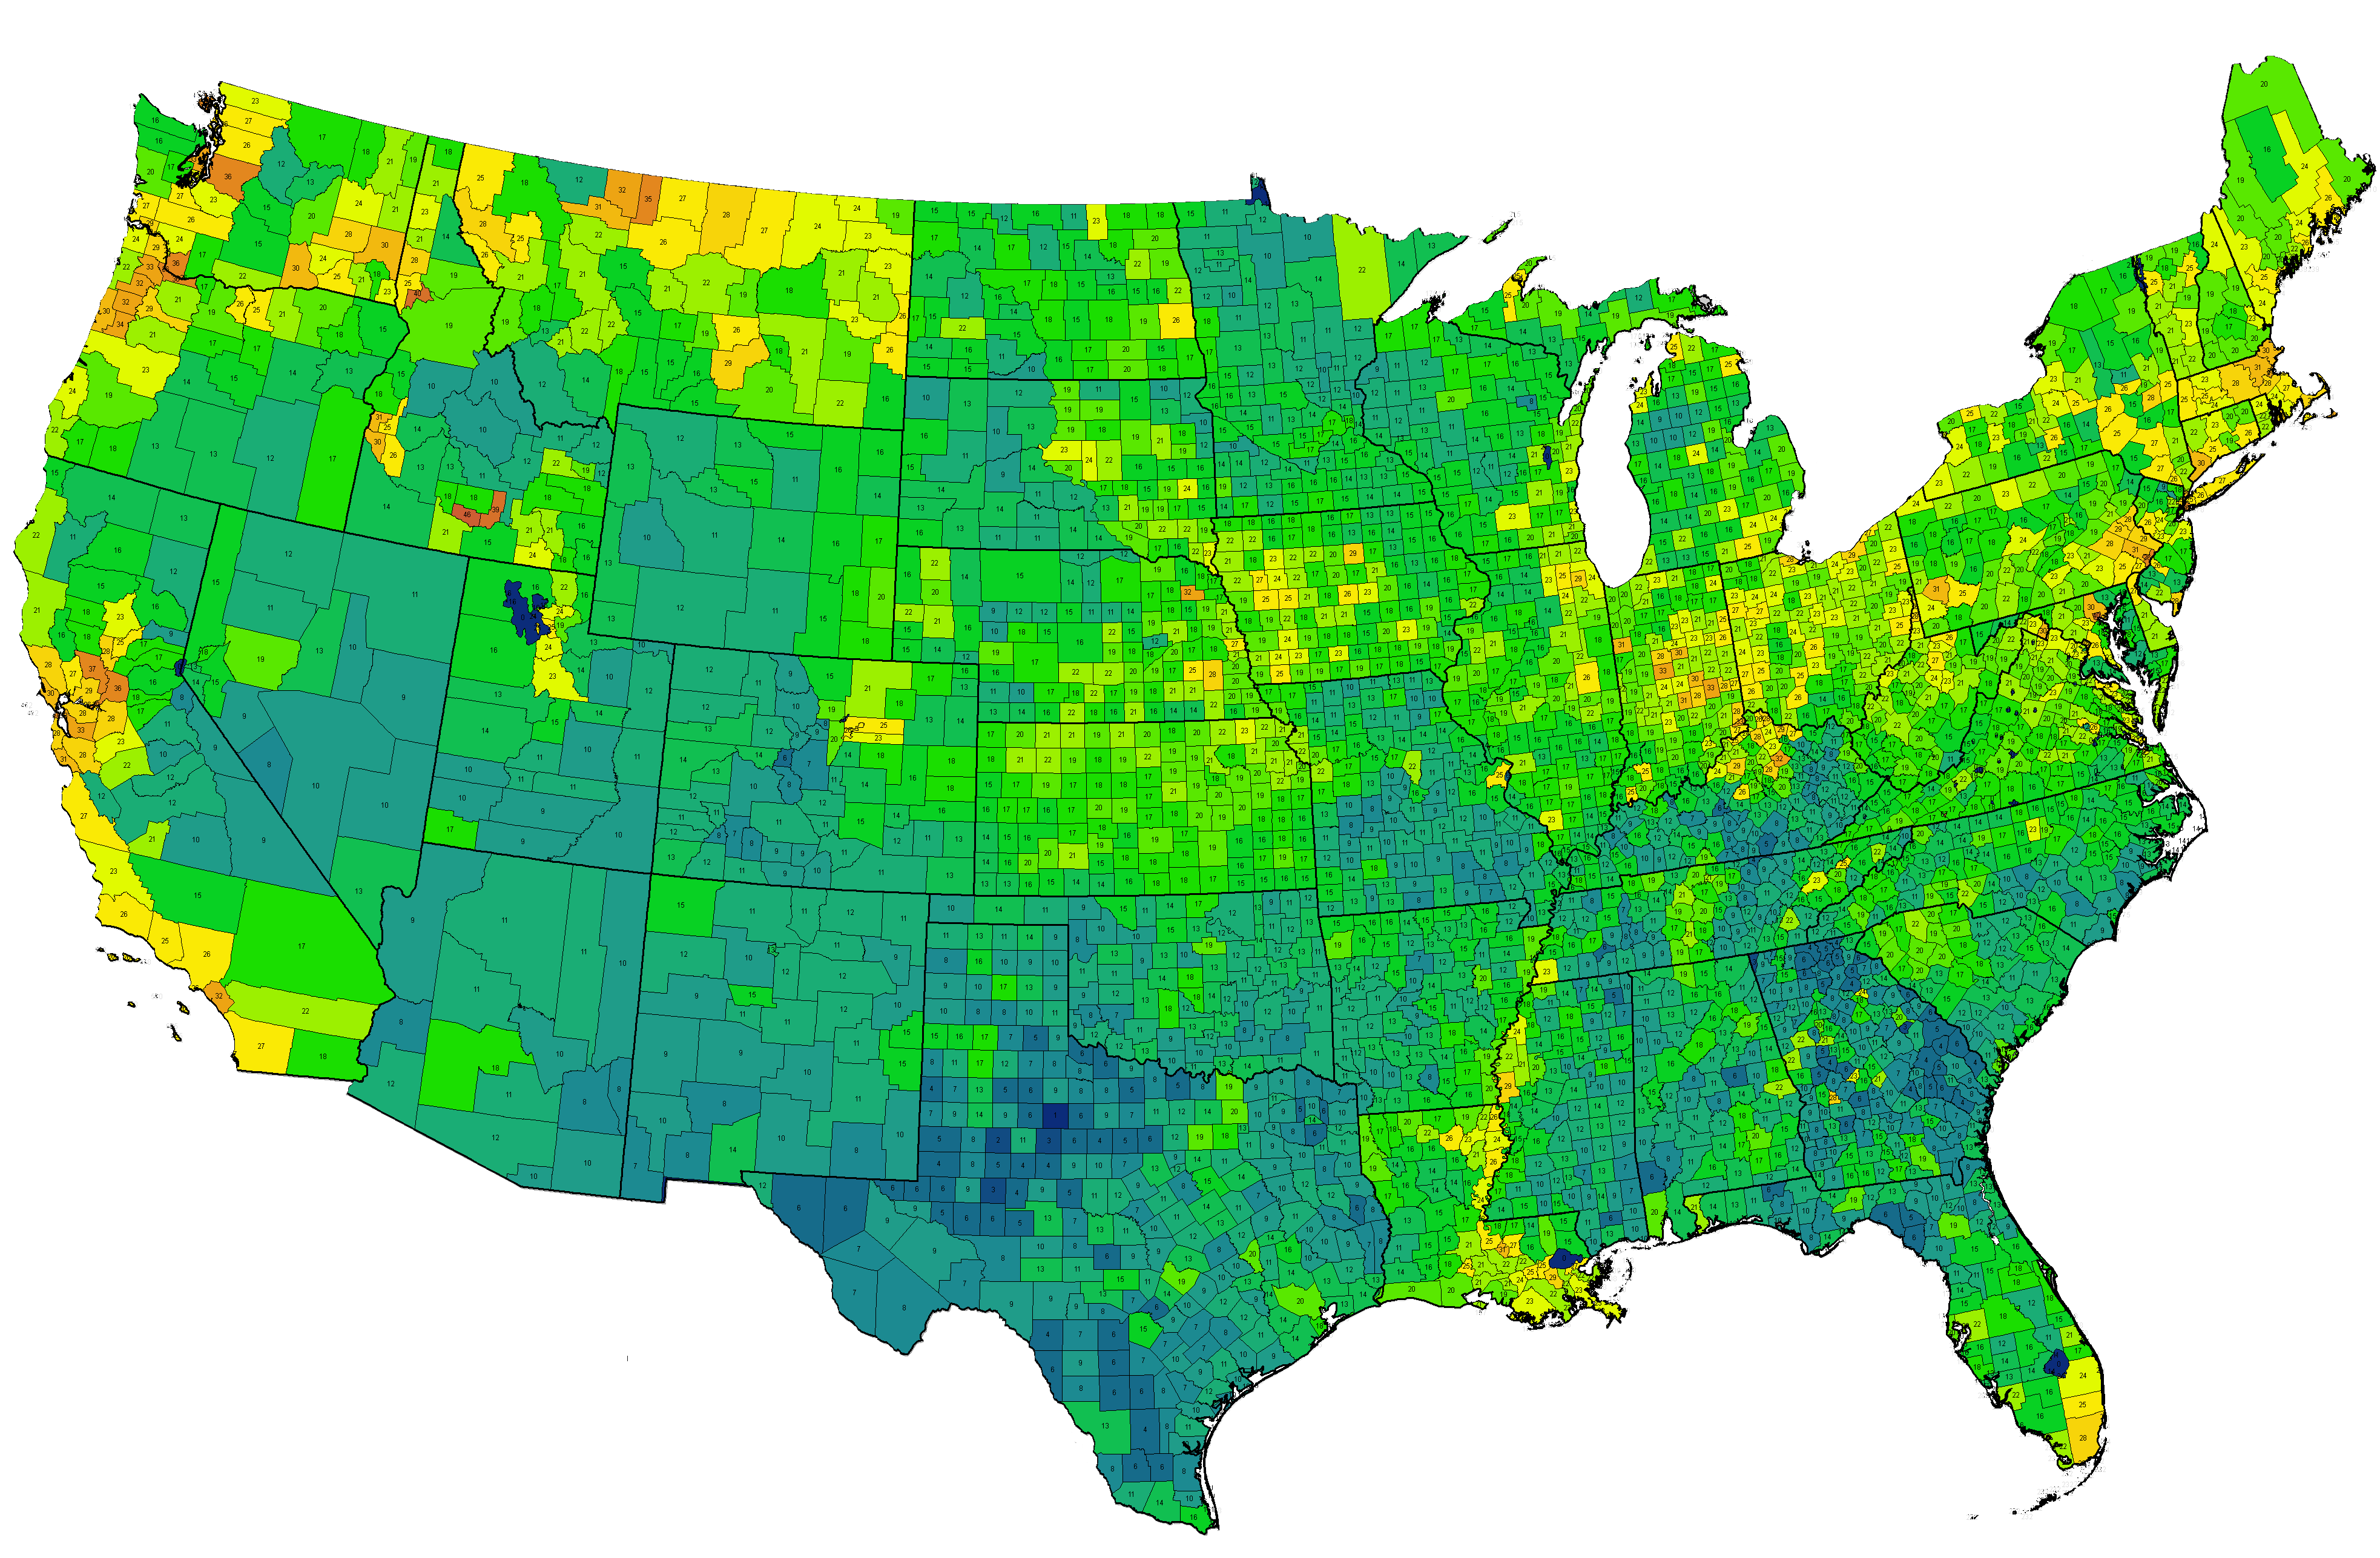
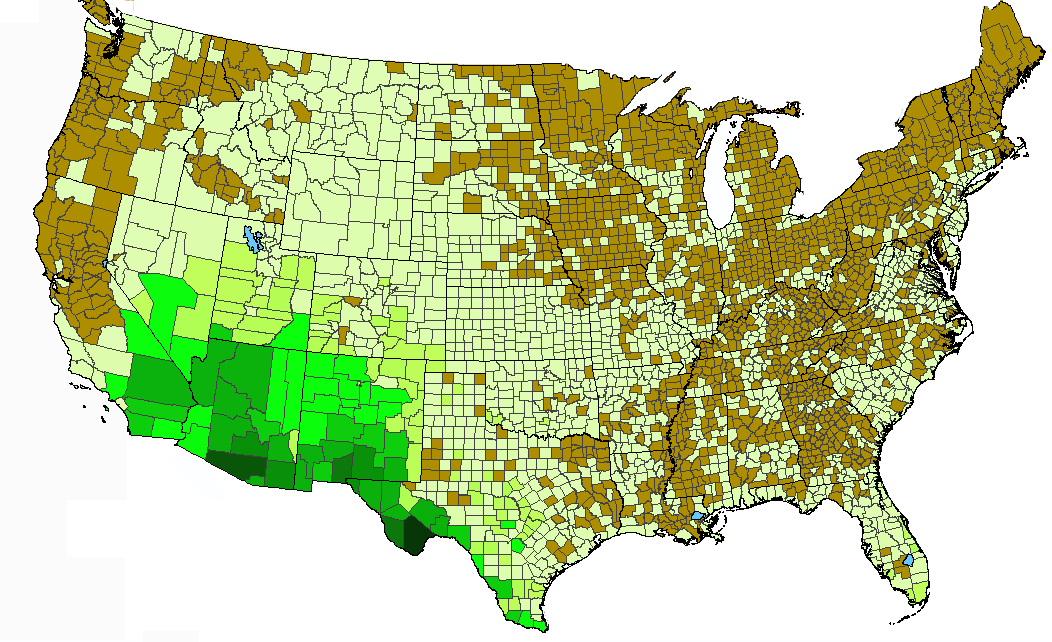
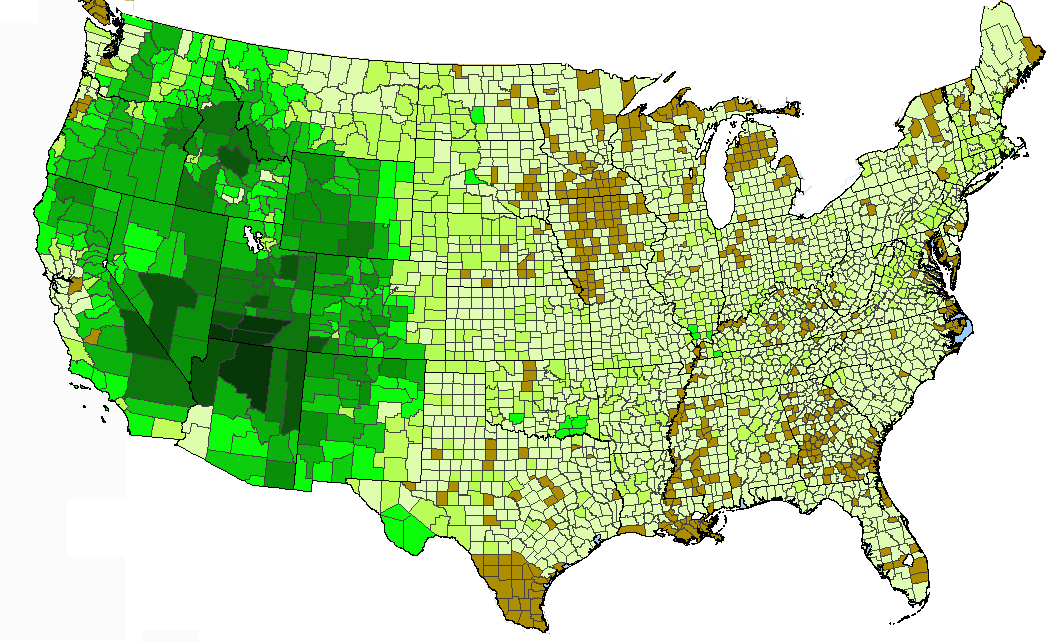
Percent exotic species based on actual values (data 2011). ©BONAP
| 
Concentration of exotic species per 10000 km2 (data 2008). The actual numbers reflect internal calculation values and do not indicate species numbers. ©BONAP
| 
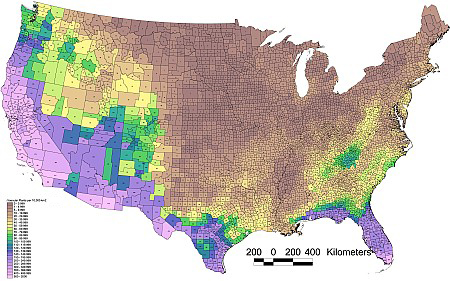
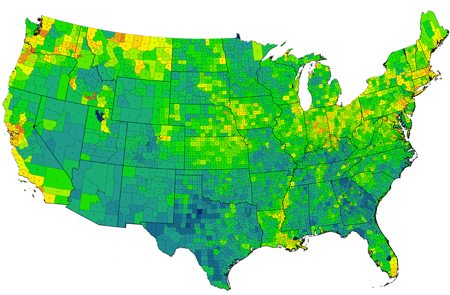
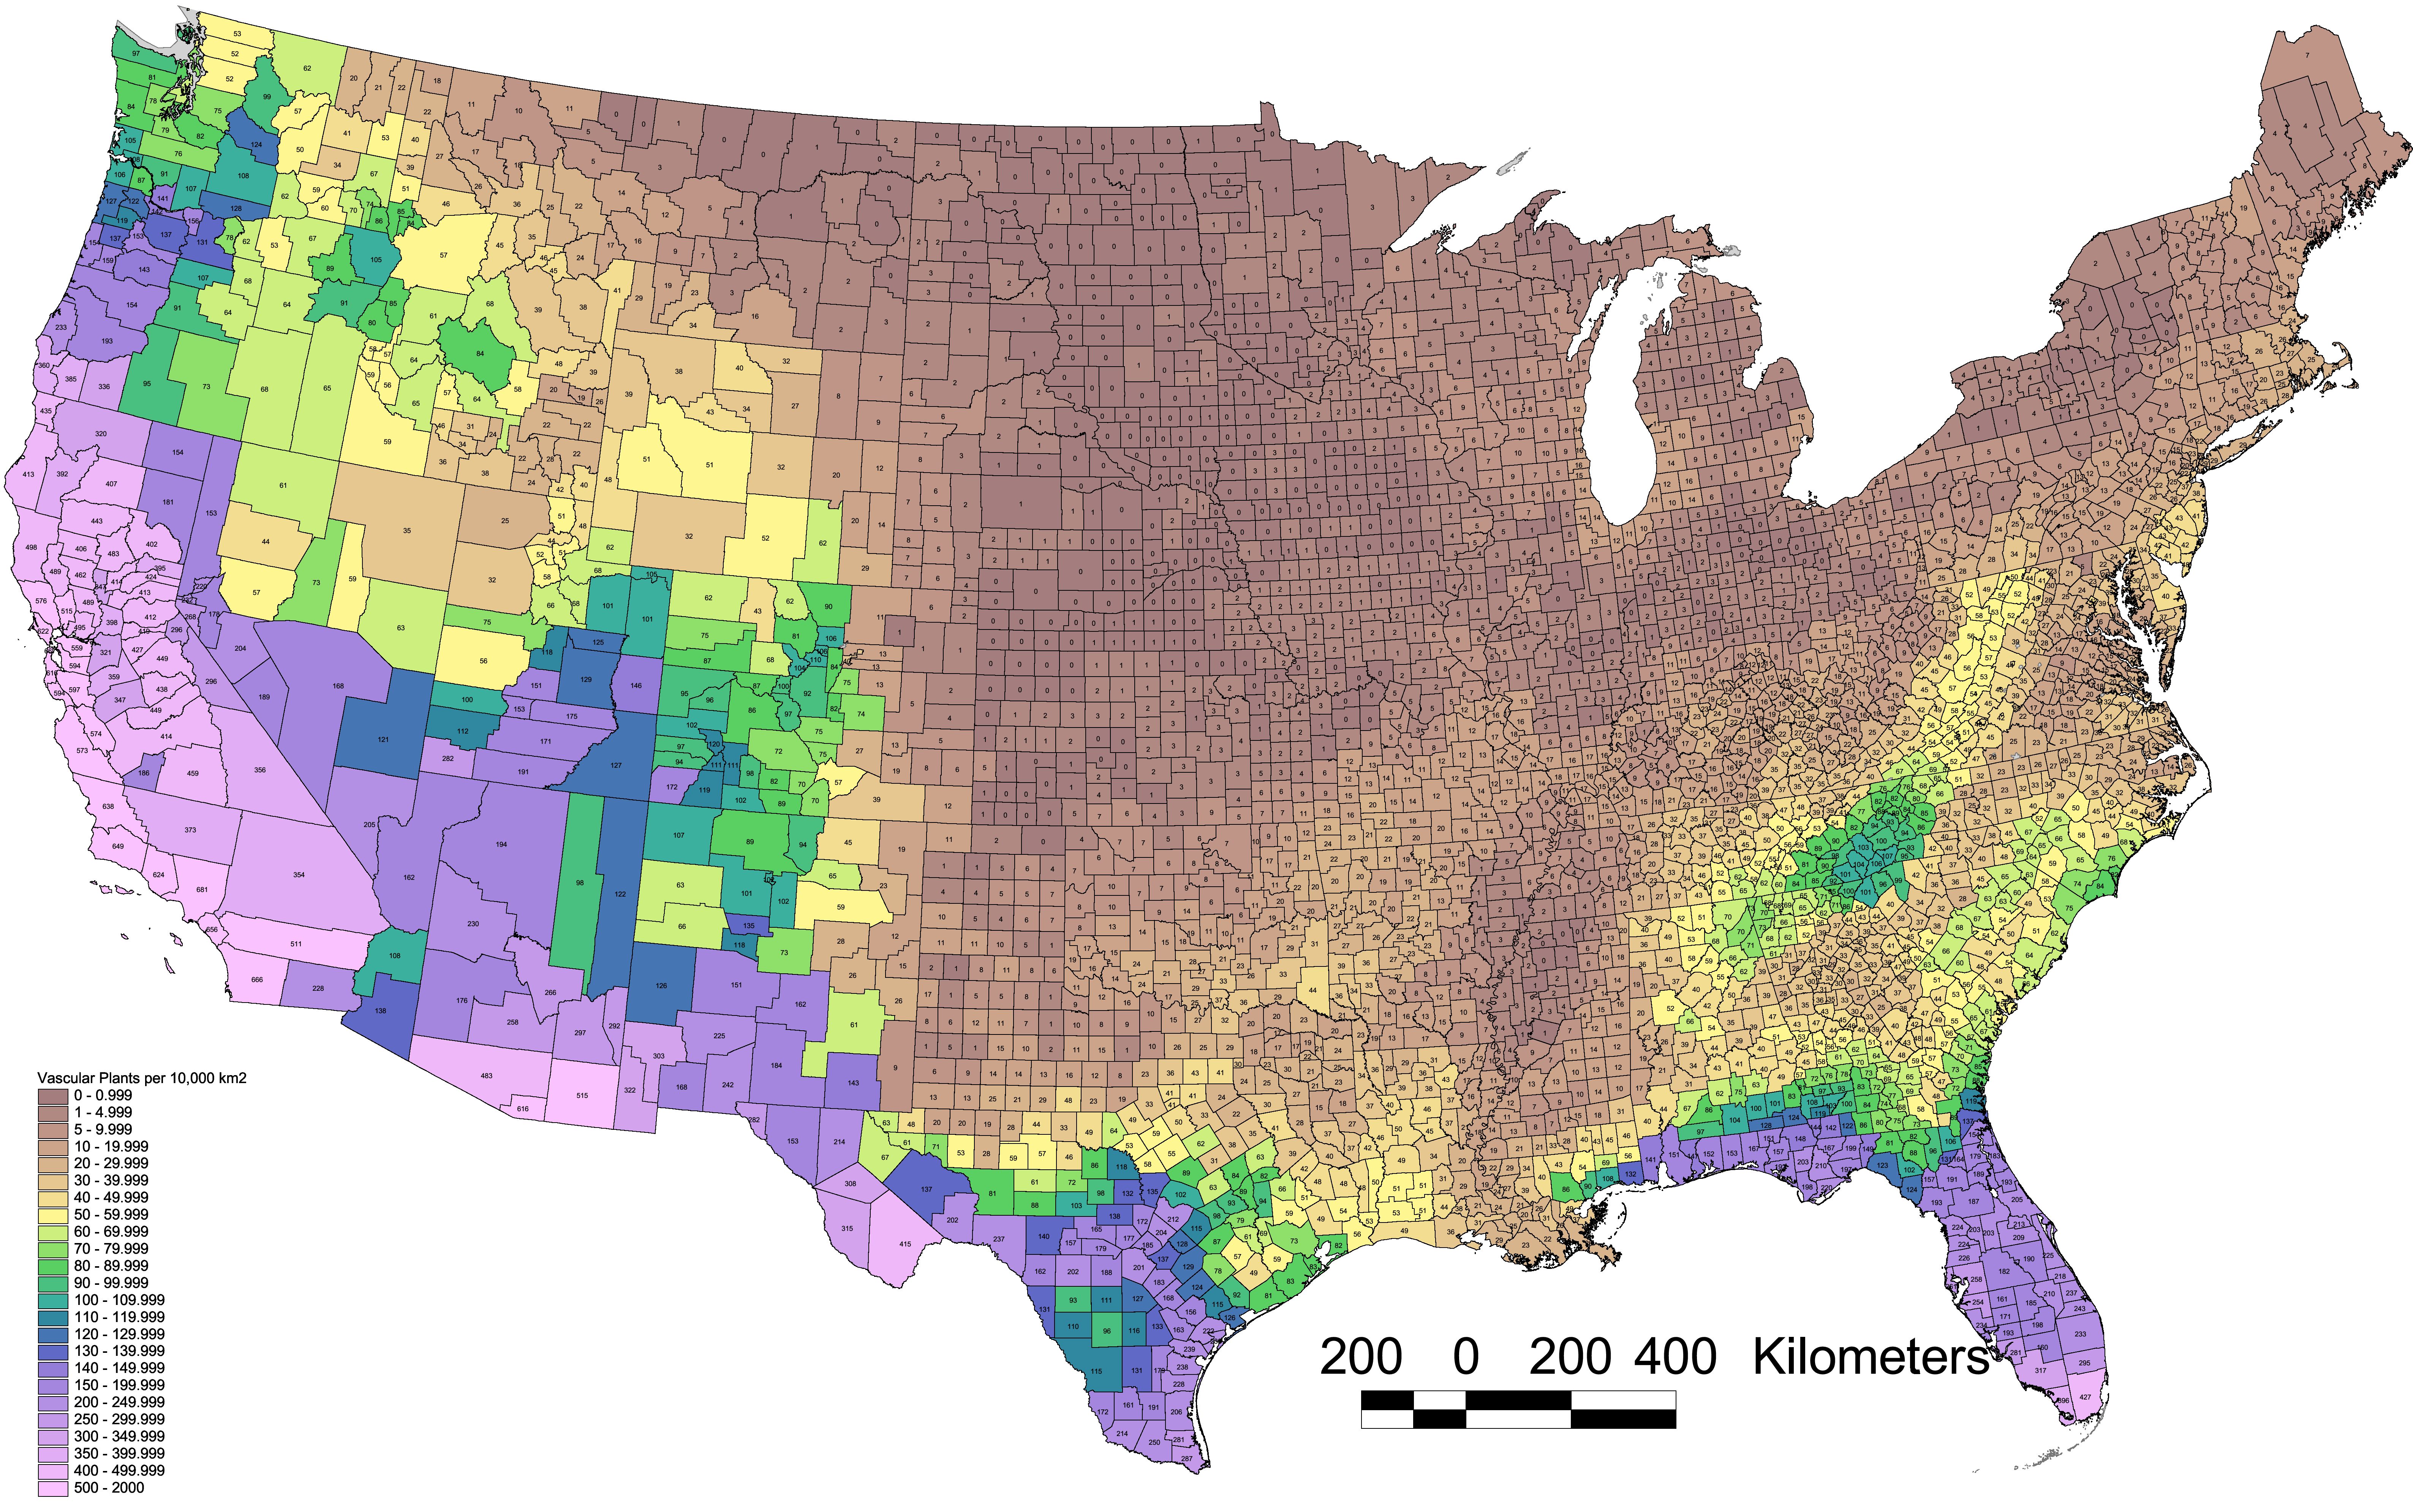
Contour map of native vascular plant density per 10000 km2 (data 2007). ©BONAP
|

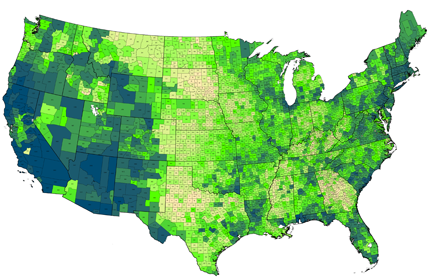
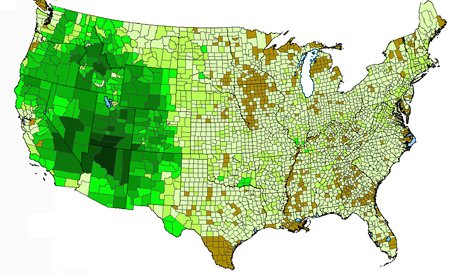
Concentration of species per 10000 km2 (data 2008). The actual numbers reflect internal calculation values and do not indicate species numbers. ©BONAP
| 
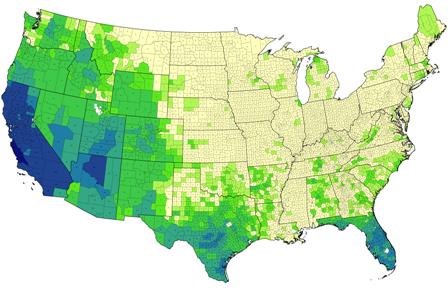
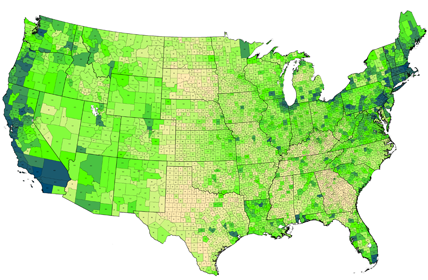
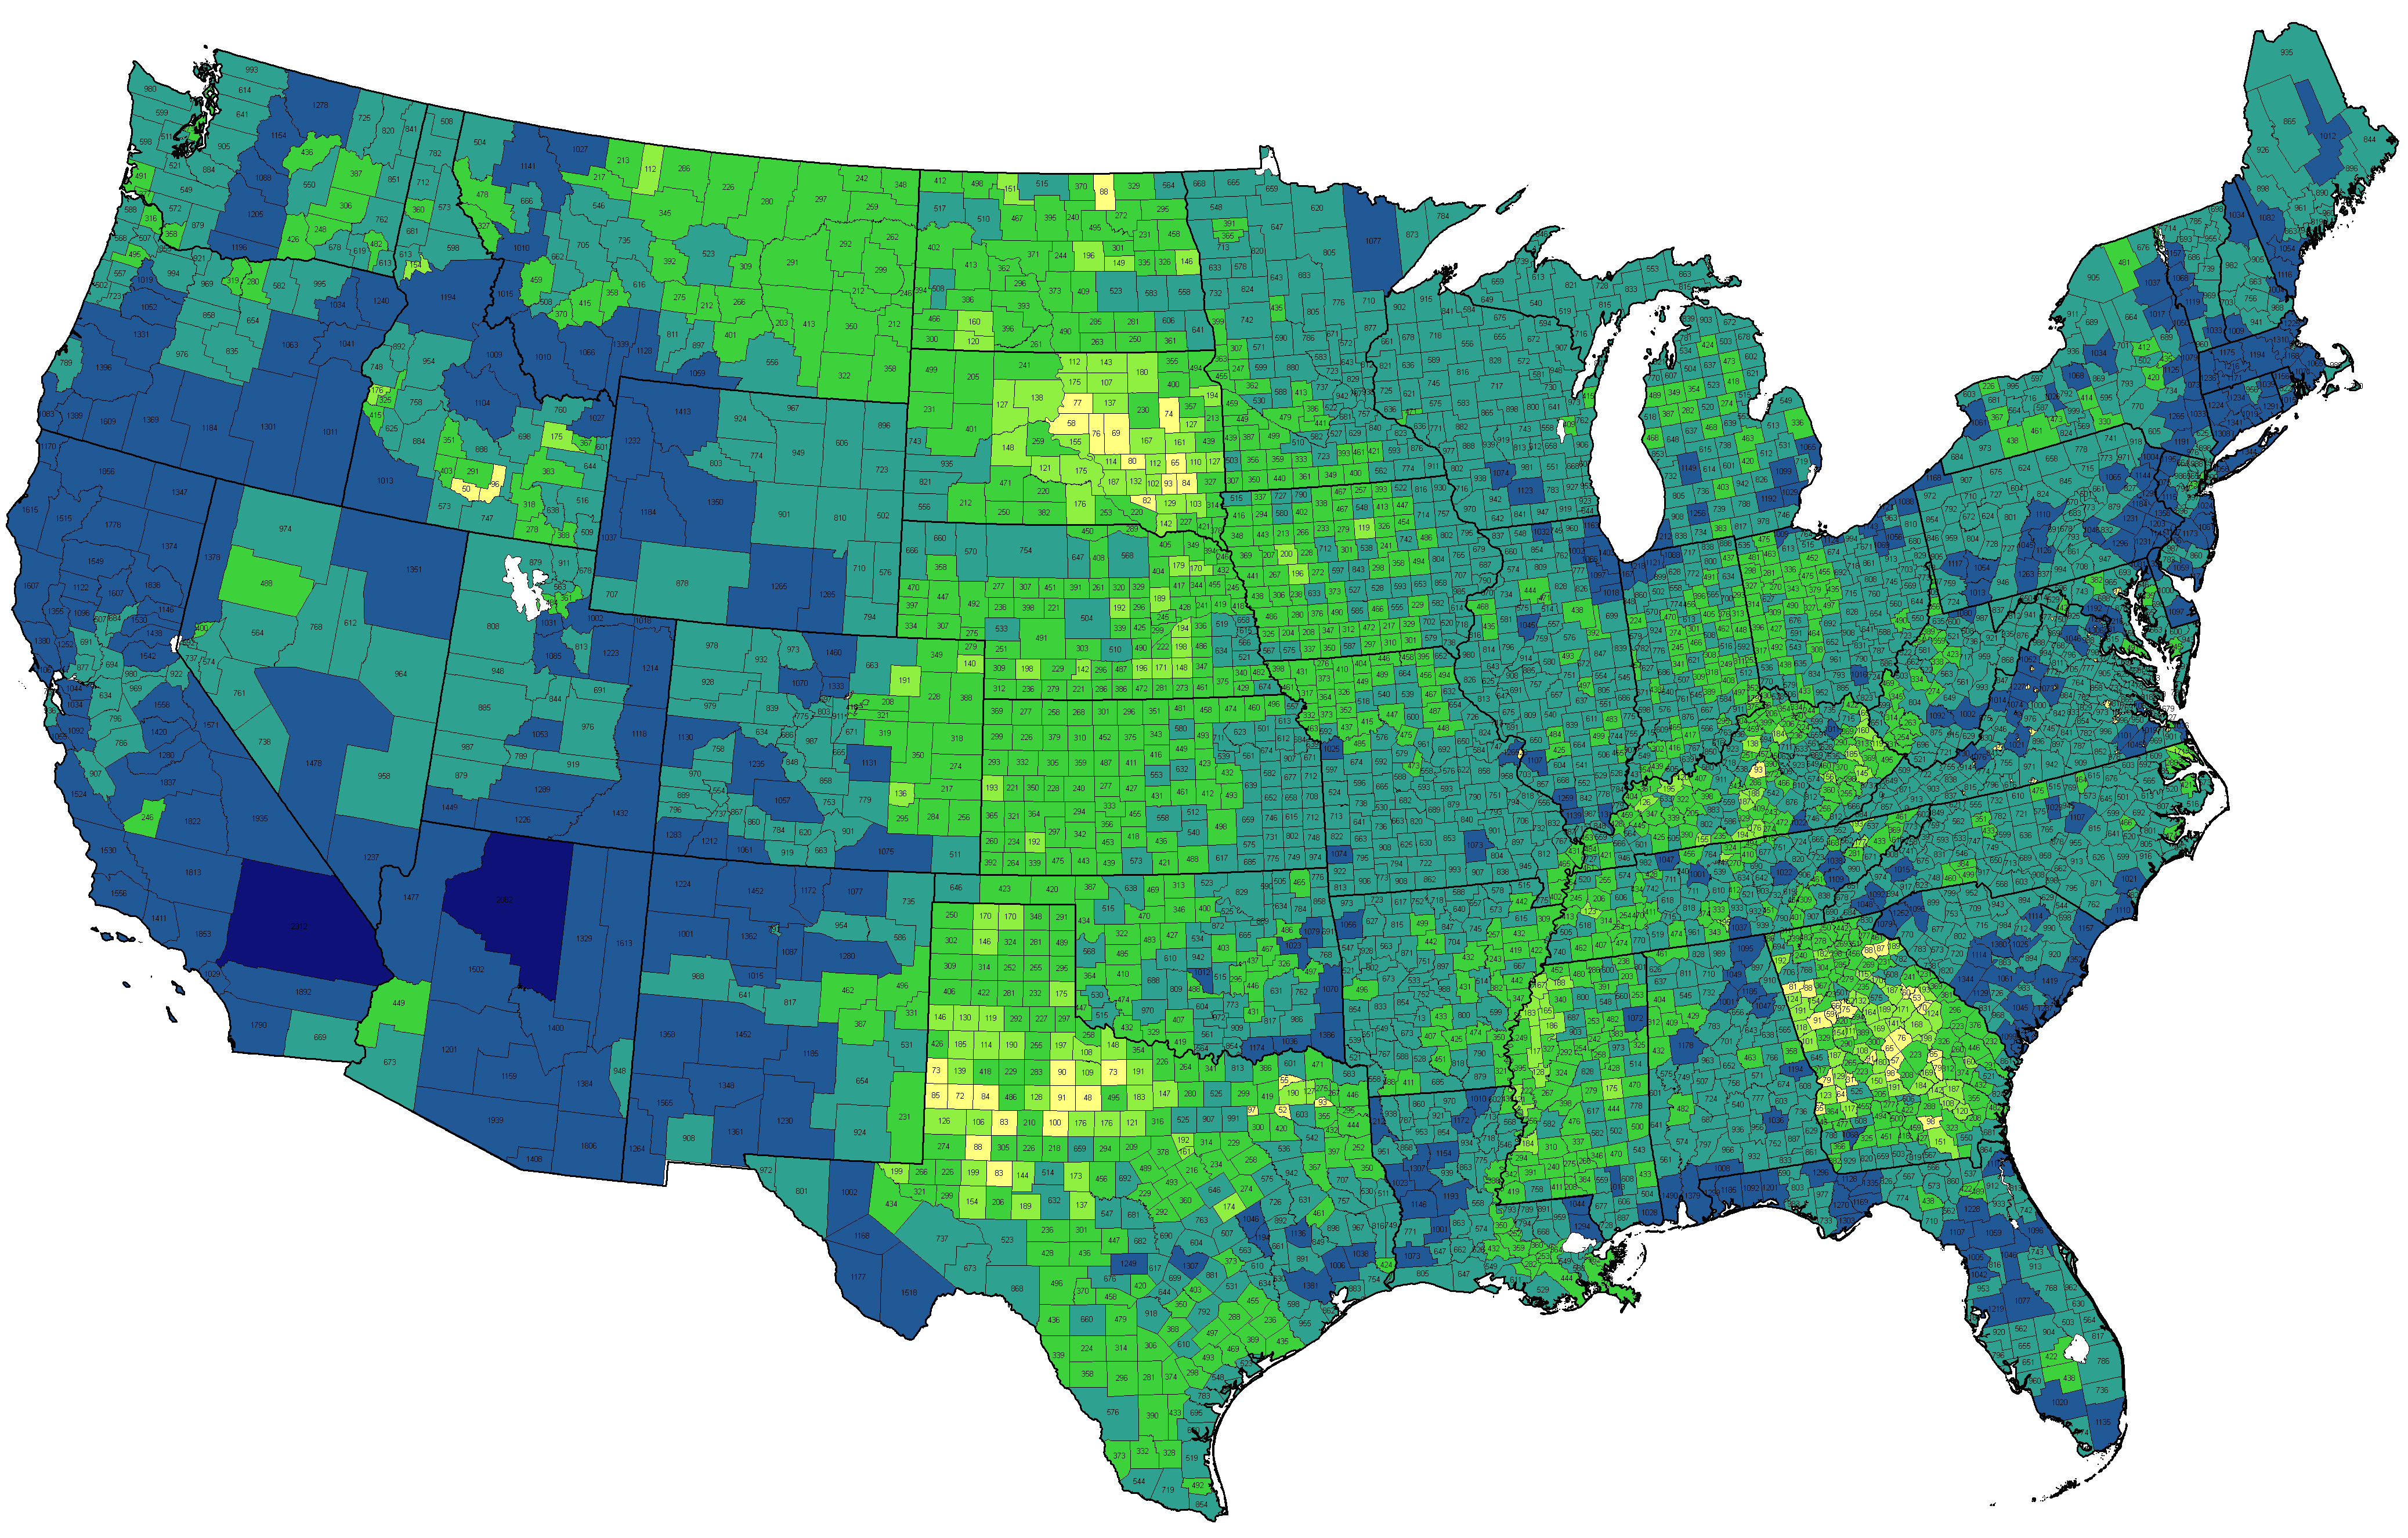
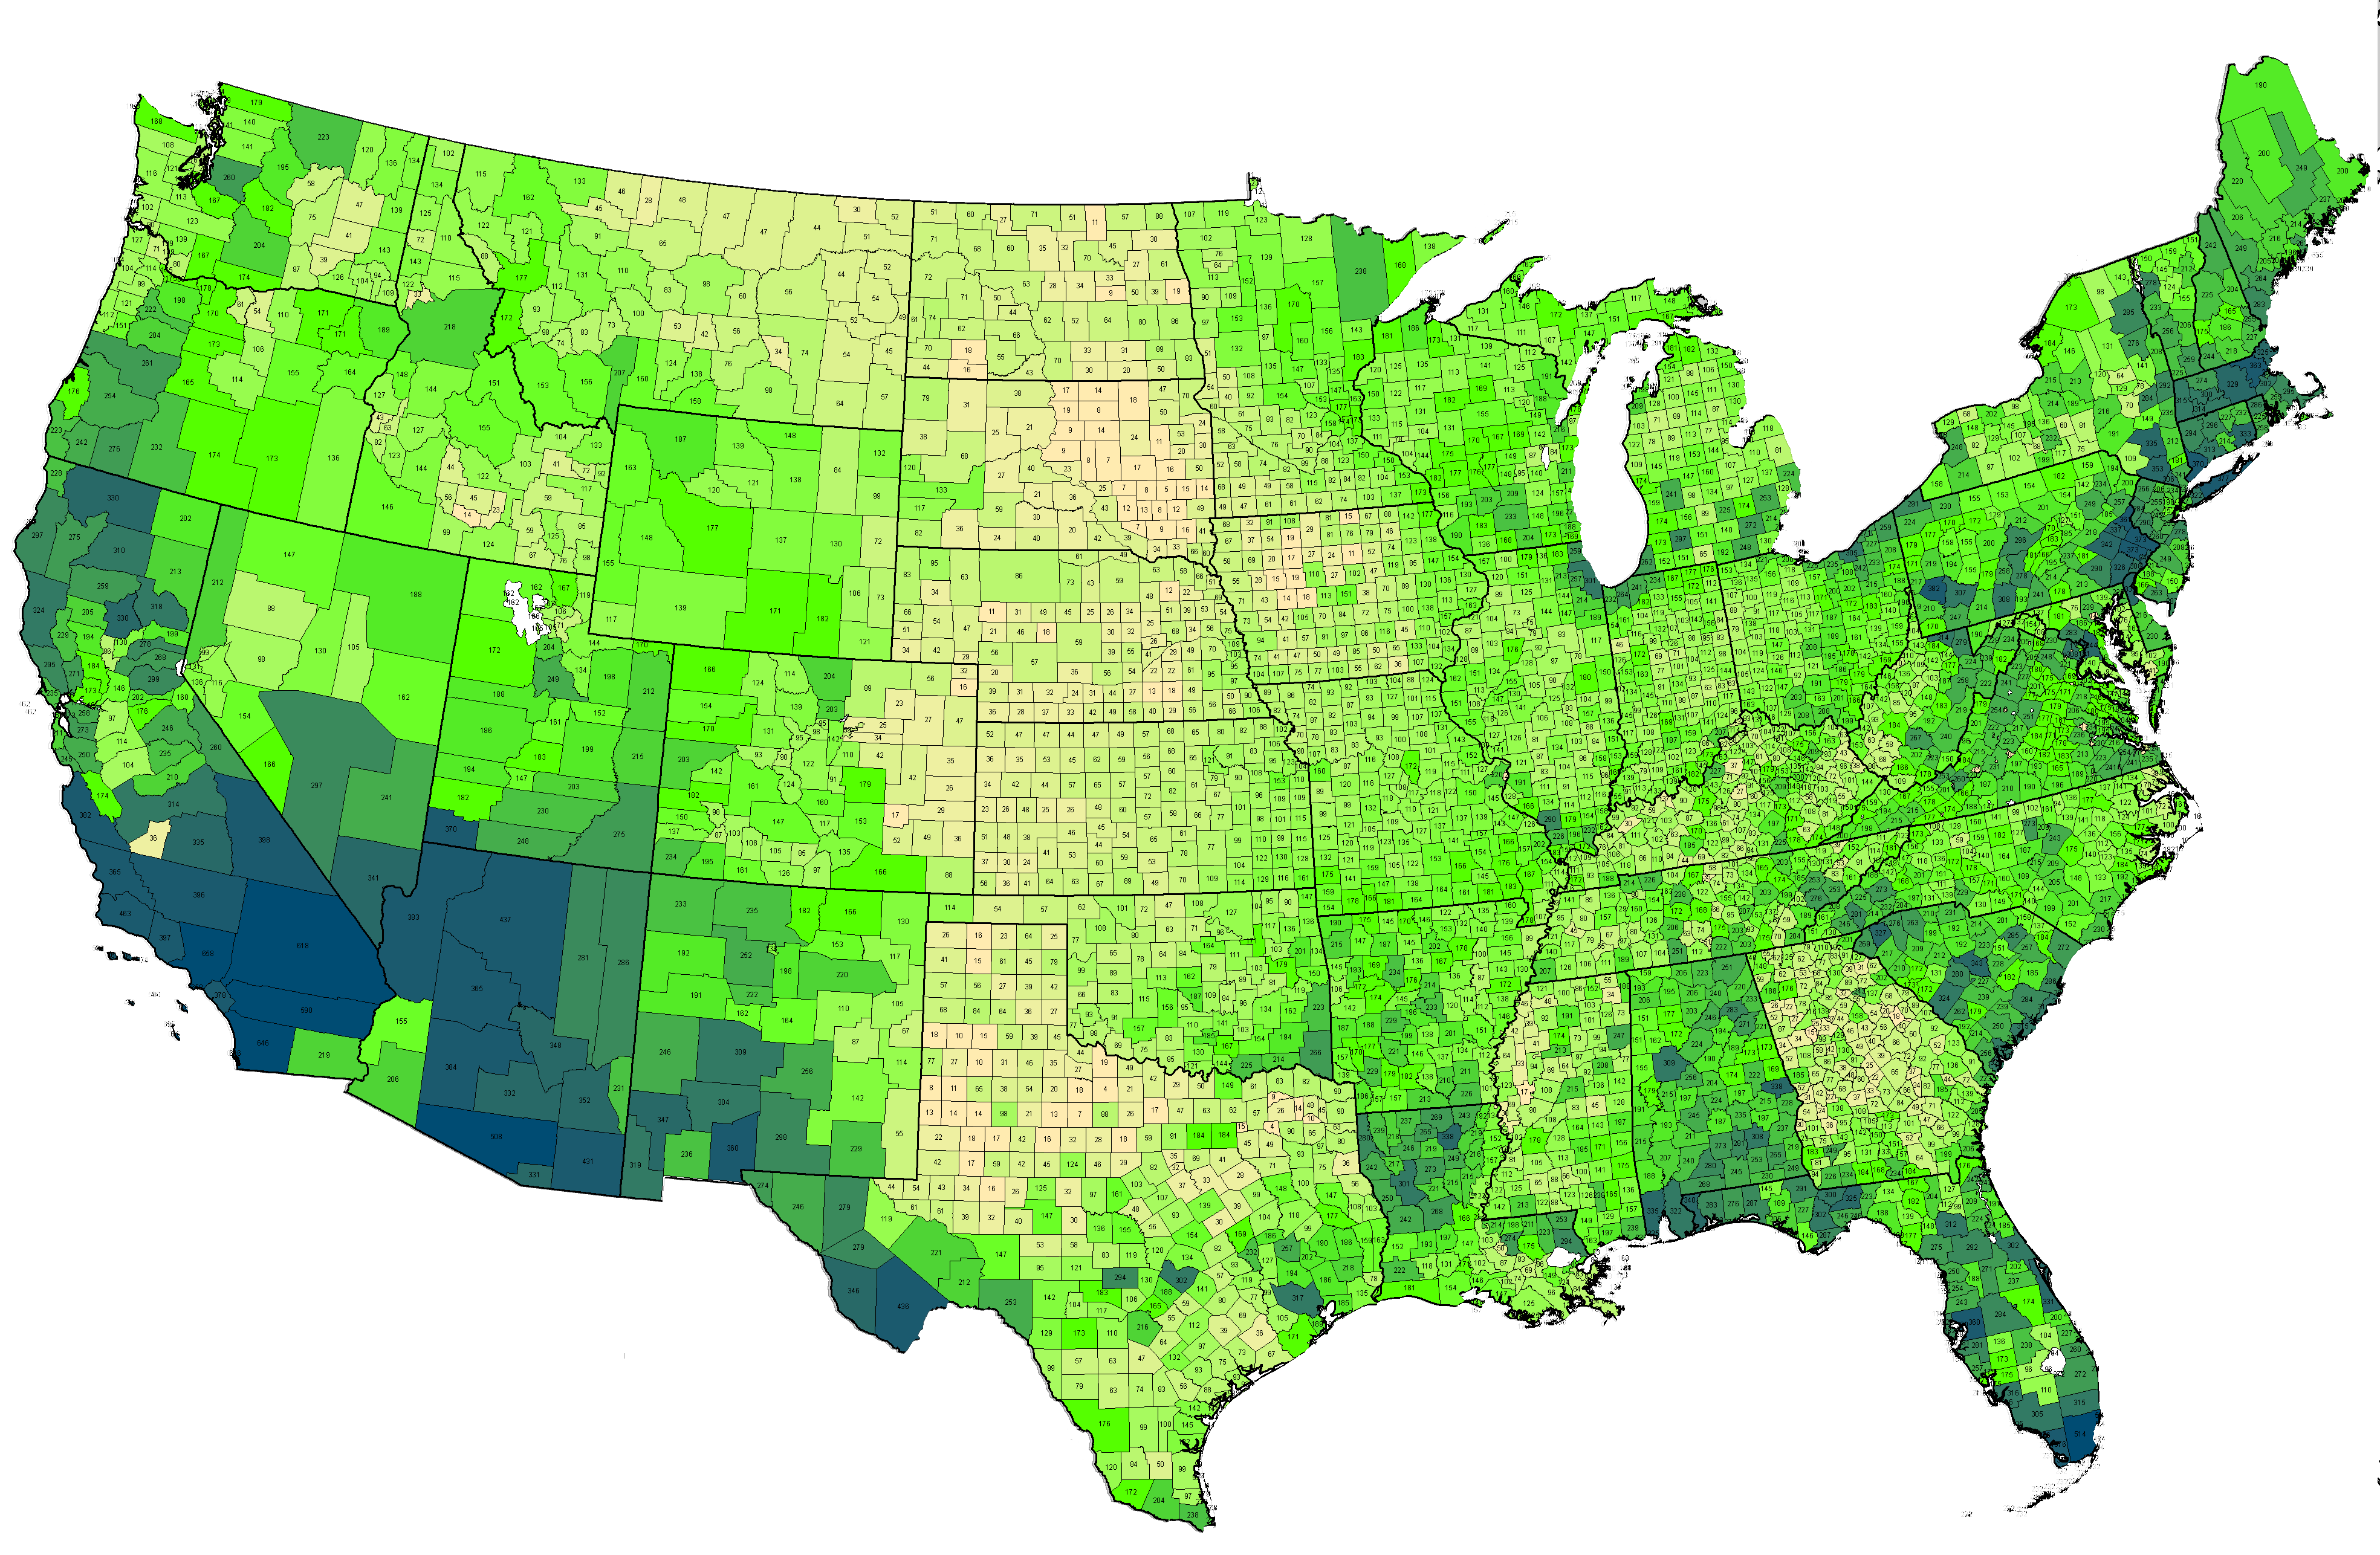
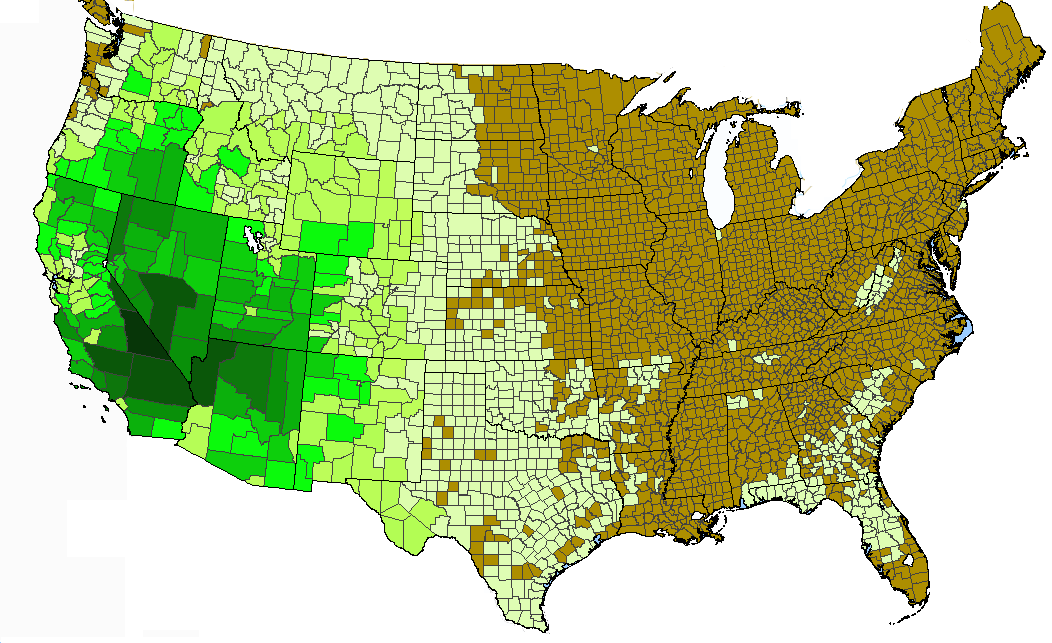
Actual number of native plus adventive species recorded from each county (data 2011). ©BONAP
| 
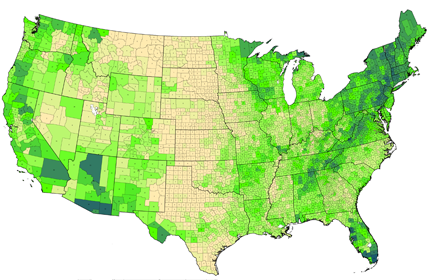
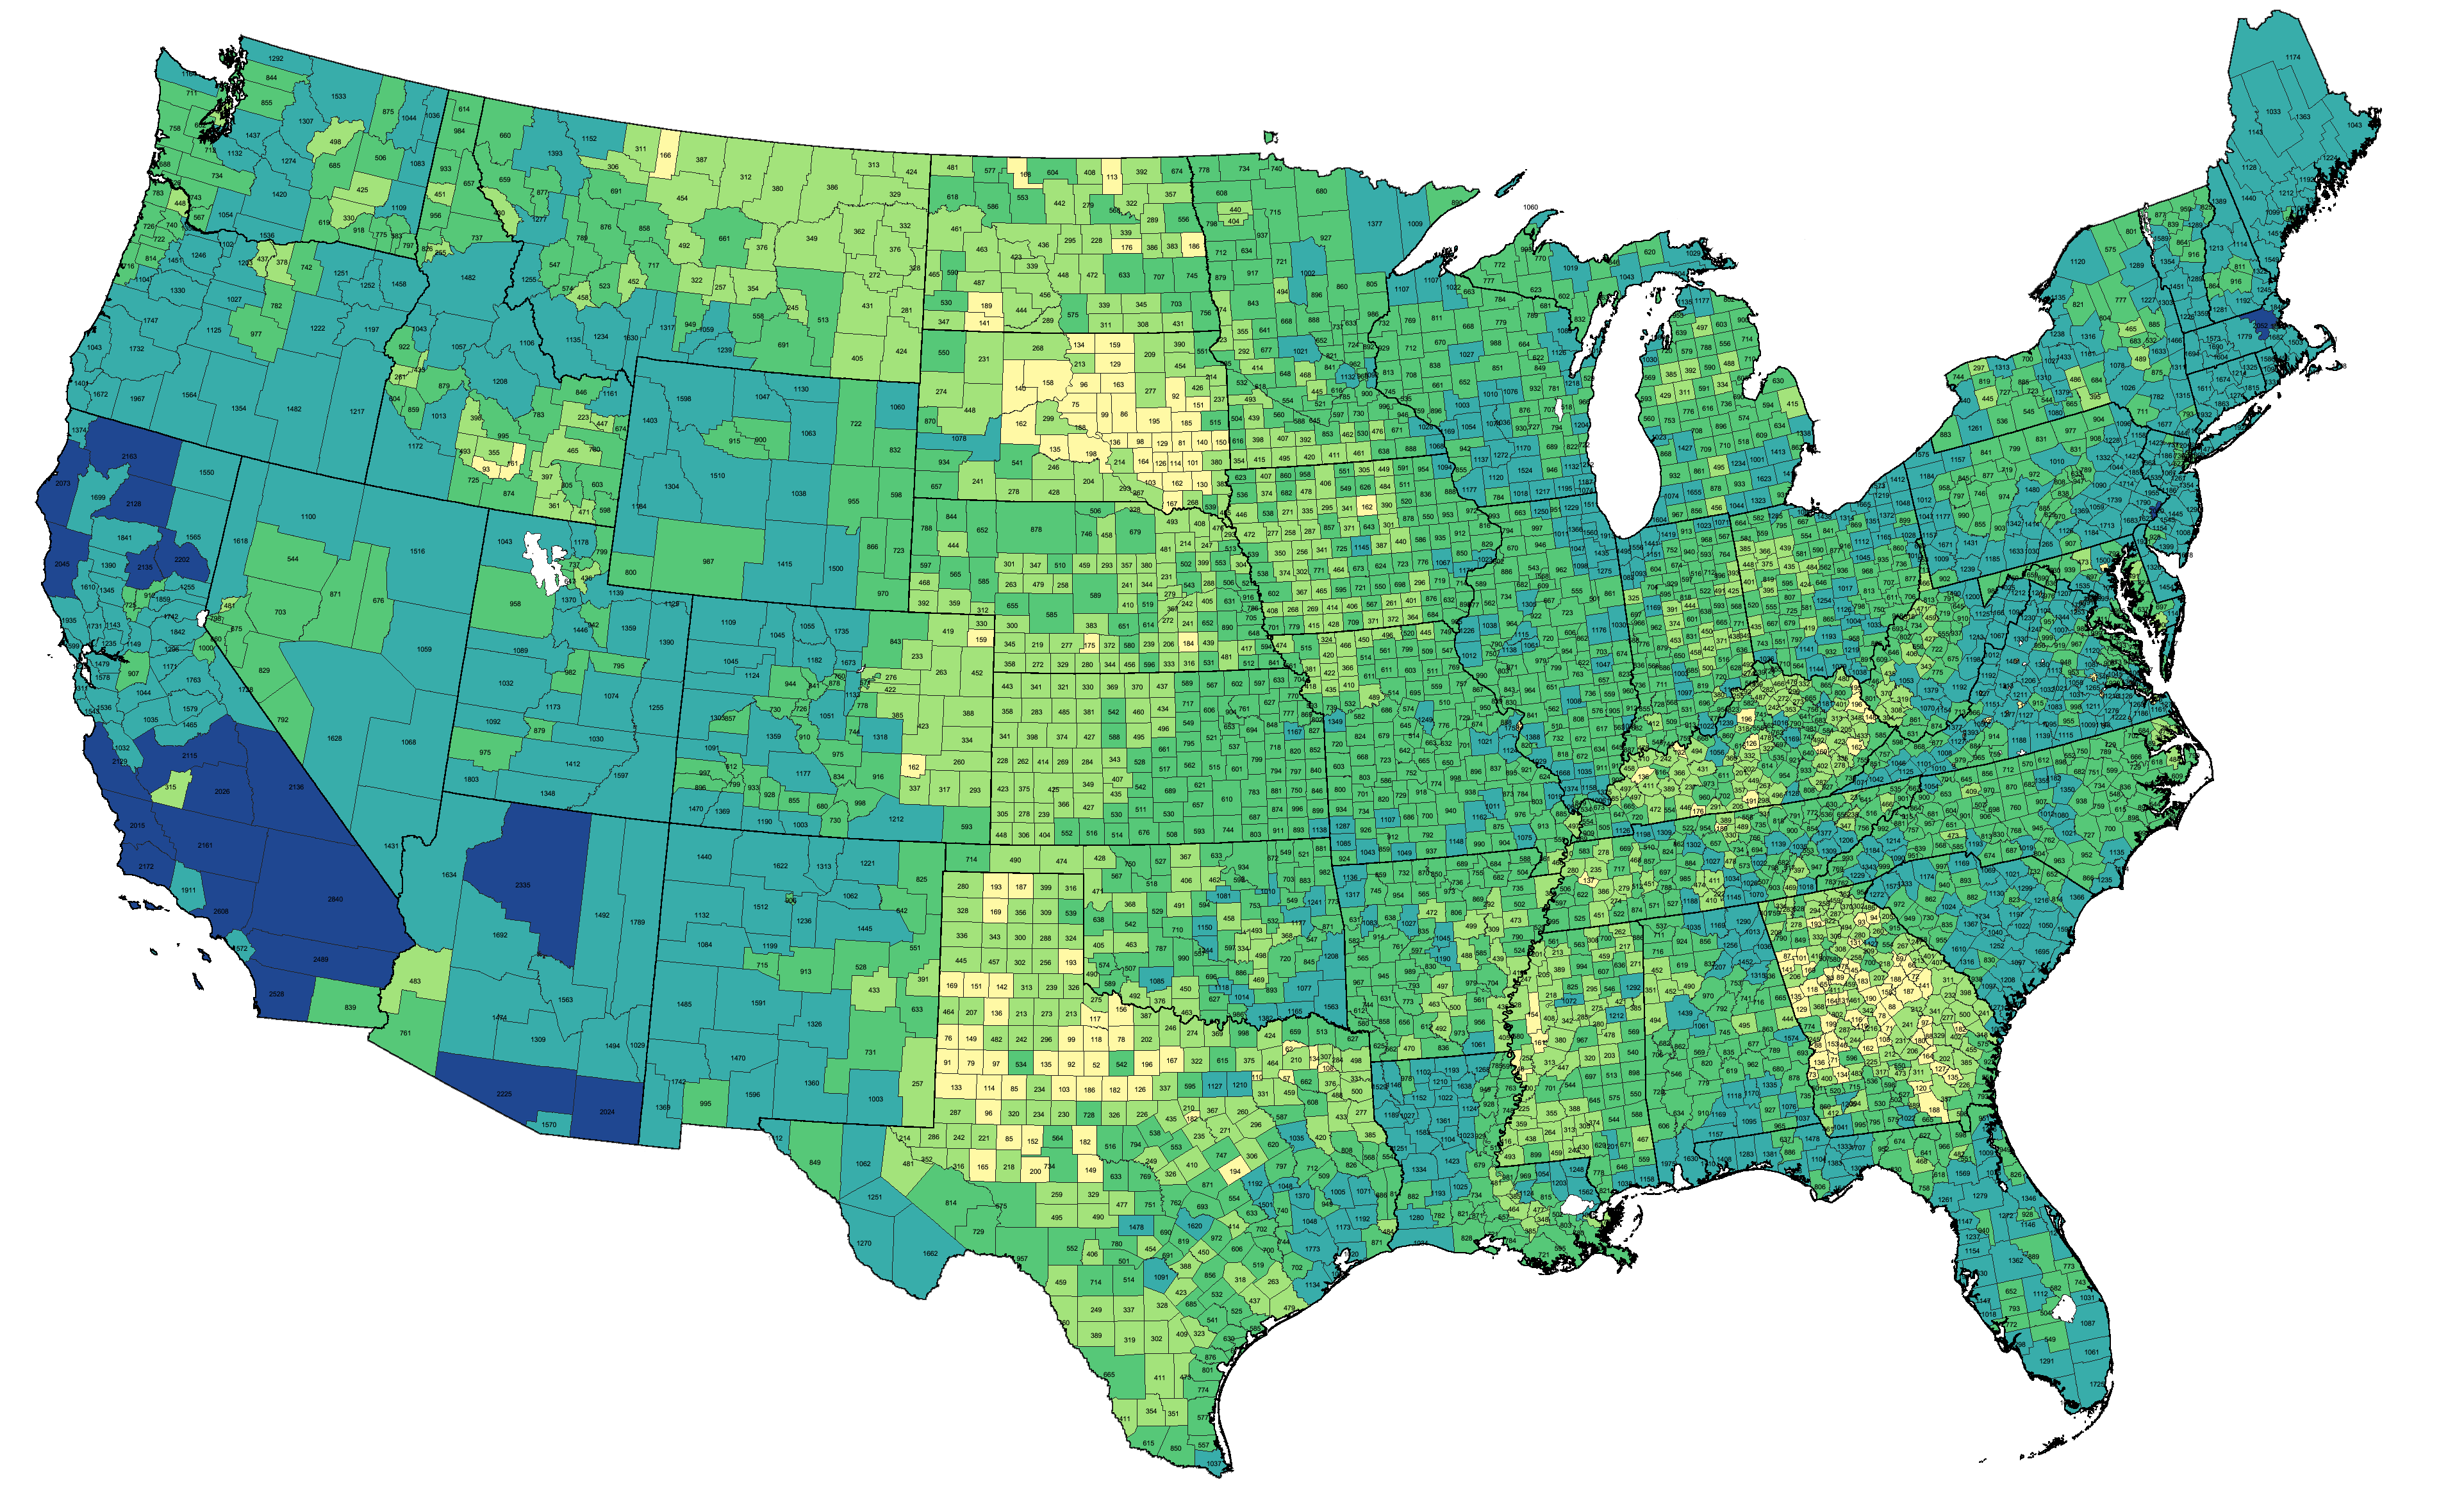
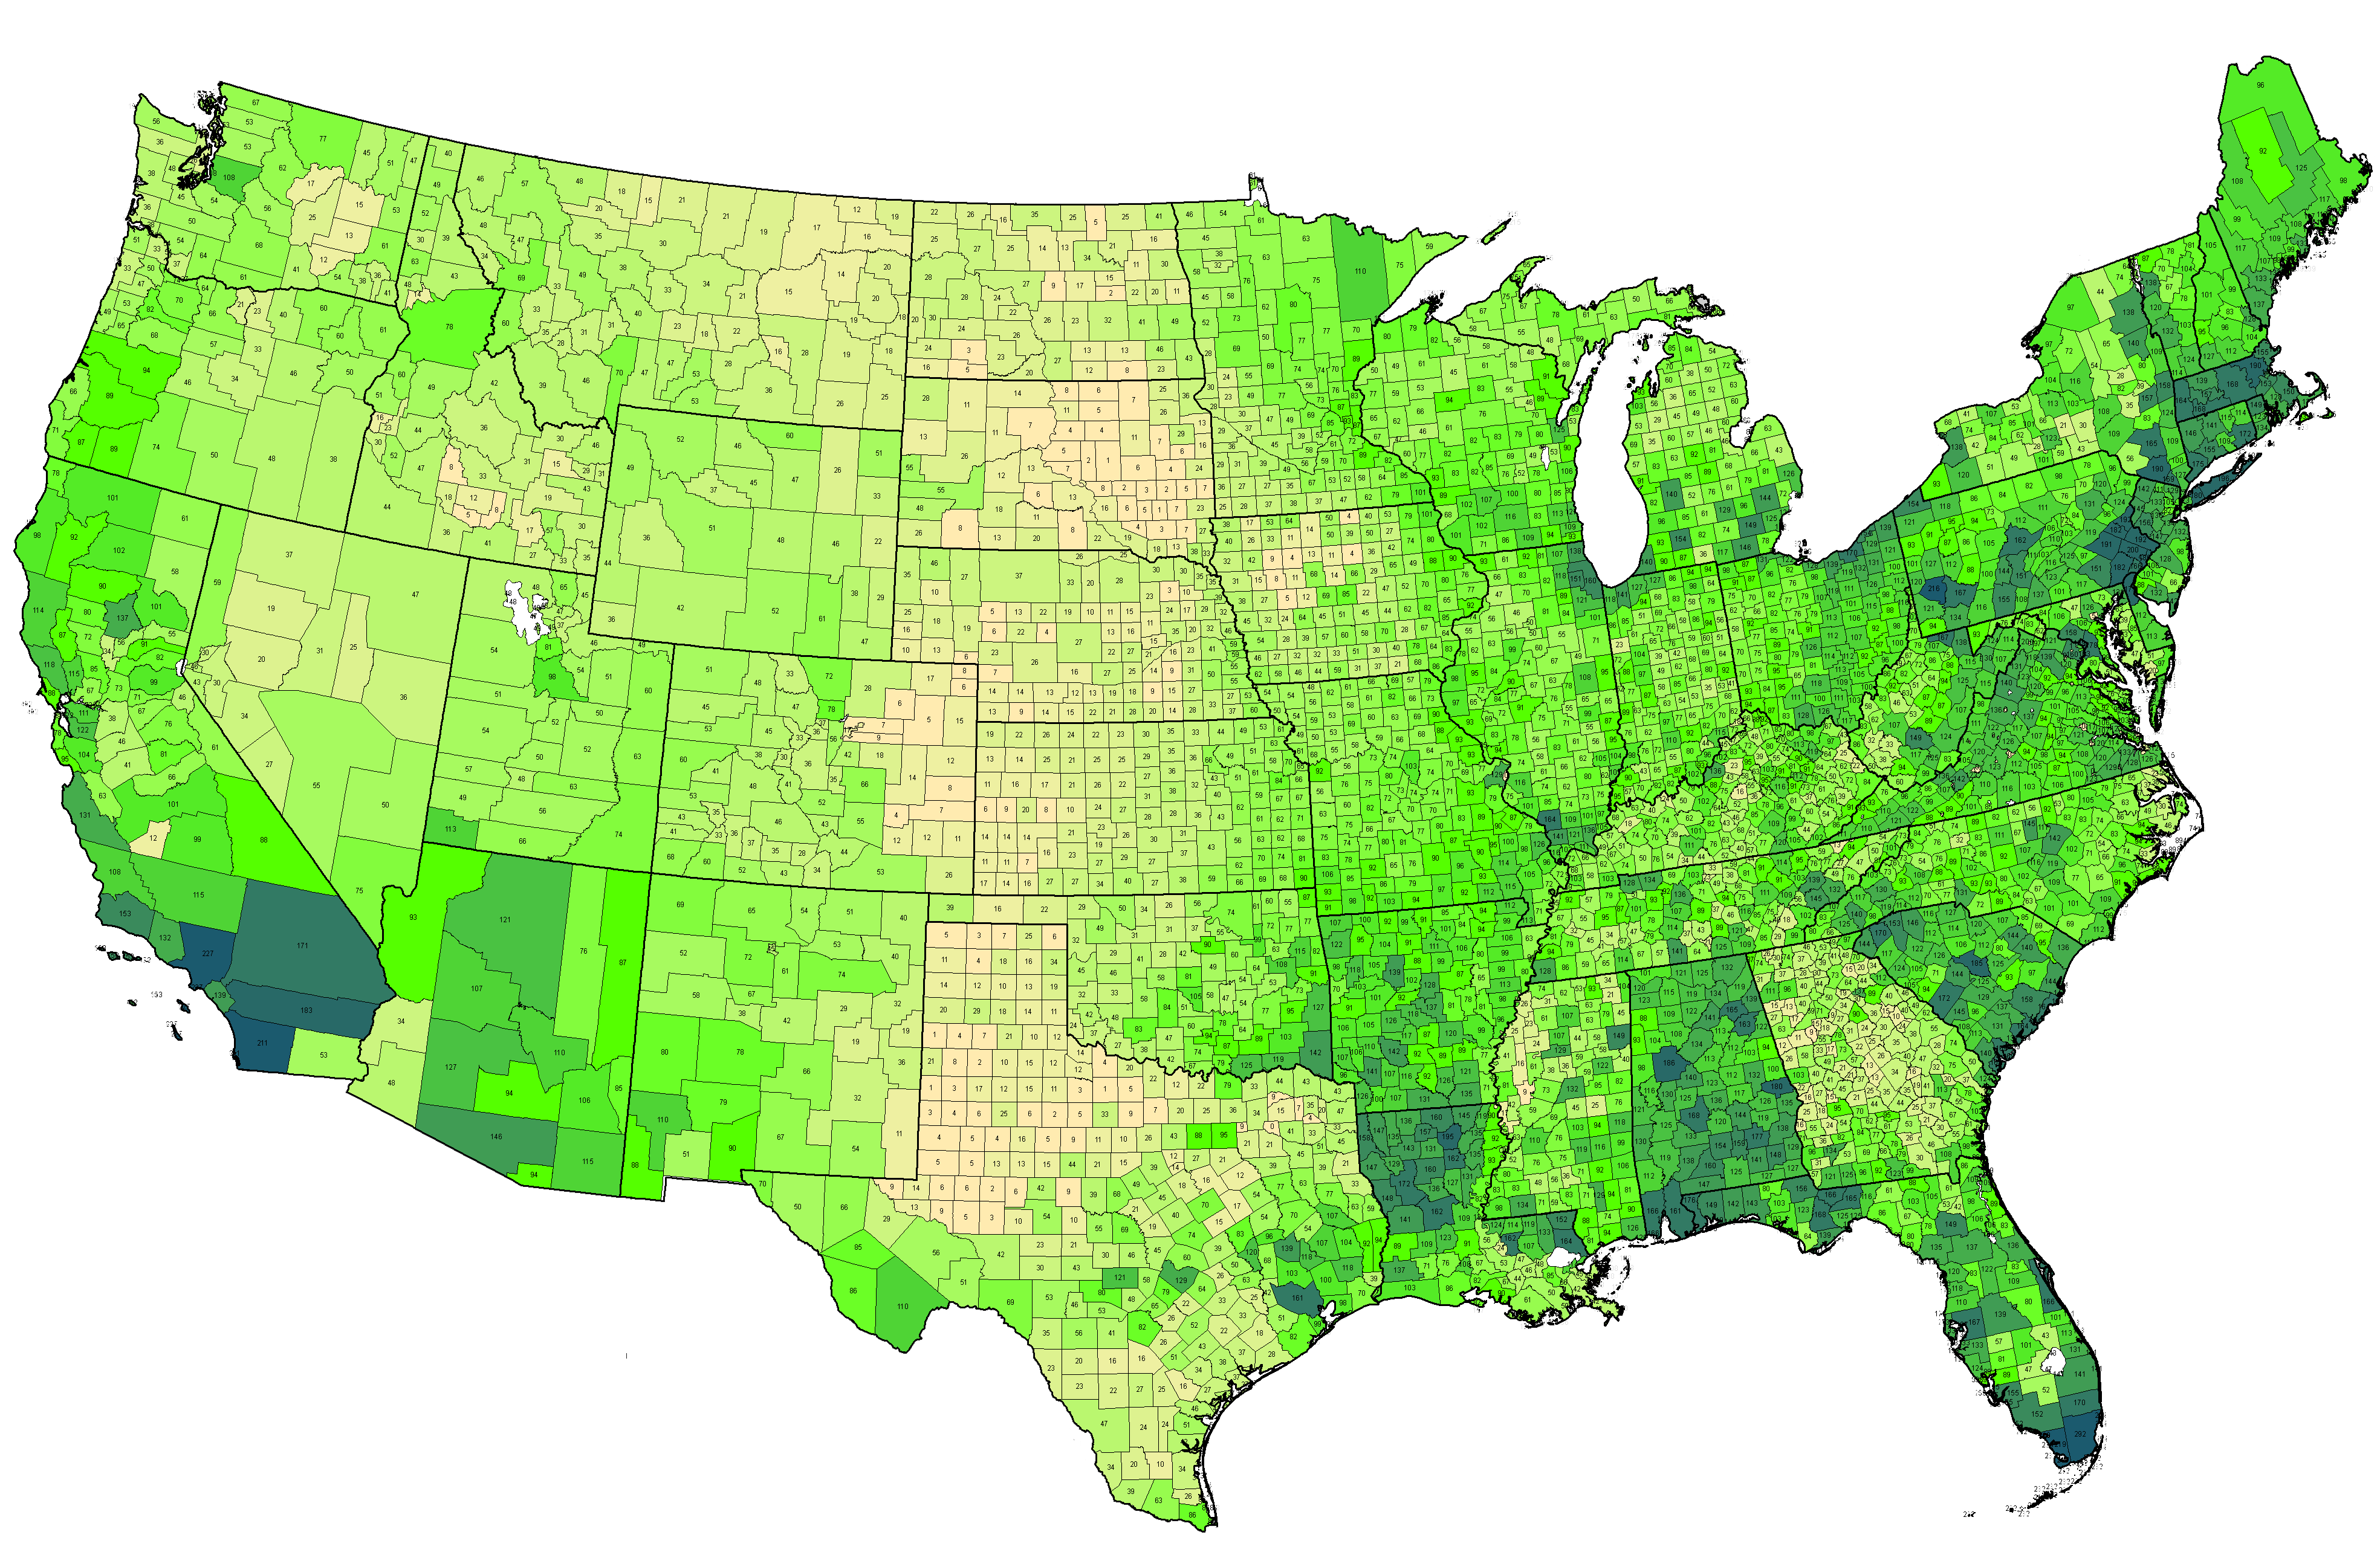
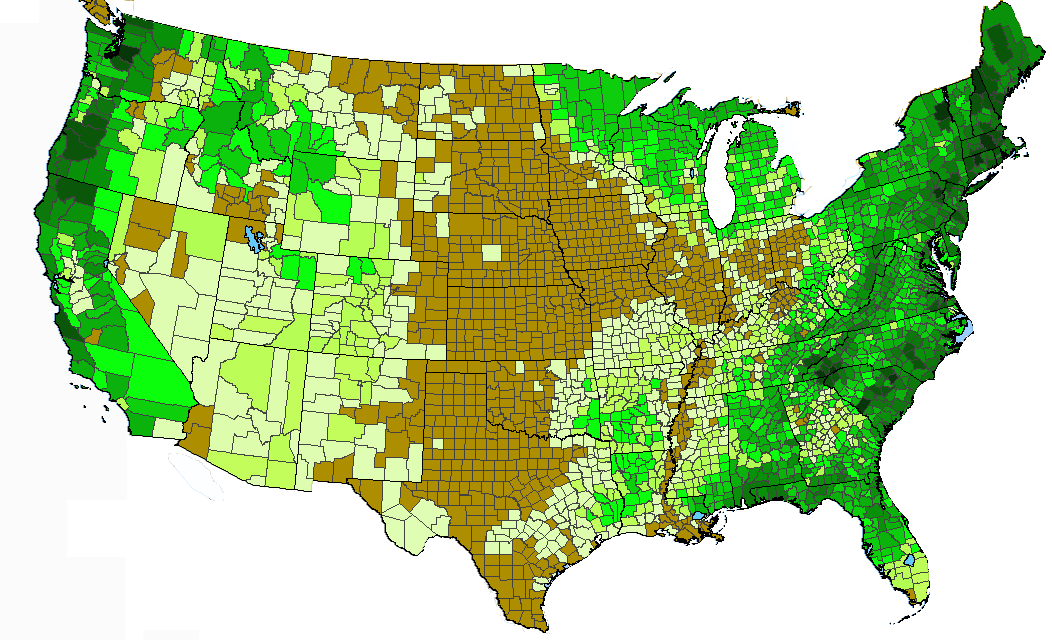
Actual number of native minus adventive species (true native) recorded from each county (data 2011). ©BONAP
|
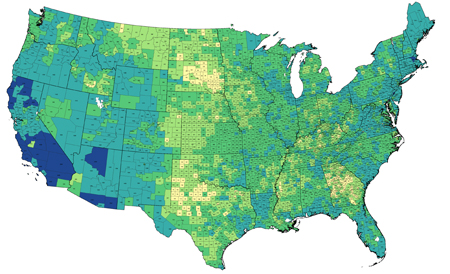
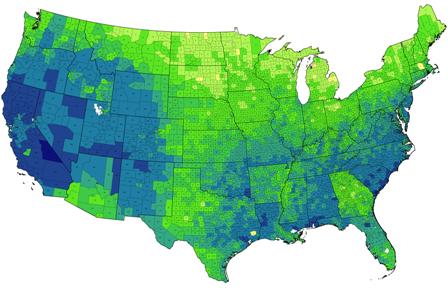
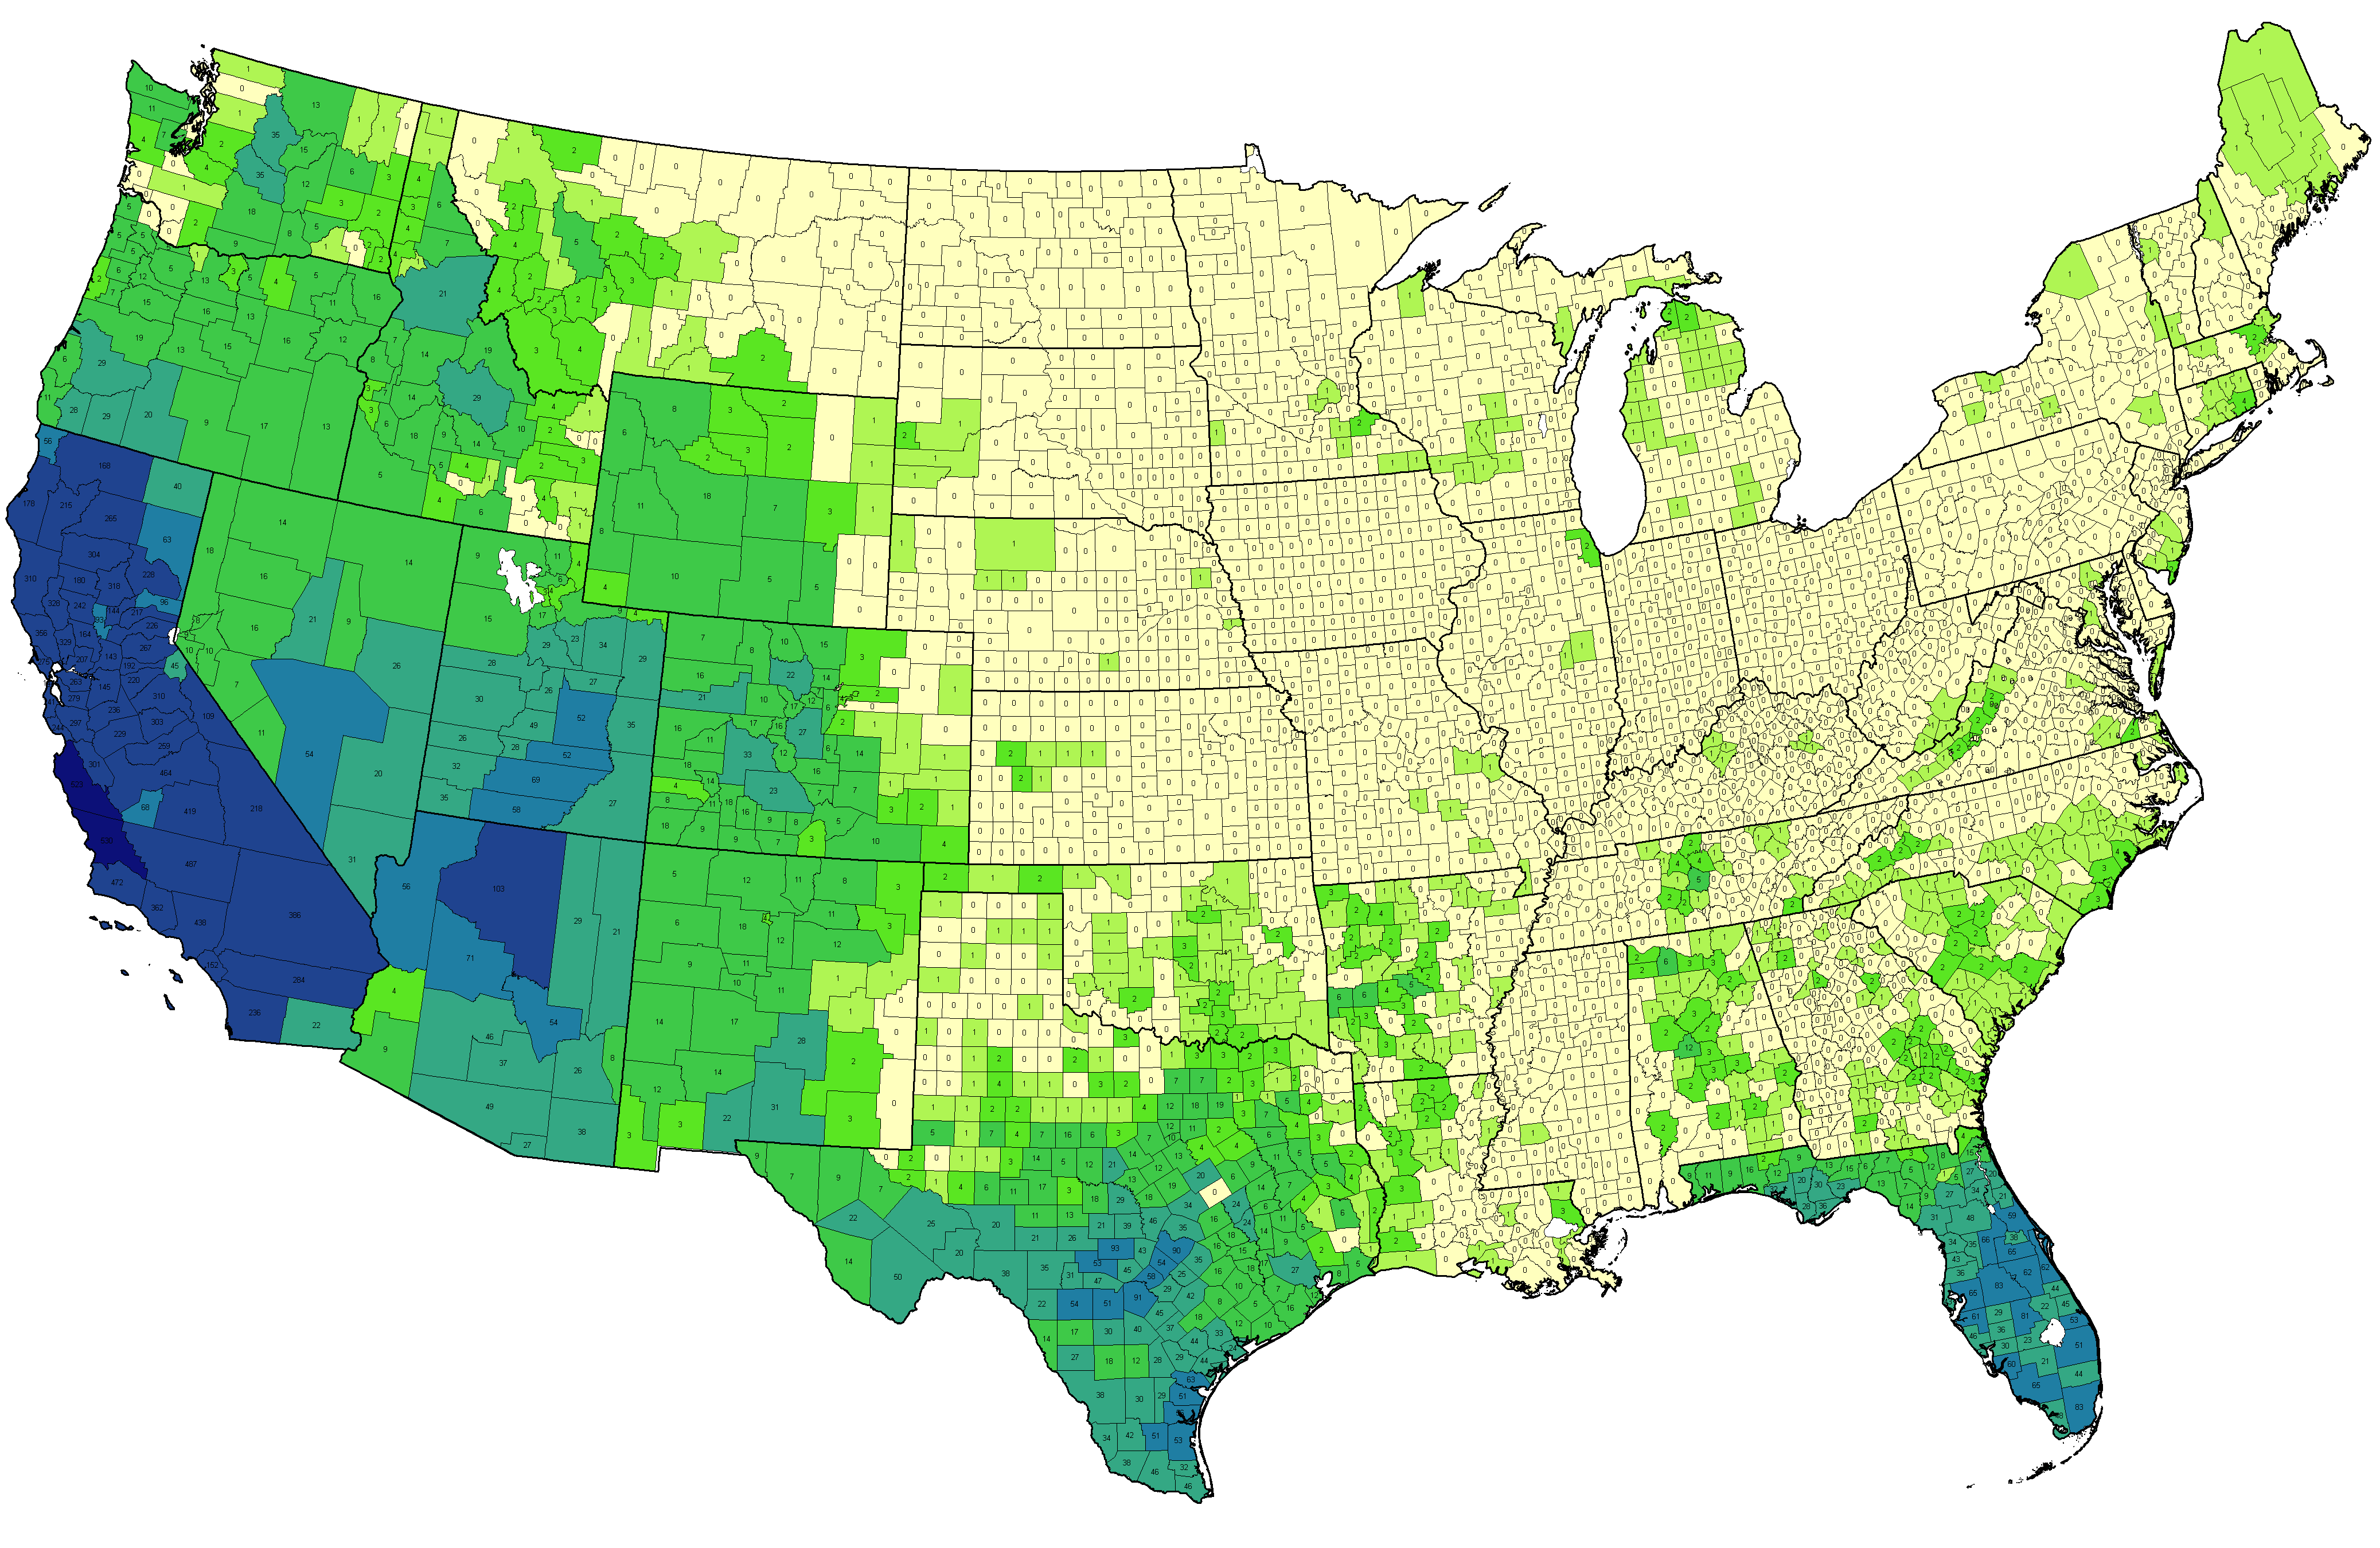
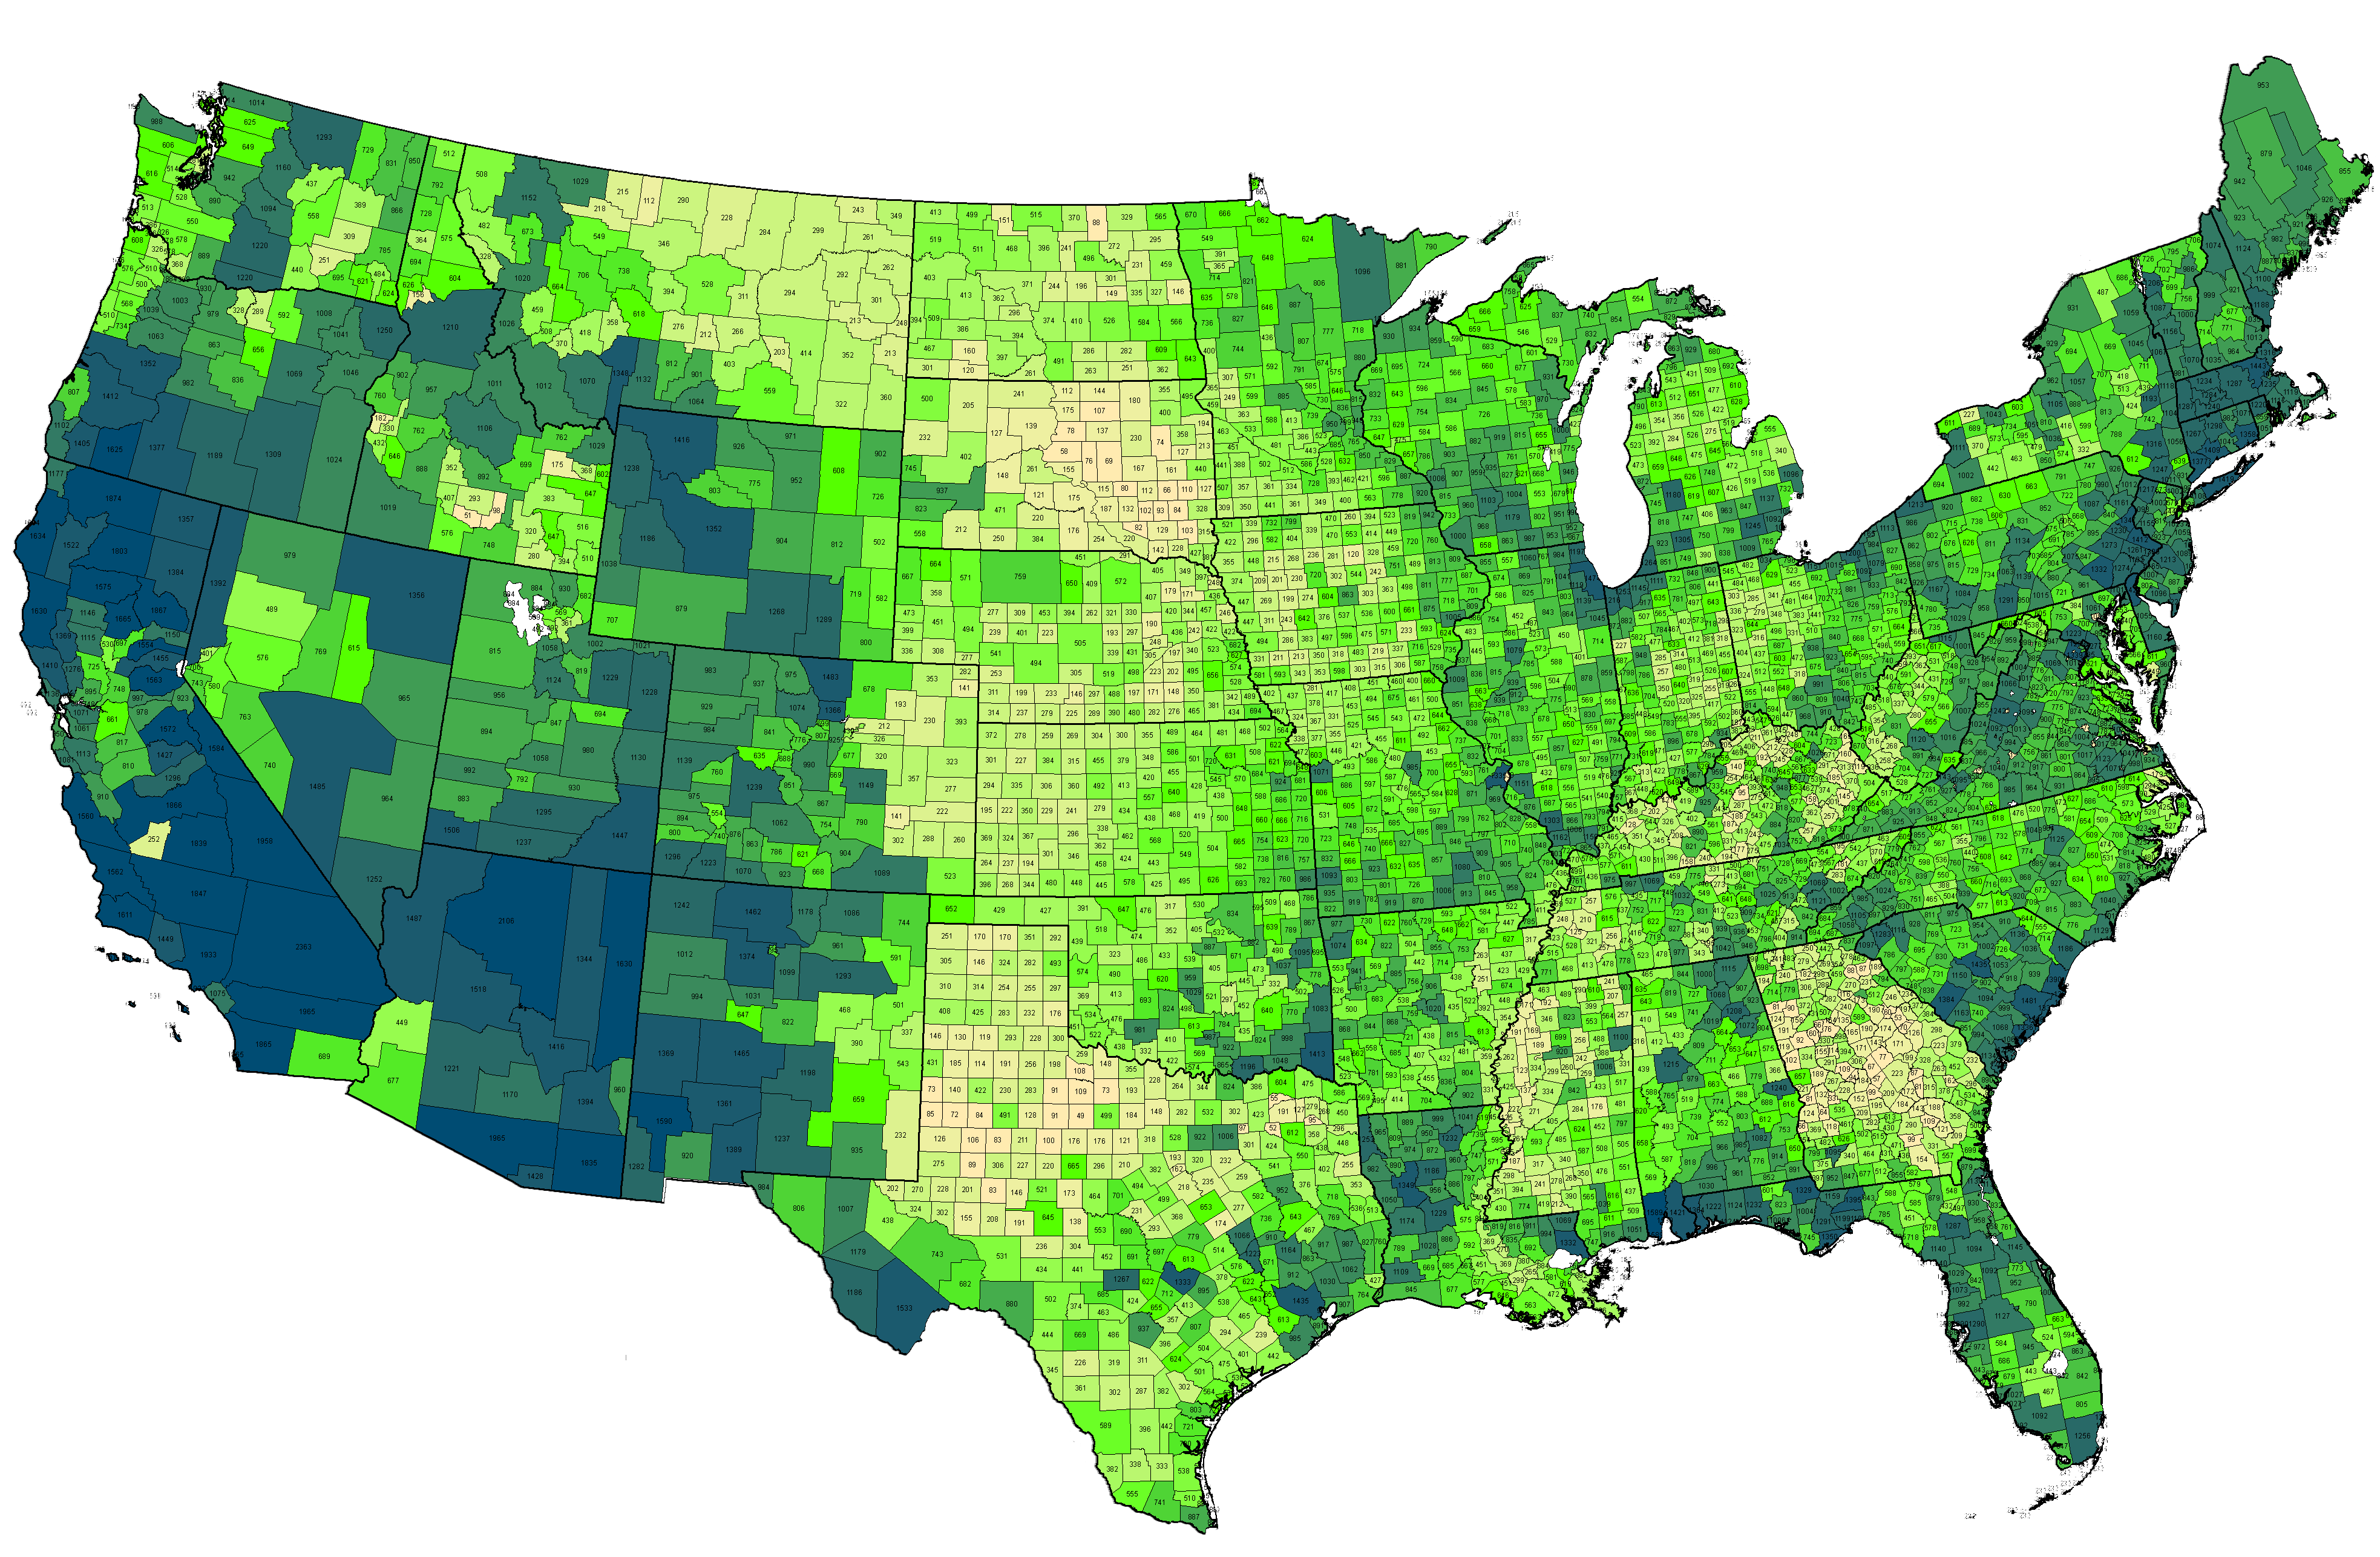
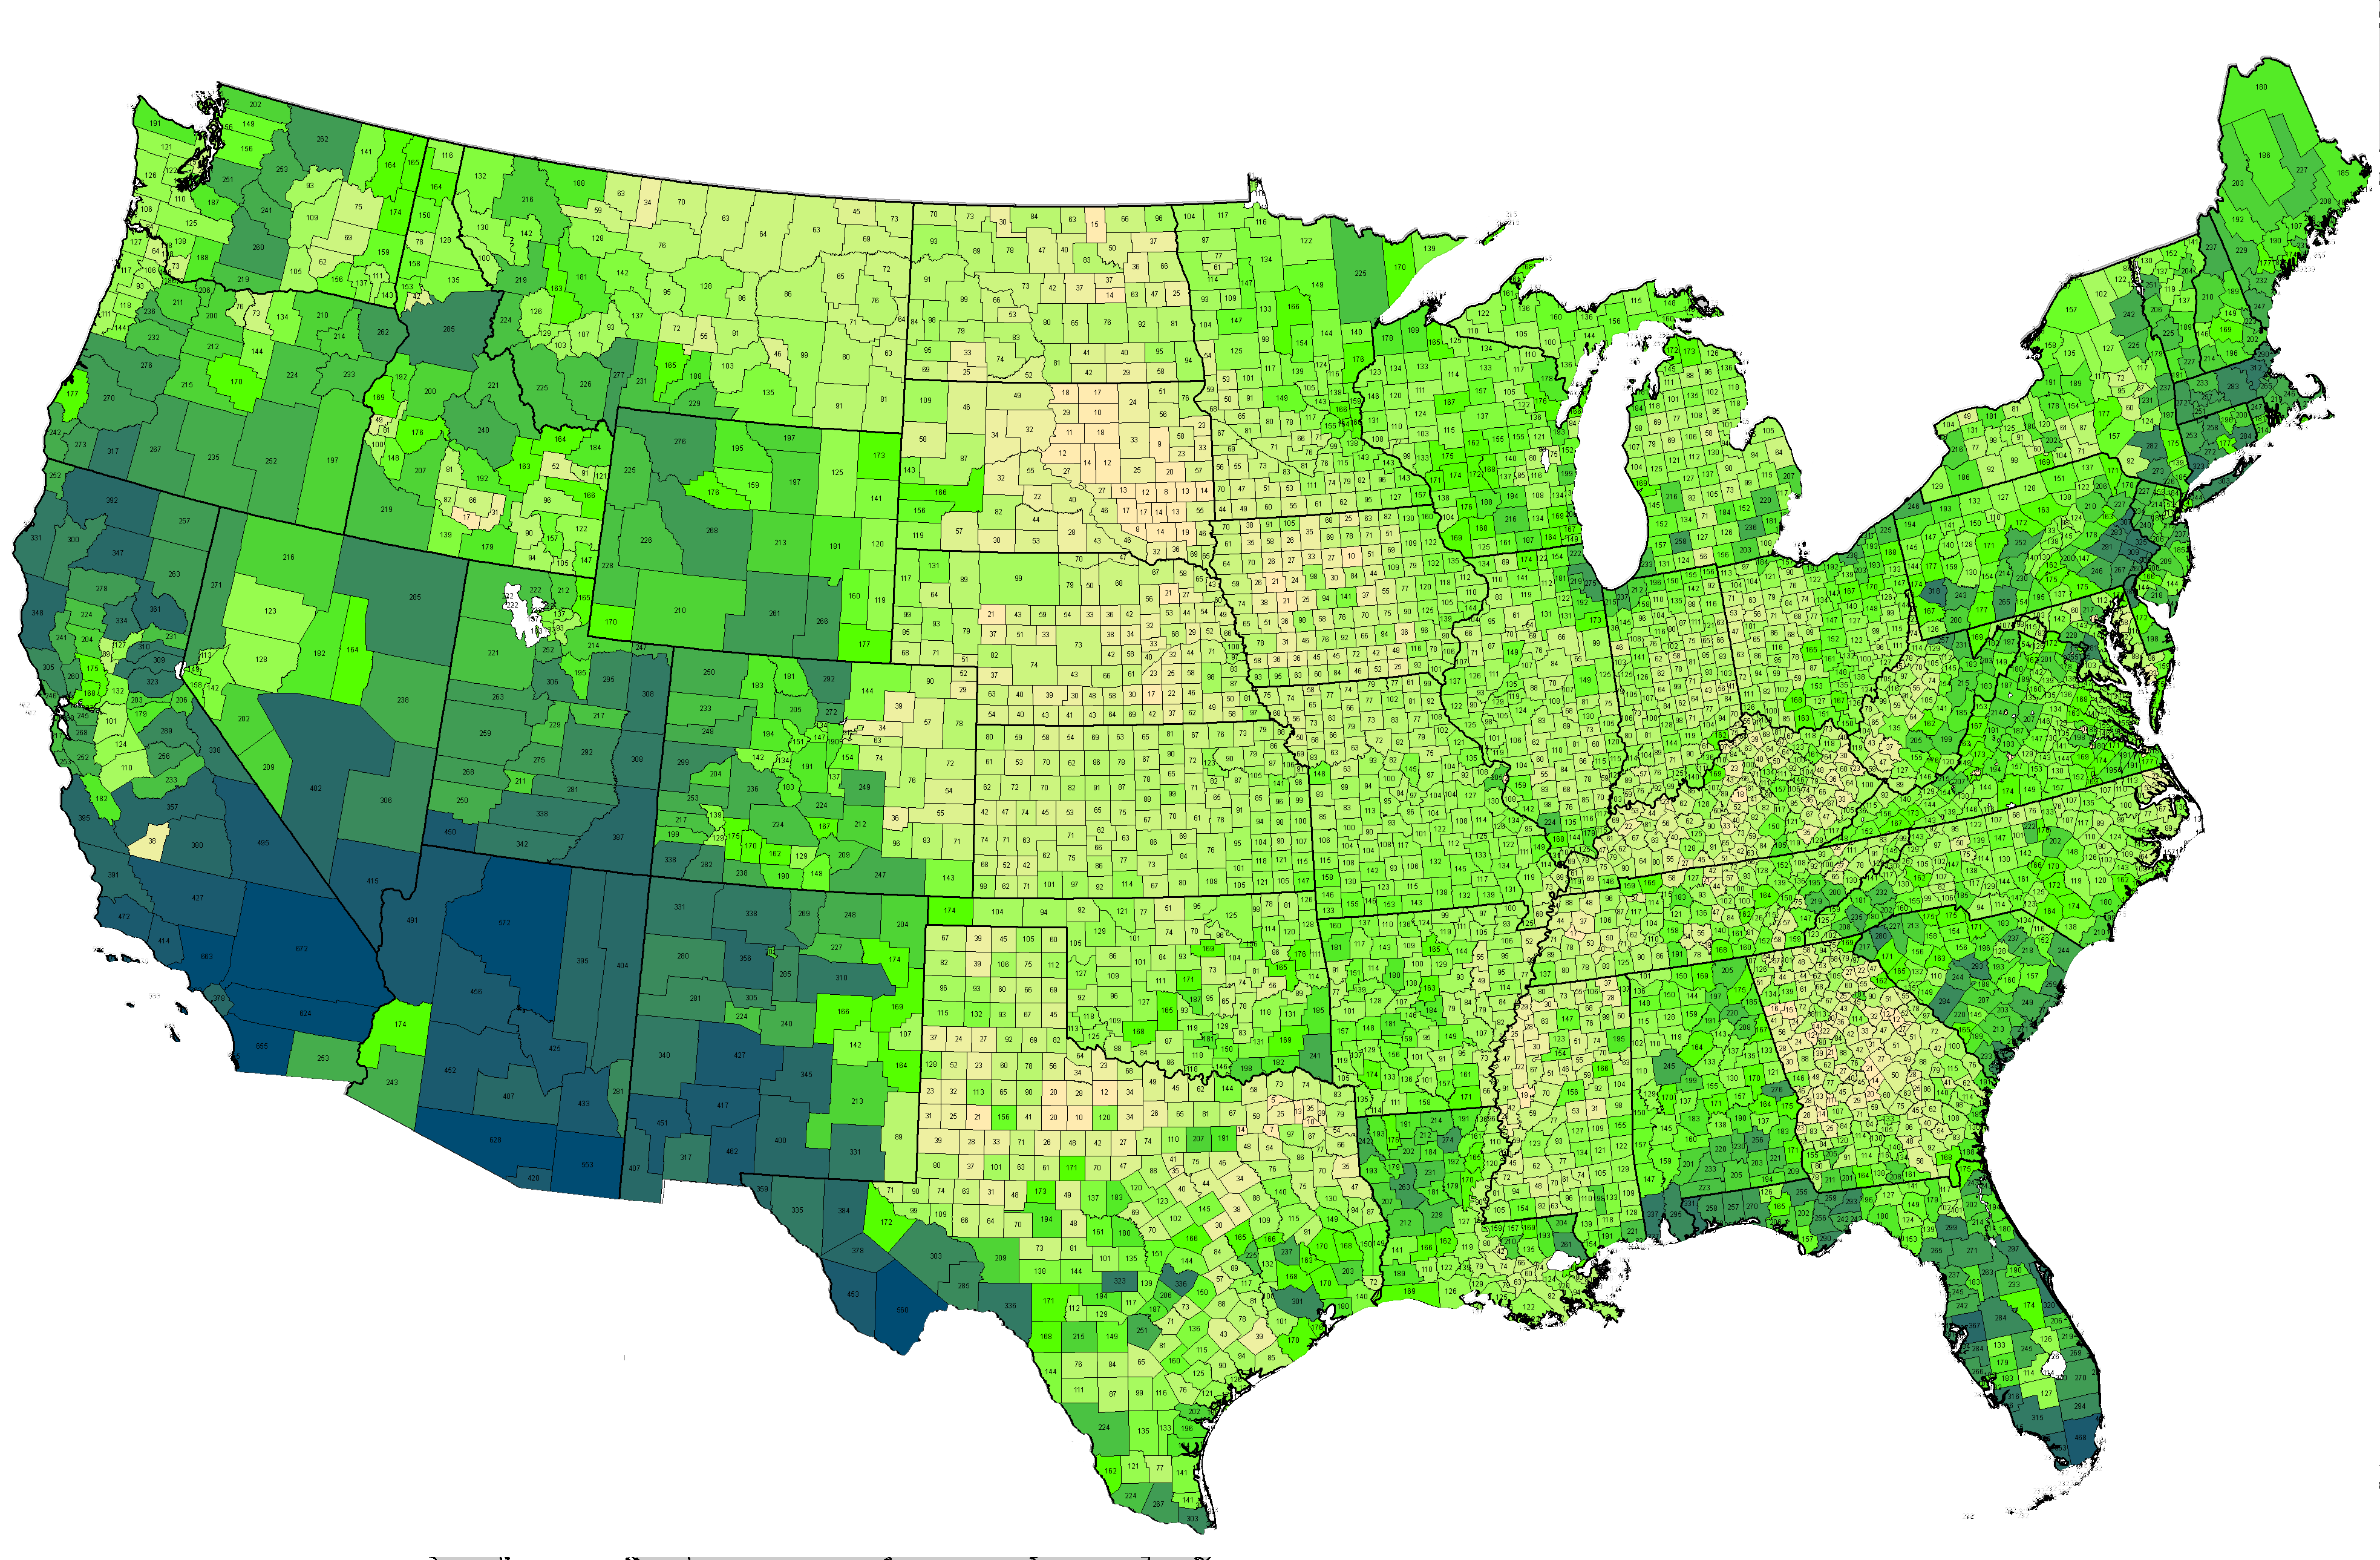
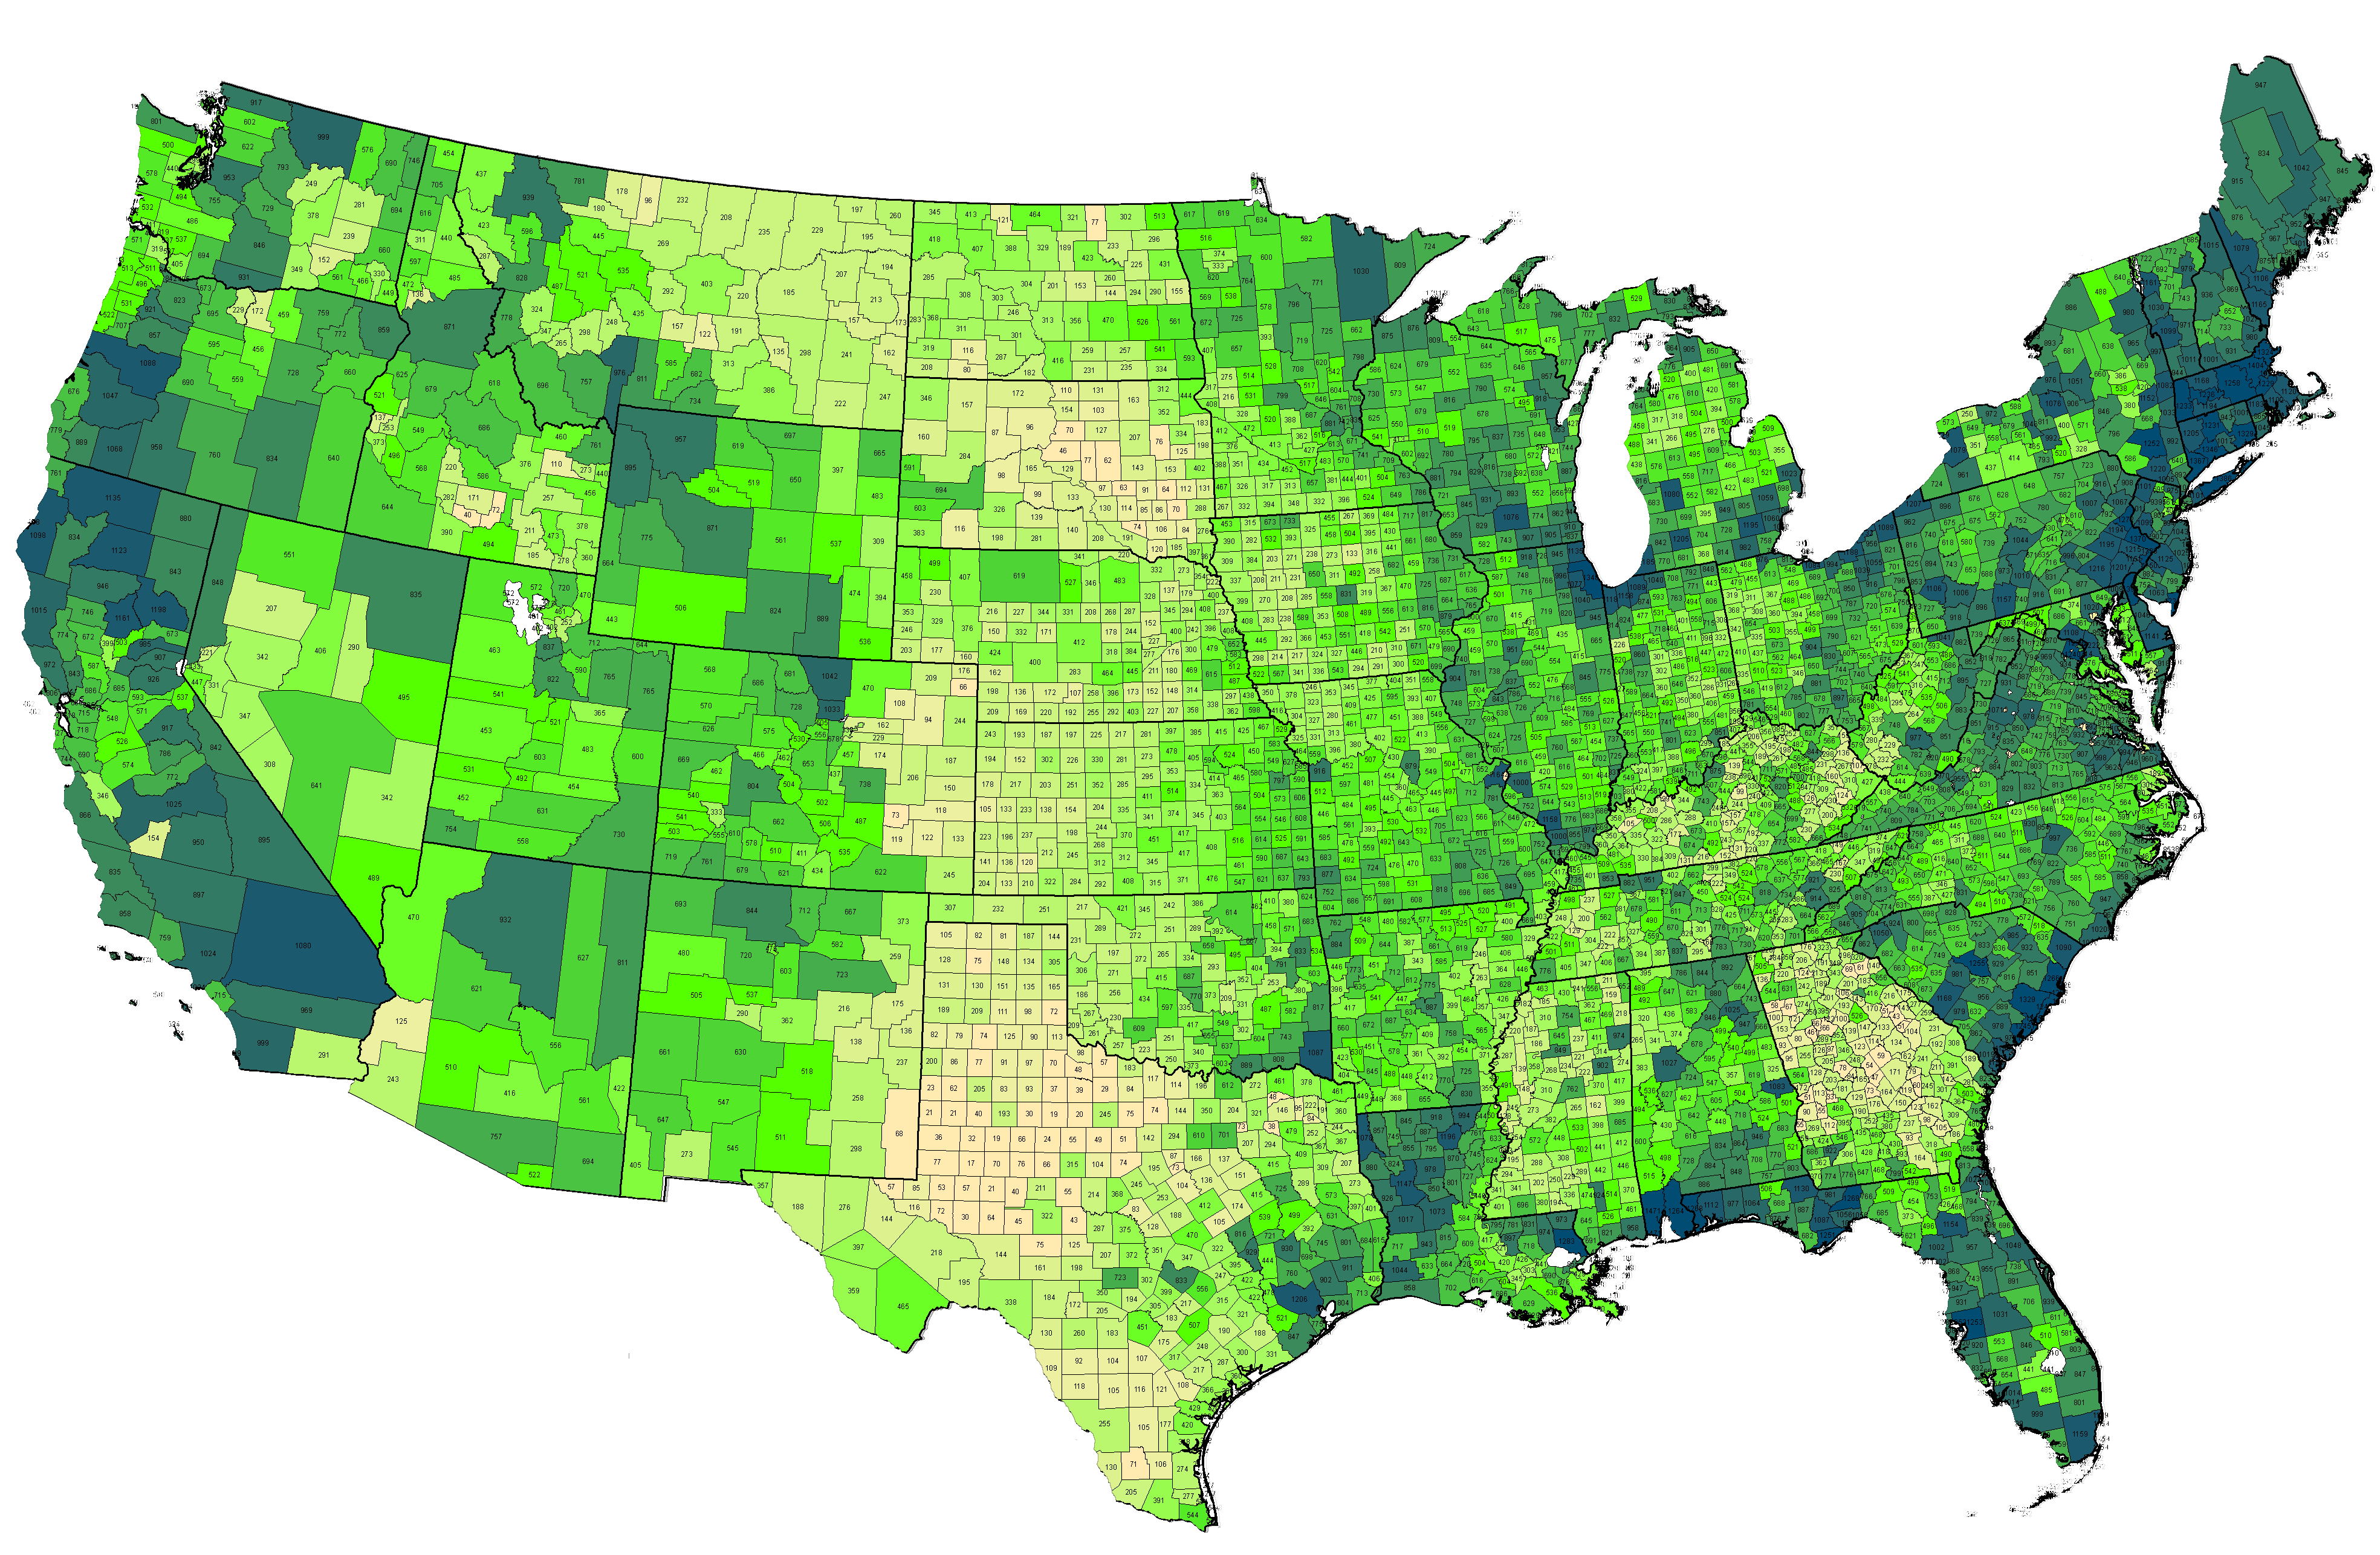
Actual total number of species (native plus adventive plus exotic) recorded from each county (data 2011-01). ©BONAP
| 
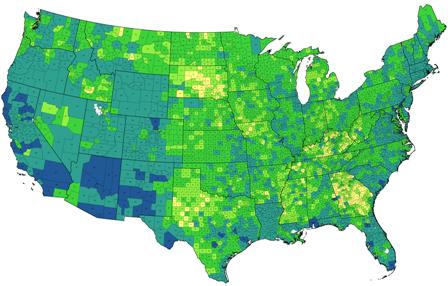
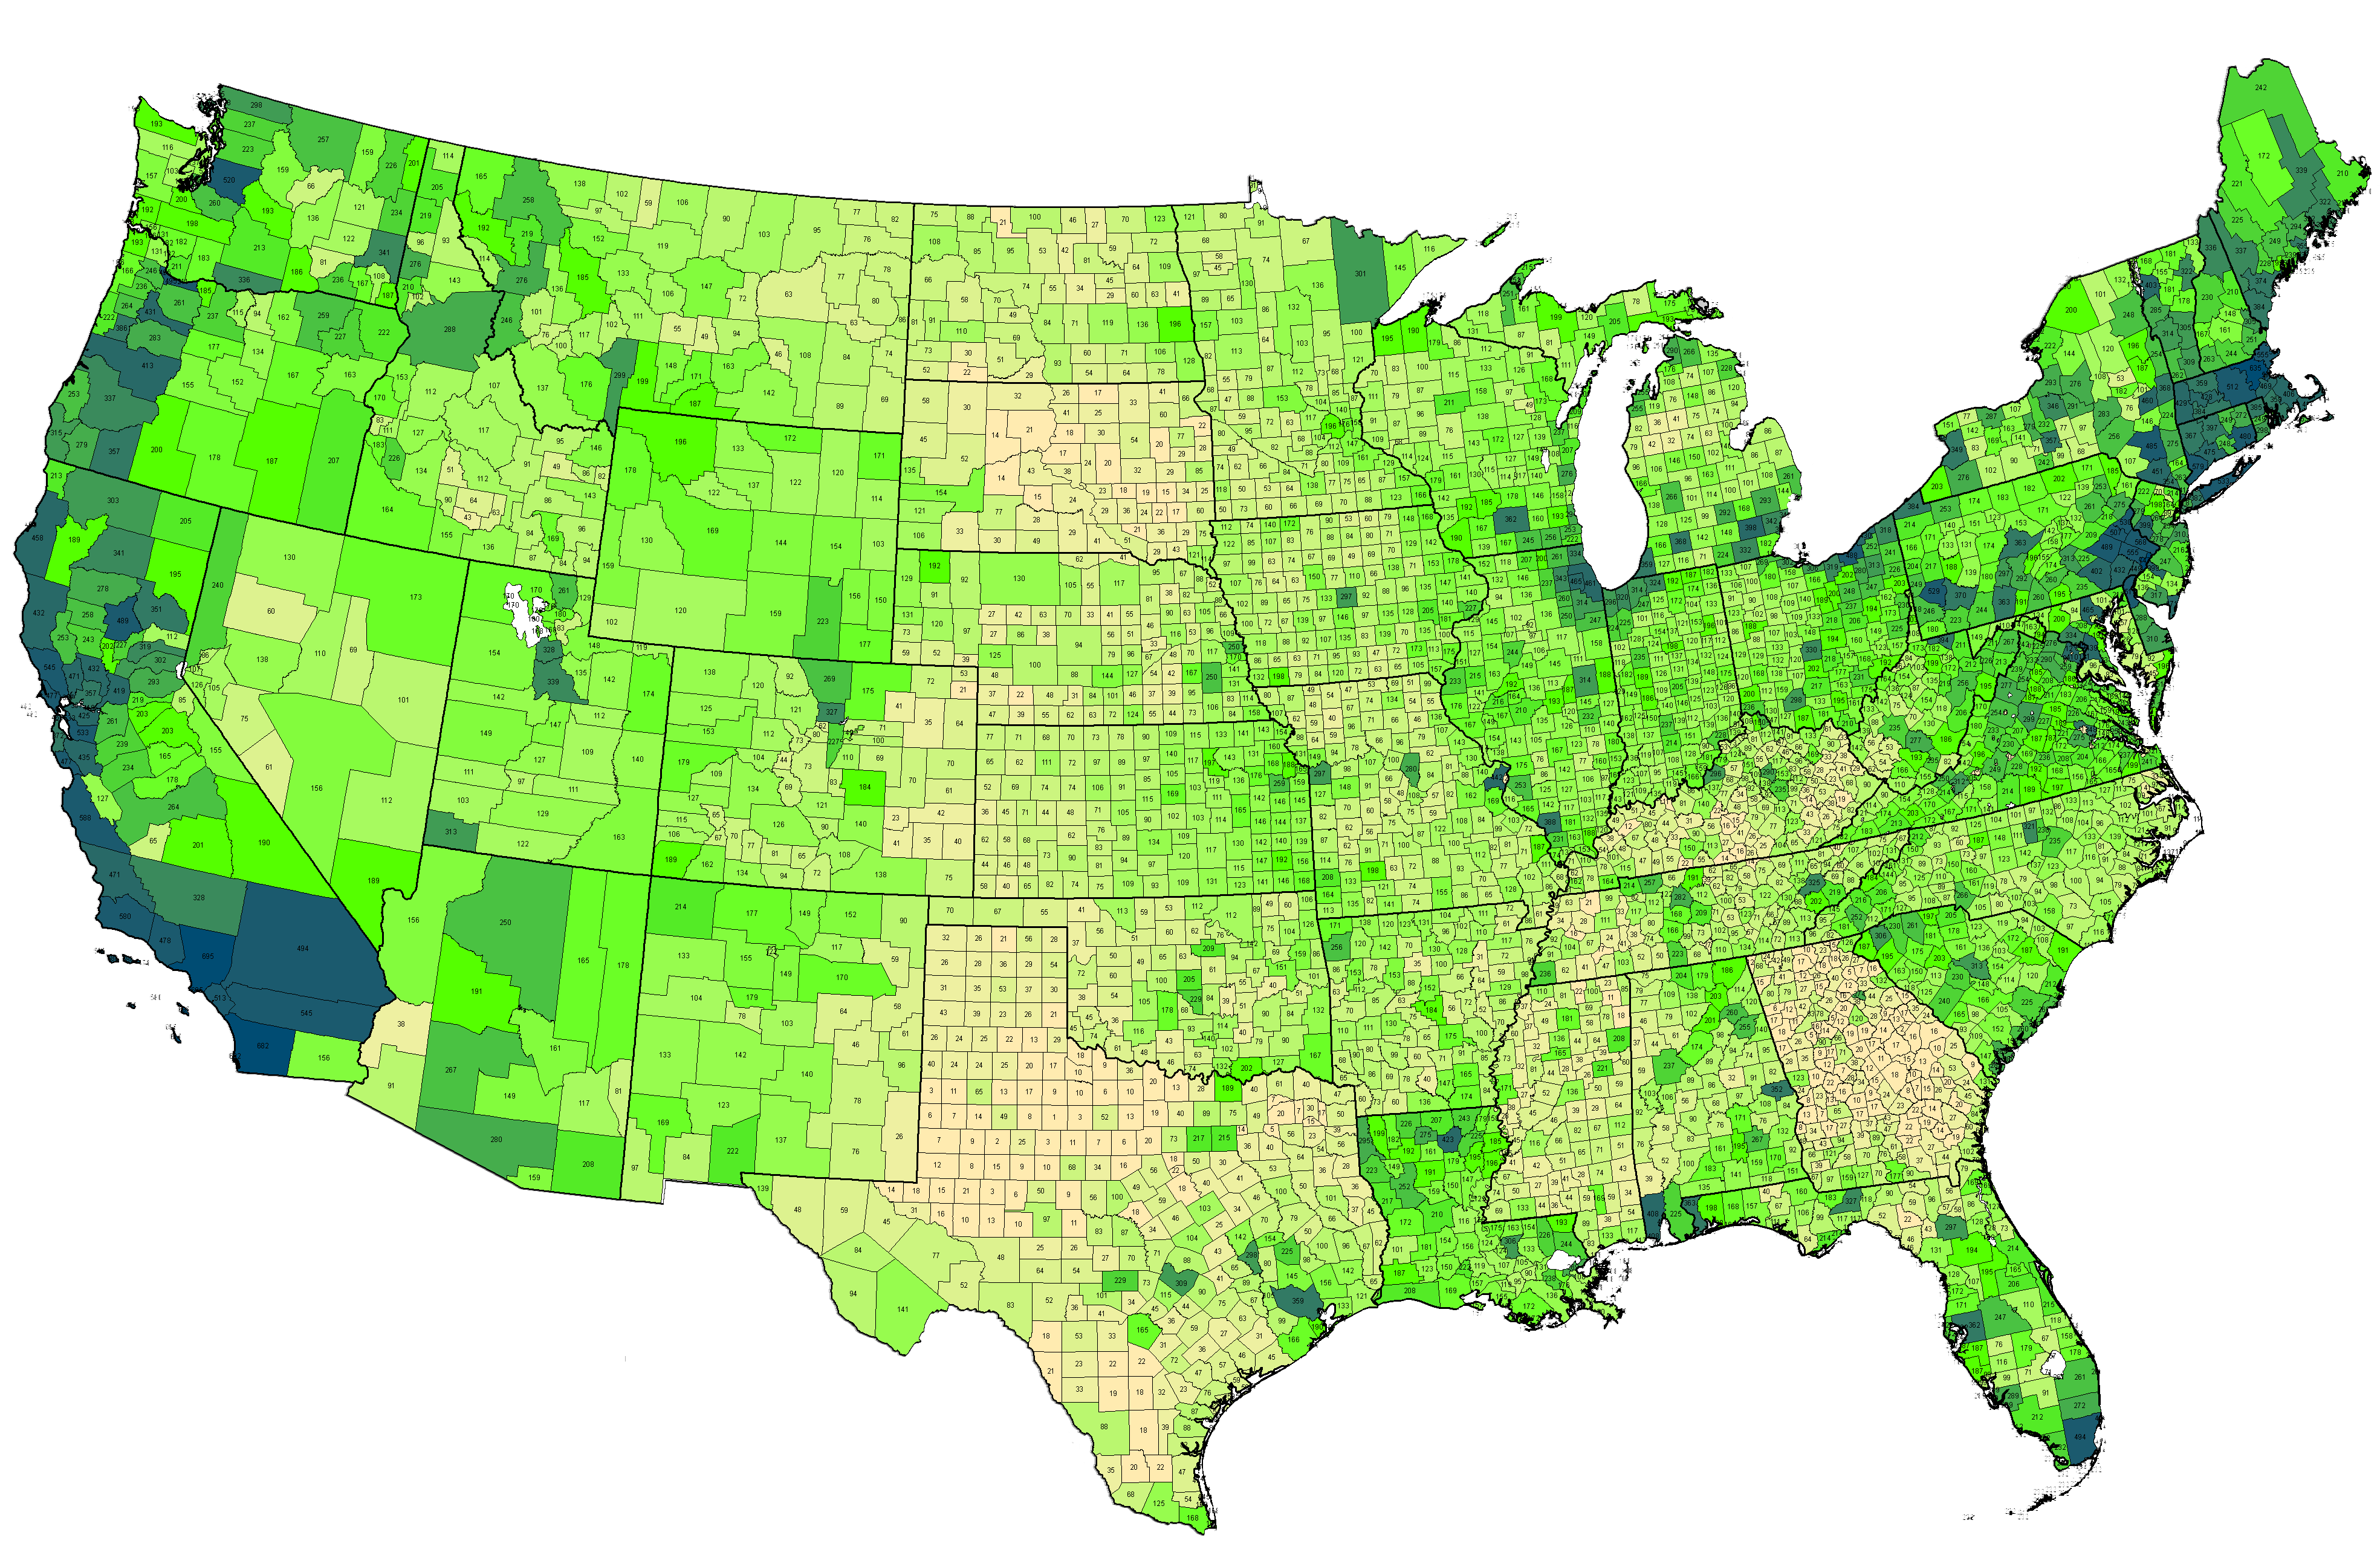
Actual number of exotic species recorded from each county (data 2011). ©BONAP | 
Actual number of named hybrids (native plus exotic) recorded from each county (data 2011). ©BONAP |
Actual number of true fern species recorded from each county (data 2011). ©BONAP | 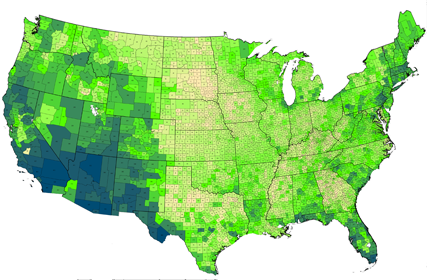
Actual number of shrub species recorded from each county (data 2011). ©BONAP | 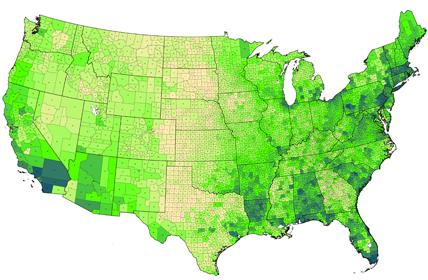
Actual number of tree species recorded from each county (data 2011). ©BONAP |

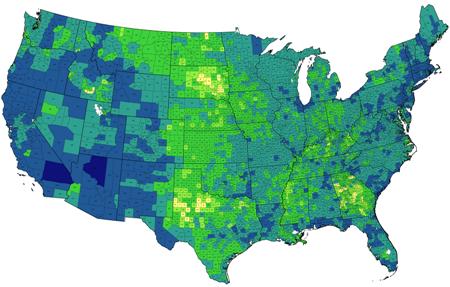
Contour map of native tree density per 10000 km2 (data 2007). ©BONAP | 
Concentration of native trees per 10000 km2 (data 2008). The actual numbers reflect internal calculation values and do not indicate species numbers. ©BONAP | 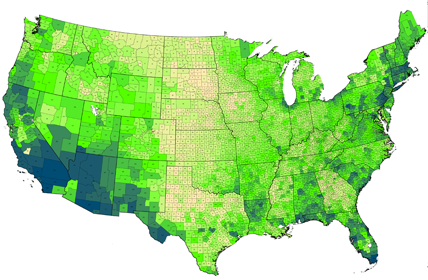
Actual number of woody species recorded from each county (data 2011). ©BONAP |

Contour map of native woody plant density per 10000 km2 (data 2007). ©BONAP | 
Concentration of native woody plants per 10000 km2 (data 2008). The actual numbers reflect internal calculation values and do not indicate species numbers. ©BONAP | 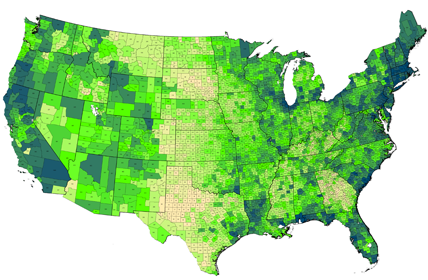
Actual number of wetland species recorded from each county (data 2011). ©BONAP |
Actual number of grass species recorded from each county (data 2011). ©BONAP | 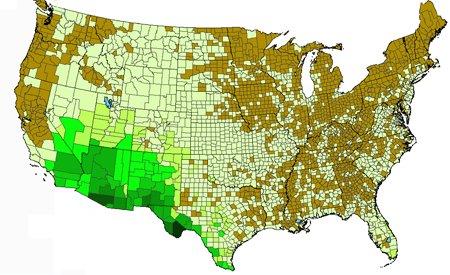
Density gradient of taxa for Cactaceae within the US (data 2011). Dark green indicates the highest species concentration.©BONAP | 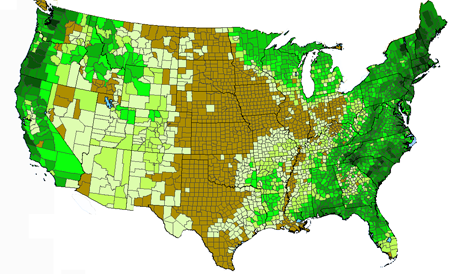
Density gradient of taxa for Ericaceae (traditional usage) within the US (data 2011). Dark green indicates the highest species concentration.©BONAP
|
Density gradient of taxa for Astragalus within the US (data 2011). Dark green indicates the highest species concentration. ©BONAP
| 
Density gradient of taxa for Lupinus within the US (data 2011). Dark green indicates the highest species concentration. ©BONAP | 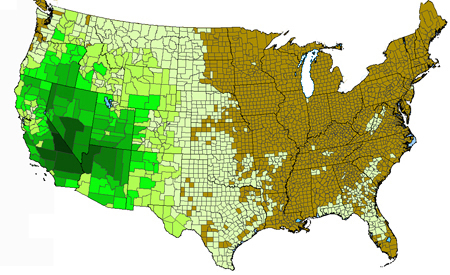
Density gradient of taxa for Eriogonum within the US (data 2011). Dark green indicates the highest species concentration. ©BONAP |
Density gradient of taxa for Penstemon within the US (data 2011). Dark green indicates the highest species concentration. ©BONAP | 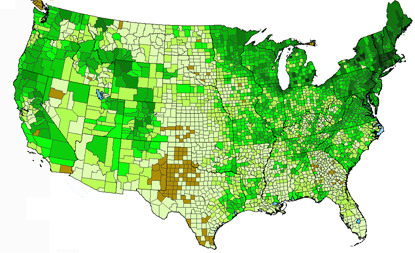
Density gradient of taxa for Carex within the US (data 2011). Dark green indicates the highest species concentration. ©BONAP |
|


