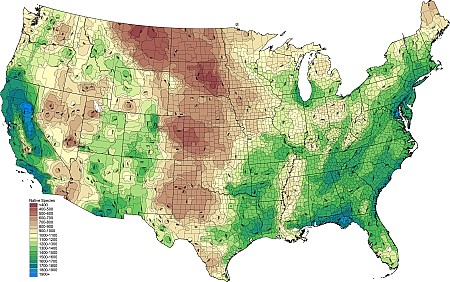
1) Density Gradient of Native Vascular Plant Species per 10,000 km². BONAP©2015 |
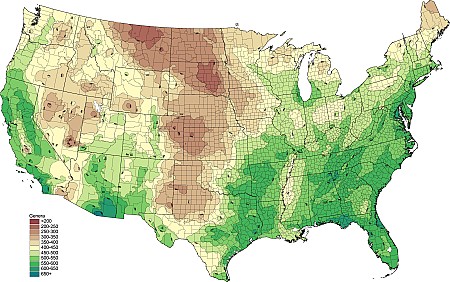
2) Density Gradient of Native Vascular Plant Genera per 10,000 km². BONAP©2015 |
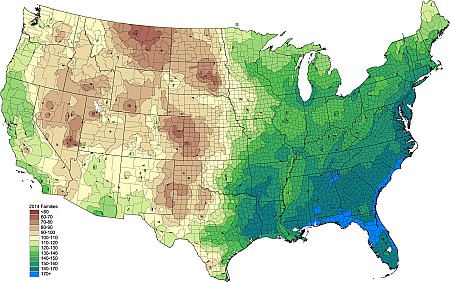
3) Density Gradient of Native Vascular Plant Families (APG optional family splits) per 10,000 km². BONAP©2015 |
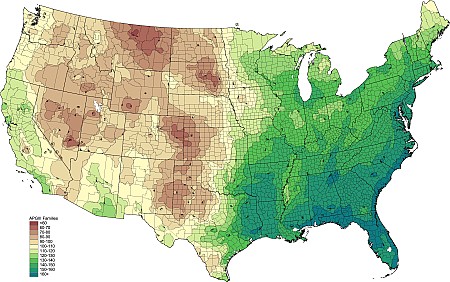
4) Density Gradient of Native Vascular Plant Families (sensu APG III) per 10,000 km². BONAP©2015 |
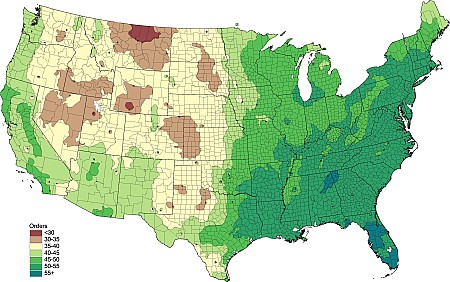
5) Density Gradient of Native Vascular Plant Orders per 10,000 km². BONAP©2015 |
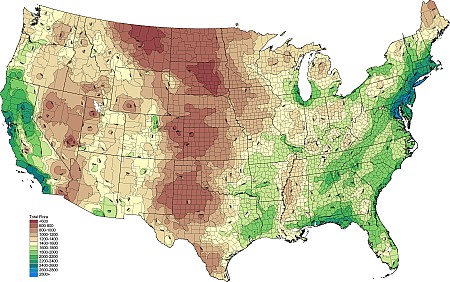
6) Density Gradient of (Native plus Exotic plus Adventive) Vascular Plant Species per 10,000 km². BONAP©2015 |
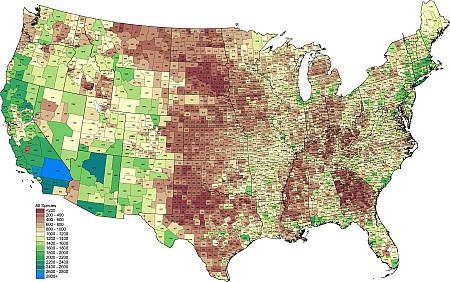
7) Number of Documented Vascular Plant Species (Native, Adventive, plus Exotic) by County. BONAP©2015 NEW |
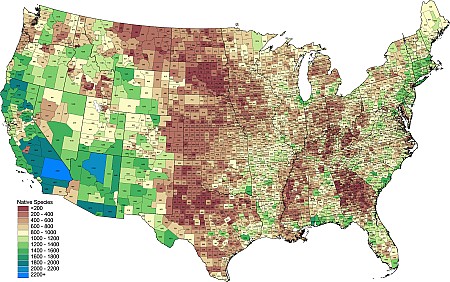
8) Number of Documented Native plus Adventive Vascular Plant Species by County. BONAP©2015. BONAP©2015 NEW |
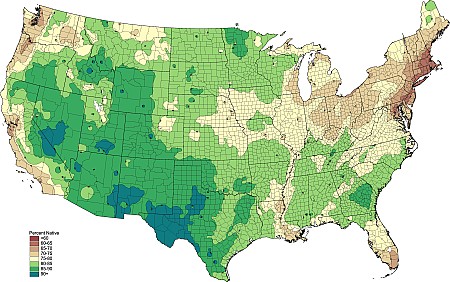
9) Percentage of Vascular Plant Species that are Native. BONAP©2015 |
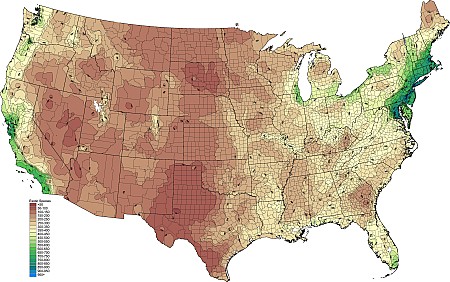
10) Density Gradient of Exotic Vascular Plant Species per 10,000 km². BONAP©2015 |
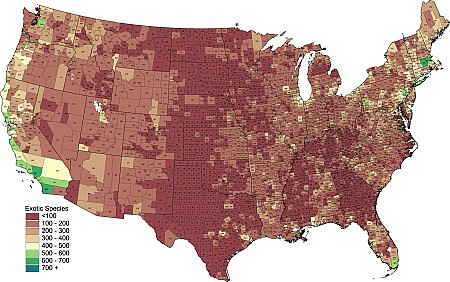
11) Number of Documented Exotic Vascular Plant Species by County. BONAP©2015 NEW |
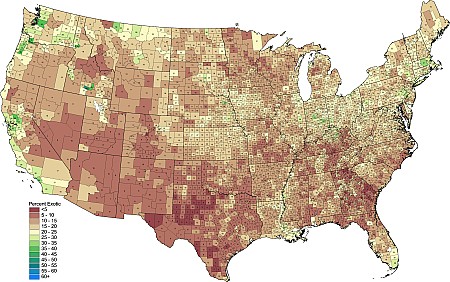
12) Percent of County Floras Comprising Exotic Vascular Plant Species. BONAP©2015 NEW |
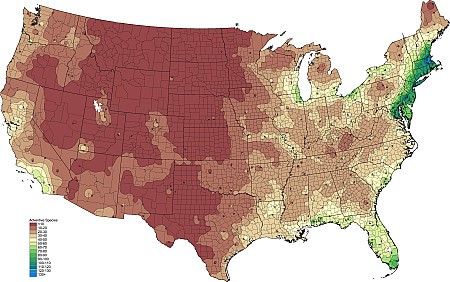
13) Density Gradient of Adventive Vascular Plant Species per 10,000 km². BONAP©2015 |
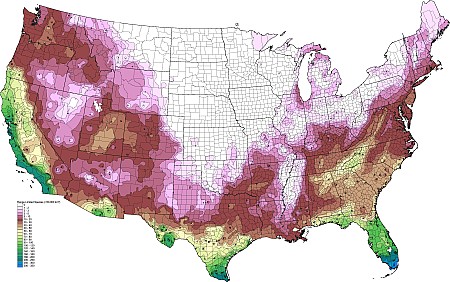
14) Density Gradient of "Endemic" (Range Limited <50,000 km²) Plant Species per 10,000 km². BONAP©2015 |
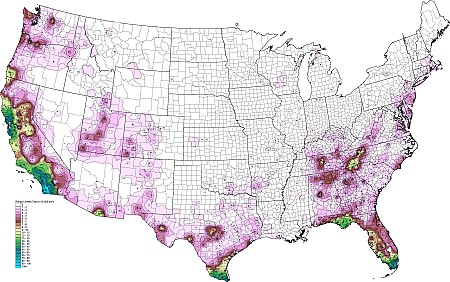
15) Density Gradient of "Endemic" (Range Limited <15,000 km²) Plant Taxa per 2,500 km². BONAP©2015 |
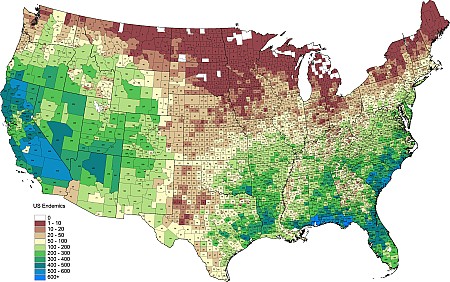
16) Number of Documented United States Endemic Vascular Plant Species by County. BONAP©2015 NEW |
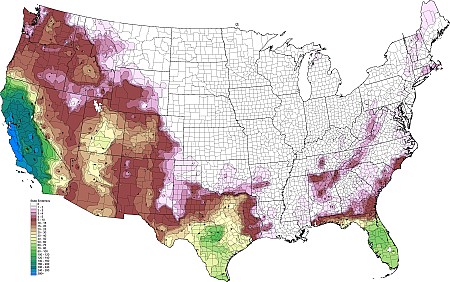
17) Density Gradient of State Endemic Plant Species per 10,000 km². BONAP©2015 |
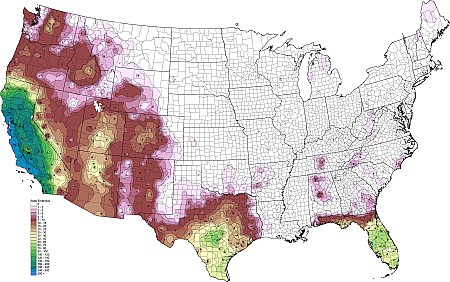
18) Density Gradient of State Endemic Plant Taxa per 2,500 km². BONAP©2015 |
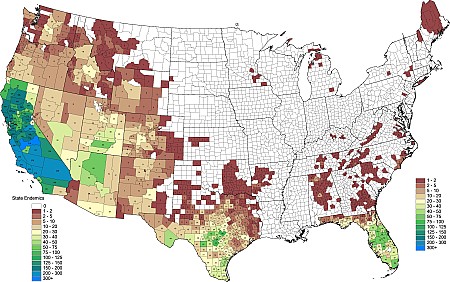
19) Number of Documented State Endemic Vascular Plant Species by County. BONAP©2015 NEW |
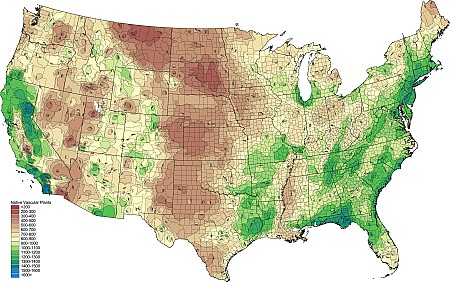
20) Density Gradient of Native Vascular Plant Species per 2,500 km². BONAP©2015 |
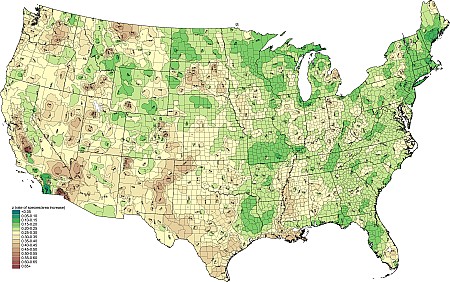
21) Species Area Relationship between 2,500 km² and 10,000 km² (z = log(species)/log(Area)). BONAP©2015 |
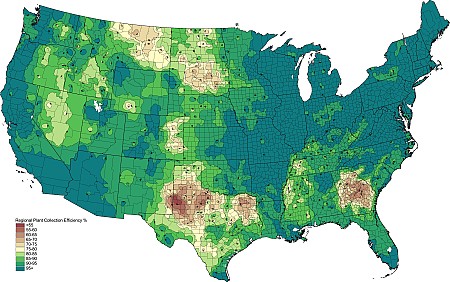
22) Plant Collection Efficiency (documented ranges relative to projected species ranges). BONAP©2015 |
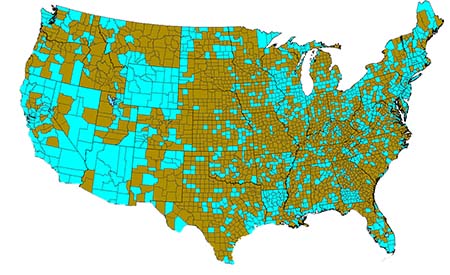
23) US Counties (in blue) with extensive floristic surveys/inventories plus those that house significant plant collections (herbaria/museums). BONAP©2015 NEW |
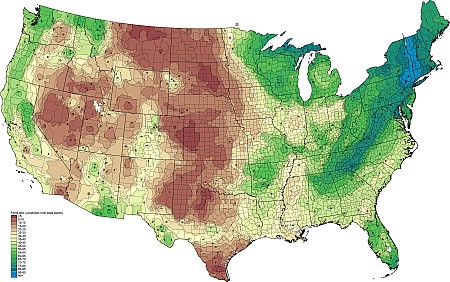
24) Density Gradient of Native Spore Dispersed Vascular Plant (Ferns and Lycophytes) Species per 10,000 km². BONAP©2015 |
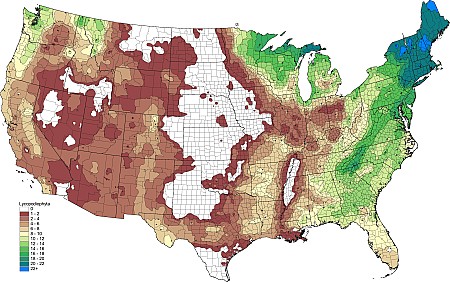
25) Density Gradient of Native Lycophyte Species per 10,000 km². BONAP©2015 |
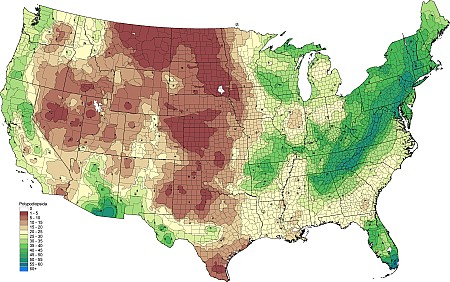
26) Density Gradient of Native Leptosporangiate Fern Species per 10,000 km². BONAP©2015 |
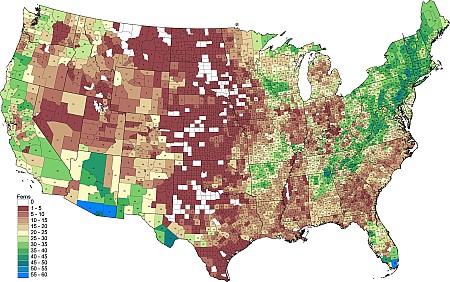
27) Number of Documented Native Fern Species by County. BONAP©2015 NEW |
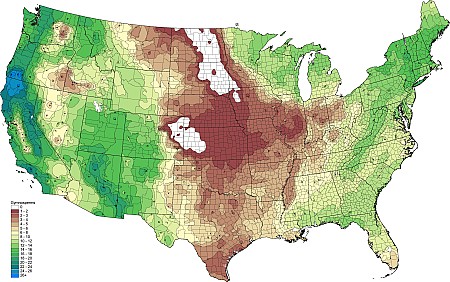
28) Density Gradient of Native Gymnosperm Species per 10,000 km². BONAP©2015 |
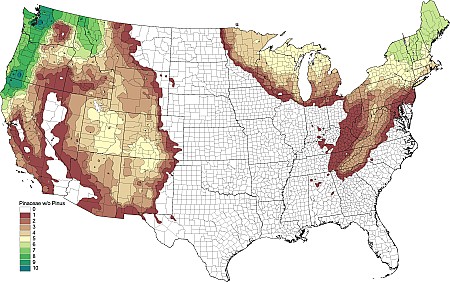
29) Density Gradient of Native Non-Pinus Pinaceae Species per 10,000 km². BONAP©2015 |
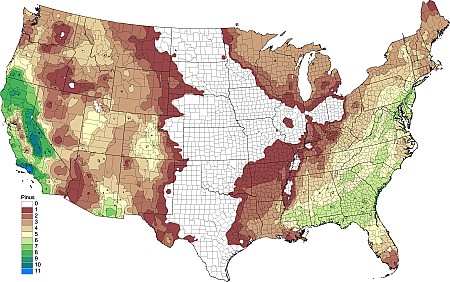
30) Density Gradient of Native Pine (Pinus) Species per 10,000 km². BONAP©2015 |
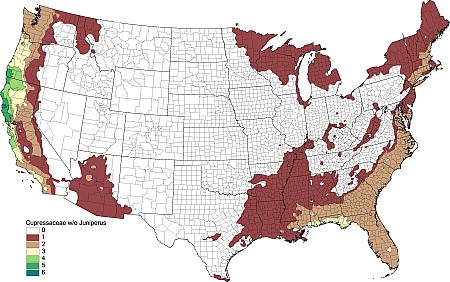
31) Density Gradient of Native Non-Juniperus Cupressaceae Species per 10,000 km². BONAP©2015 |
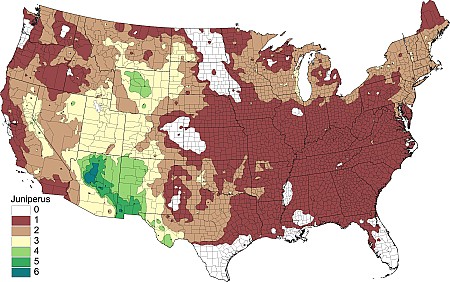
32) Density Gradient of Native Juniperus Species per 10,000 km². BONAP©2015 |
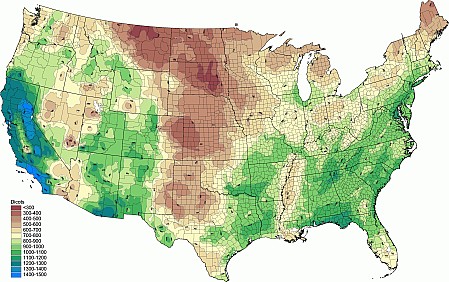
33) Density Gradient of Native Dicot Species per 10,000 km². BONAP©2015 |
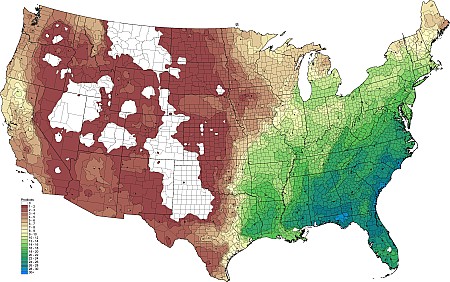
34) Density Gradient of Native Paleodicot (primitive dicot grade) Species per 10,000 km². BONAP©2015 |
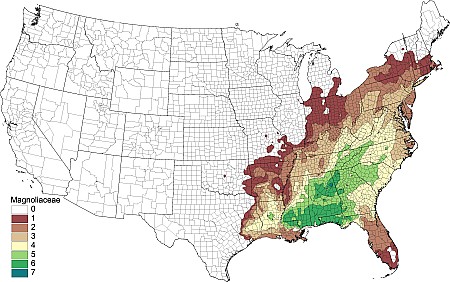
35) Density Gradient of Native Magnoliaceae Species per 10,000 km². BONAP©2015 |
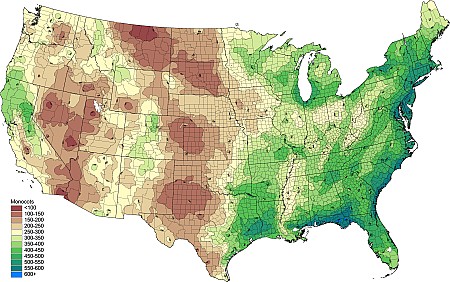
36) Density Gradient of Native Monocot Species per 10,000 km². BONAP©2015 |
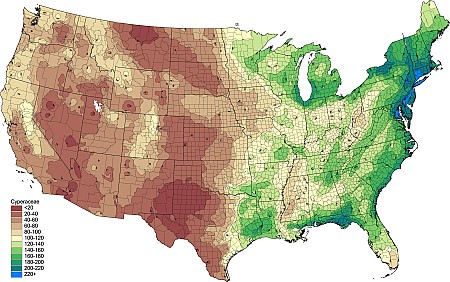
37) Density Gradient of Native Cyperaceae Species per 10,000 km². BONAP©2015 |
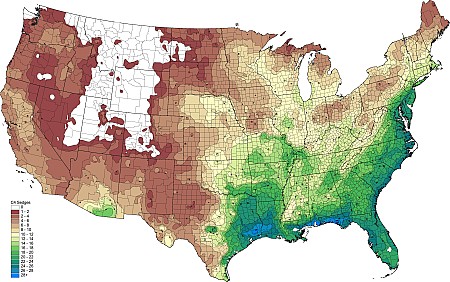
38) Density Gradient of Native C4 Sedge Species per 10,000 km². BONAP©2015 |
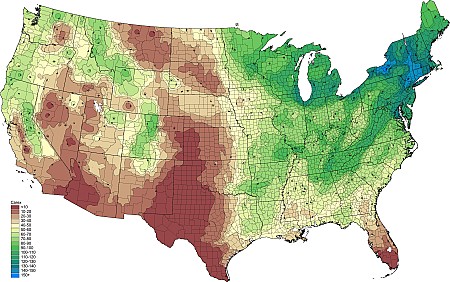
39) Density Gradient of Native Carex Species per 10,000 km². BONAP©2015 |
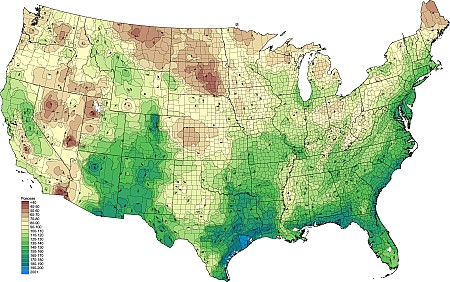
40) Density Gradient of Native Grass (Poaceae) Species per 10,000 km². BONAP©2015 |
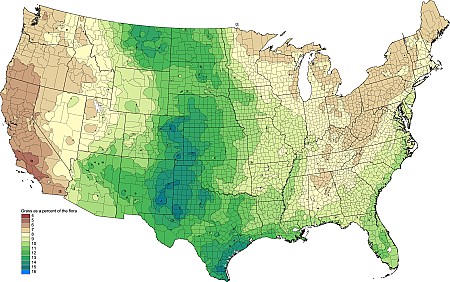
41) Percentage Grass Species Among Native Vascular Plants. BONAP©2015 |
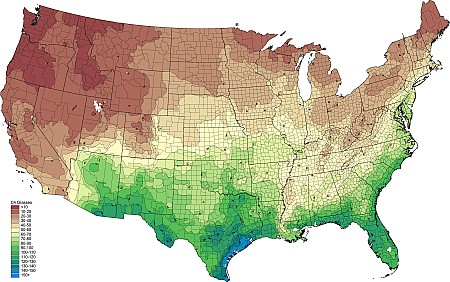
42) Density Gradient of Native C4 Grass Species per 10,000 km². BONAP©2015 |
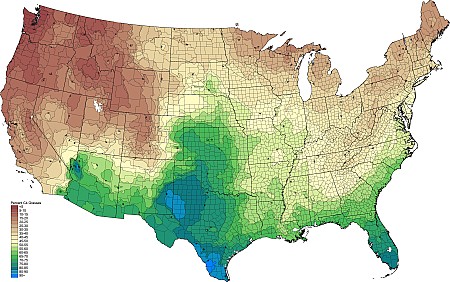
43) Percentage C4 Species Among Native Grasses. BONAP©2015 |
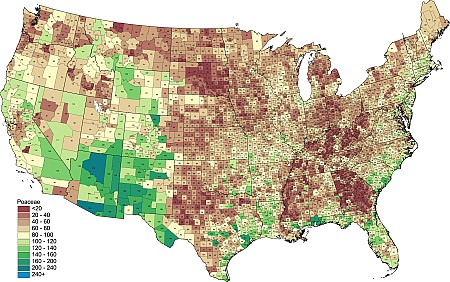
44) Number of Documented Native Poaceae Species by County. BONAP©2015 NEW |
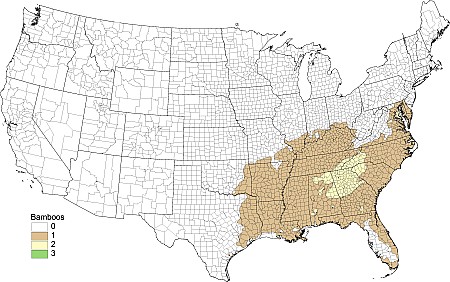
45) Density Gradient of Native Bamboo Species per 10,000 km². BONAP©2015 |
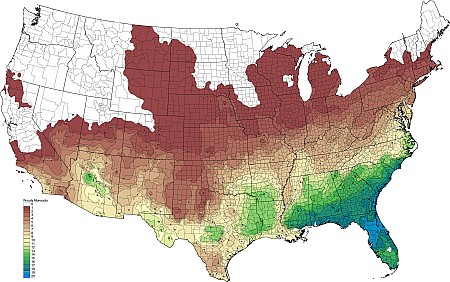
46) Density Gradient of Native Woody Monocot Species per 10,000 km². BONAP©2015 |
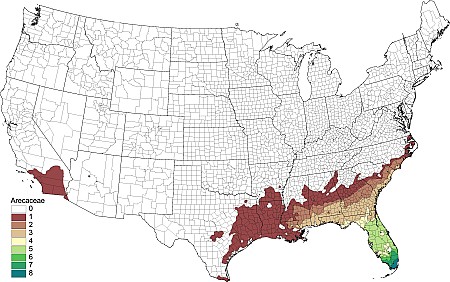
47) Density Gradient of Native Palm (Arecaceae) Species per 10,000 km². BONAP©2015 |
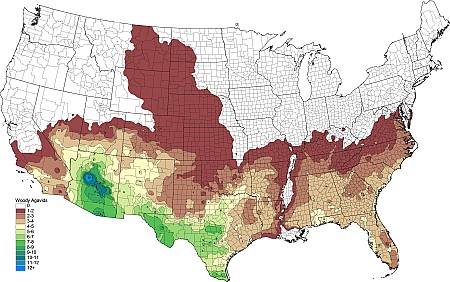
48) Density Gradient of Native Woody Agavaceae Species per 10,000 km². BONAP©2015 |
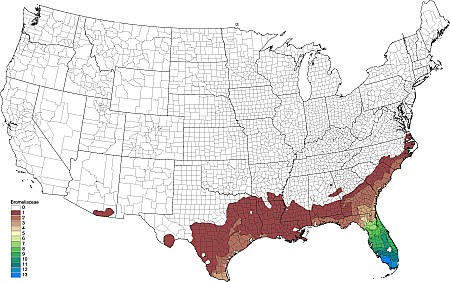
49) Density Gradient of Native Bromeliaceae Species per 10,000 km². BONAP©2015 |
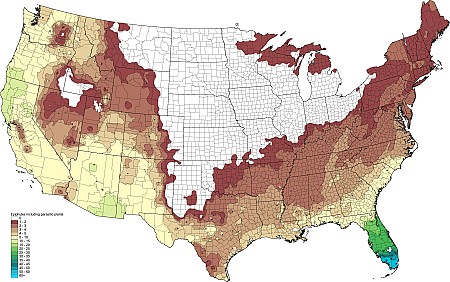
50) Density Gradient of Native Epiphytic Species (including parasites) per 10,000 km². BONAP©2015 |
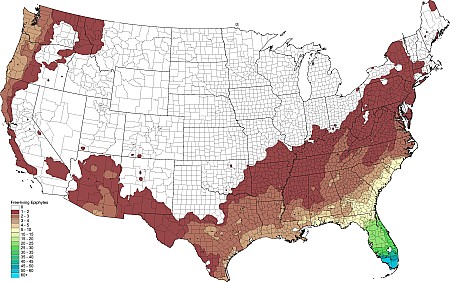
51) Density Gradient of Native Free-living Epiphytic Species per 10,000 km². BONAP©2015 |
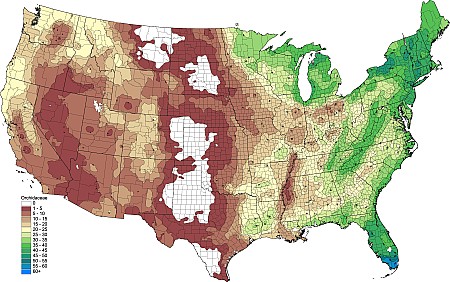
52) Density Gradient of Native Orchid (Orchidaceae) Species per 10,000 km². BONAP©2015 |
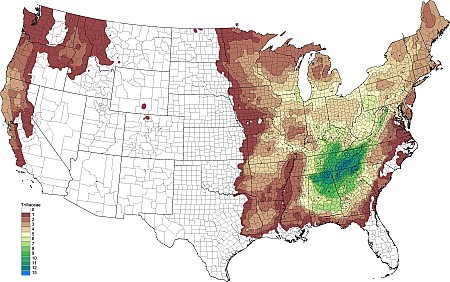
53) Density Gradient of Native Trillium (Trilliaceae) Species per 10,000 km². BONAP©2015 |
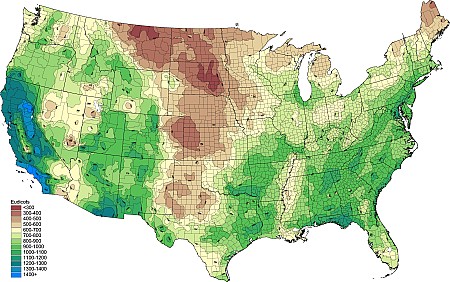
54) Density Gradient of Native Eudicot Clade Species per 10,000 km². BONAP©2015 |
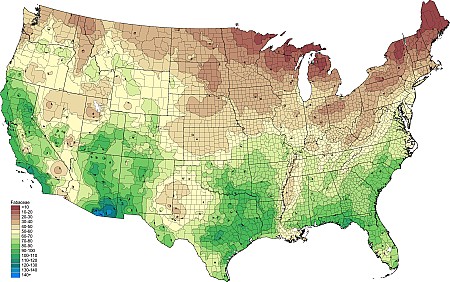
55) Density Gradient of Native Fabaceae Species per 10,000 km². BONAP©2015 |
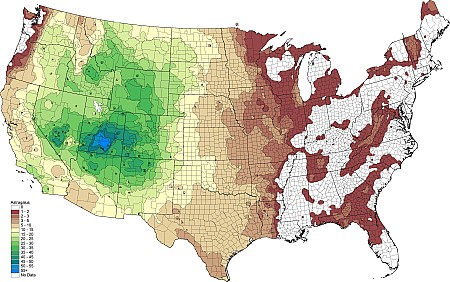
56) Density Gradient of Native Astragalus Species per 10,000 km². BONAP©2015 |
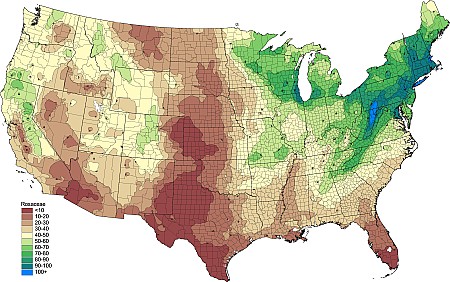
57) Density Gradient of Native Rosaceae Species per 10,000 km². BONAP©2015 |
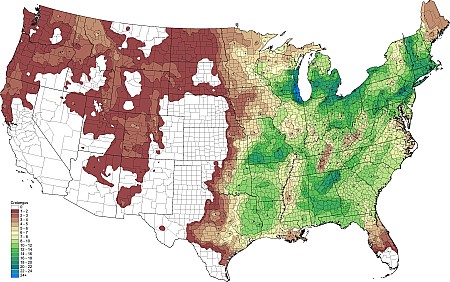
58) Density Gradient of Native Crataegus Species per 10,000 km². BONAP©2015 |
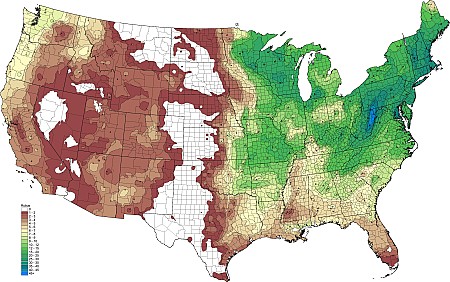
59) Density Gradient of Native Rubus Species per 10,000 km². BONAP©2015 |
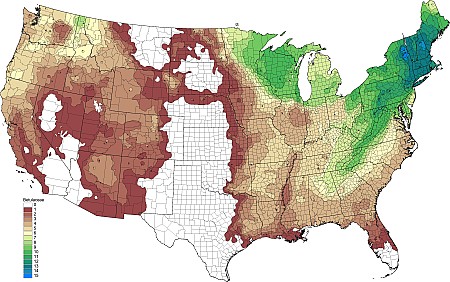
60) Density Gradient of Native Betulaceae Species per 10,000 km². BONAP©2015 |
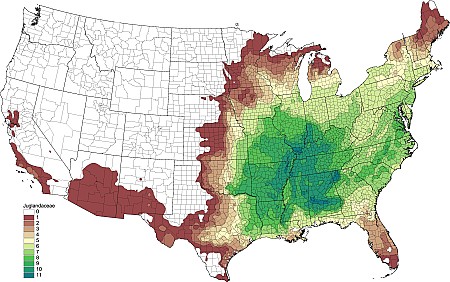
61) Density Gradient of Native Juglandaceae Species per 10,000 km². BONAP©2015 |
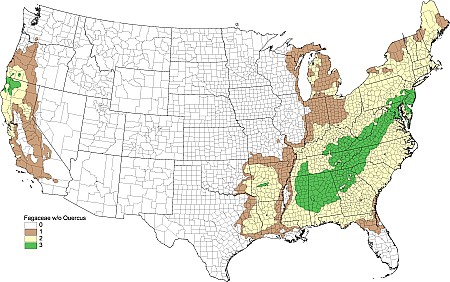
62) Density Gradient of Native Non-Quercus Fagaceae Species per 10,000 km². BONAP©2015 |
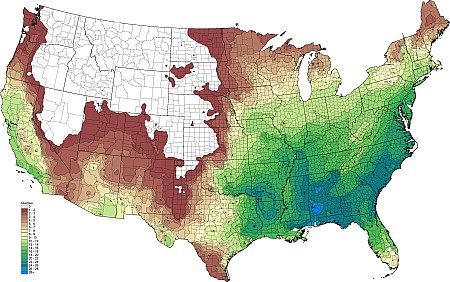
63) Density Gradient of Native Oak (Quercus) Species per 10,000 km². BONAP©2015 |
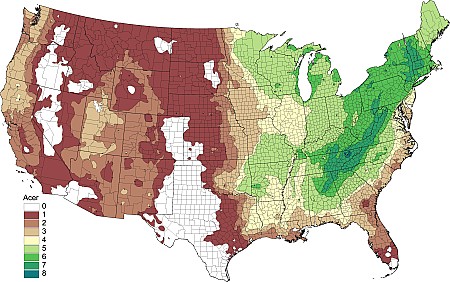
64) Density Gradient of Native Acer Species per 10,000 km². BONAP©2015 |
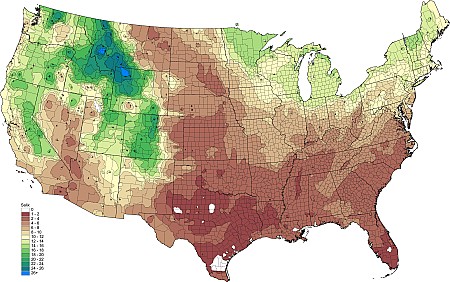
65) Density Gradient of Native Salix Species per 10,000 km². BONAP©2015 |
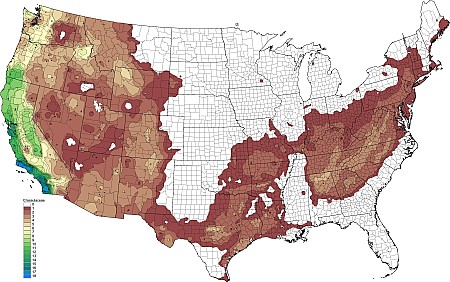
66) Density Gradient of Native Crassulaceae Species per 10,000 km². BONAP©2015 |
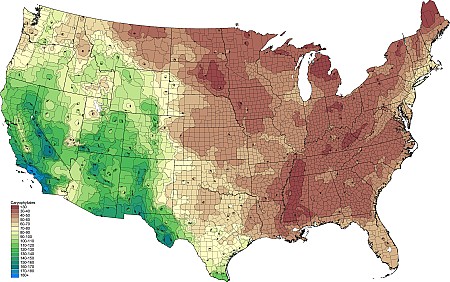
67) Density Gradient of Native Caryophyllales Species per 10,000 km². BONAP©2015 |
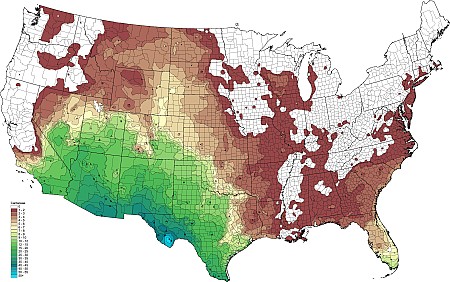
68) Density Gradient of Native Cactus (Cactaceae) Species per 10,000 km². BONAP©2015 |
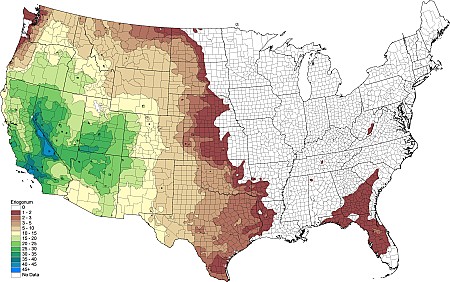
69) Density Gradient of Native Eriogonum Species per 10,000 km². BONAP©2015 |
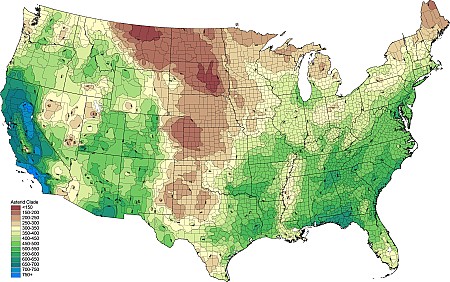
70) Density Gradient of Native Asterid Clade Species per 10,000 km². BONAP©2015 |
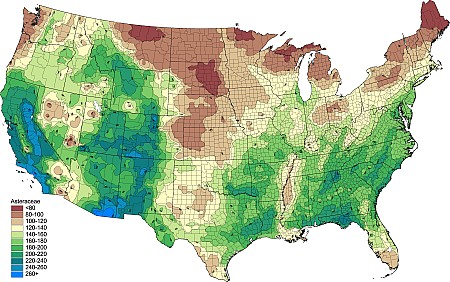
71) Density Gradient of Native Asteraceae Species per 10,000 km². BONAP©2015 |
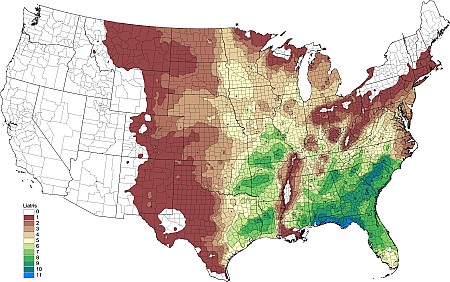
72) Density Gradient of Native Liatris Species per 10,000 km². BONAP©2015 |
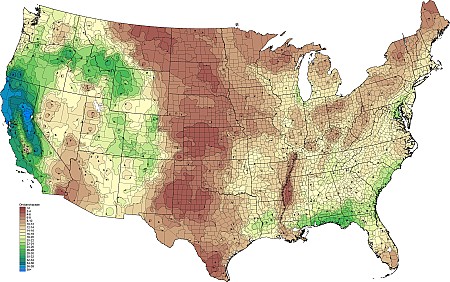
73) Density Gradient of Native Orobanchaceae Species per 10,000 km². BONAP©2015 |
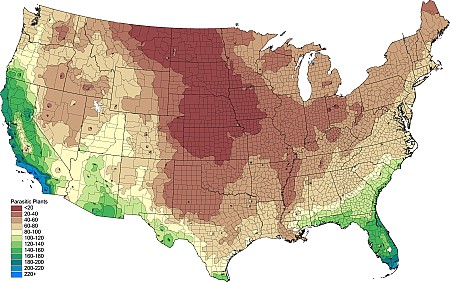
74) Density Gradient of Native Parasitic Plant (including hemiparasites and achlorophyllous mycotrophs) Species per 10,000 km². BONAP©2015 |
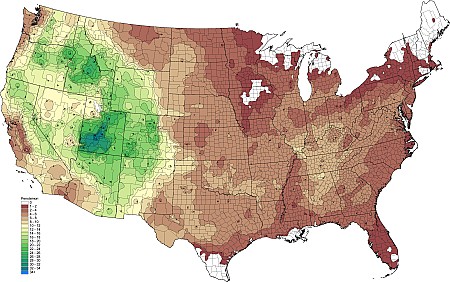
75) Density Gradient of Native Penstemon Species per 10,000 km². BONAP©2015 |
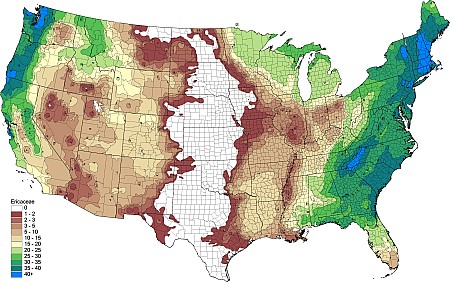
76) Density Gradient of Native Ericaceae Species per 10,000 km². BONAP©2015 |
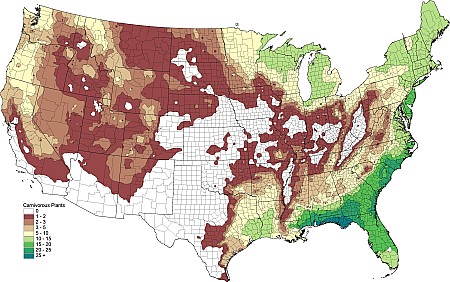
77) Density Gradient of Native Carnivorous Plant Species per 10,000 km². BONAP©2015 |
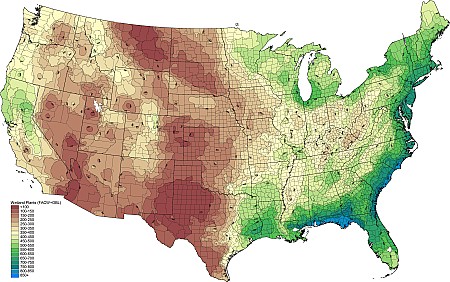
78) Density Gradient of Native Wetland Plant Species per 10,000 km². BONAP©2015 |
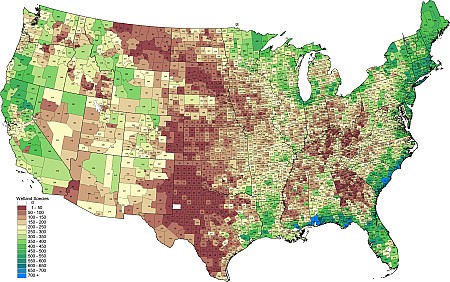
79) Number of Documented Native Wetland (OBL, FACW) Species by County. BONAP©2015 NEW |
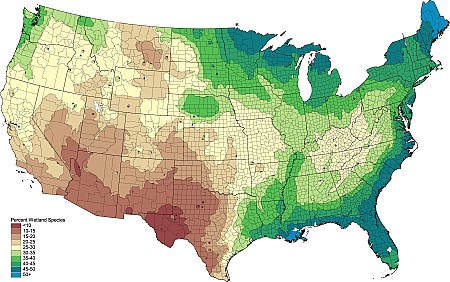
80) Percentage Wetland Species Among Native Vascular Plants. BONAP©2015 |
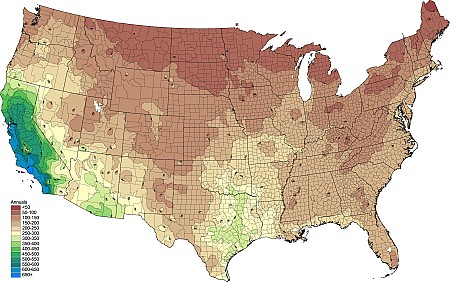
81) Density Gradient of Native Annual Plant Species per 10,000 km². BONAP©2015 |
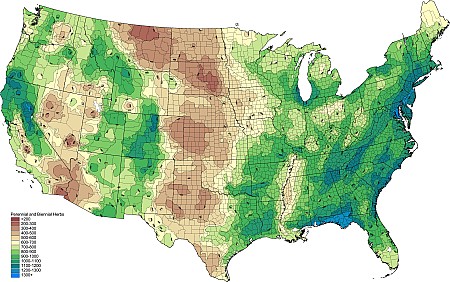
82) Density Gradient of Native Perennial plus Biennial Plant Species per 10,000 km². BONAP©2015 |
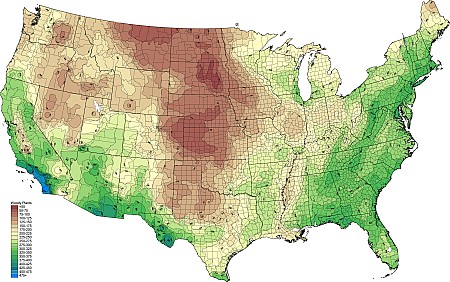
83) Density Gradient of Native Woody Plant Species per 10,000 km². BONAP©2015 |
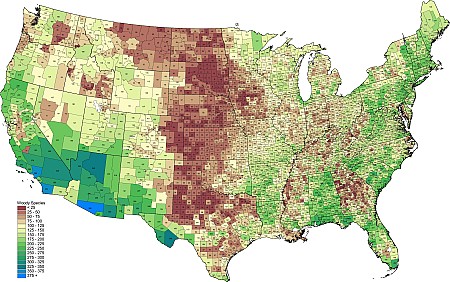
84) Number of Documented Native Woody Species by County. BONAP©2015 NEW |
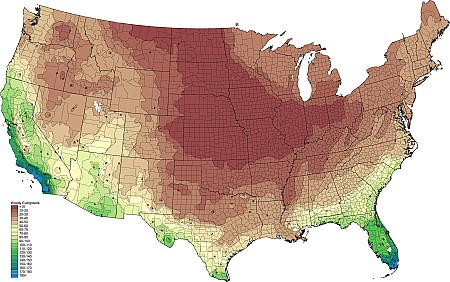
85) Density Gradient of Native Evergreen Woody Plant Species per 10,000 km². BONAP©2015 |
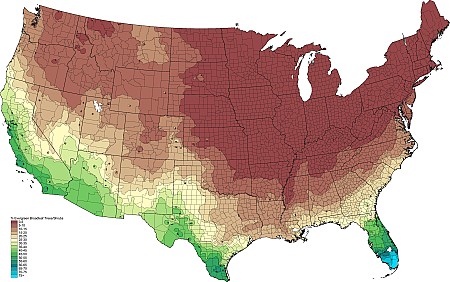
86) Percentage Evergreen Species Among Native Woody Plants. BONAP©2015 |
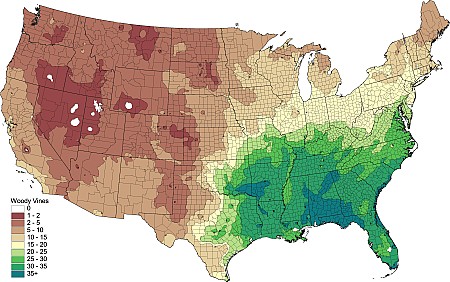
87) Density Gradient of Native Woody Vine Species per 10,000 km². BONAP©2015 |
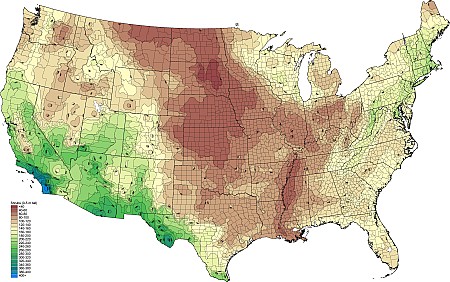
88) Density Gradient of Native Shrub (<5 m tall) Species per 10,000 km². BONAP©2015 |
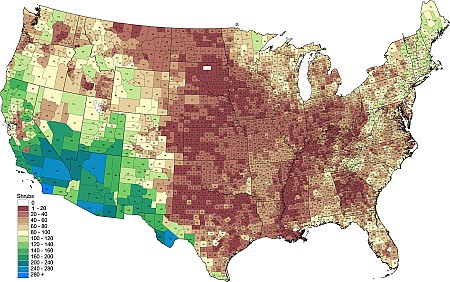
89) Number of Documented Native Shrub Species by County. BONAP©2015 NEW |
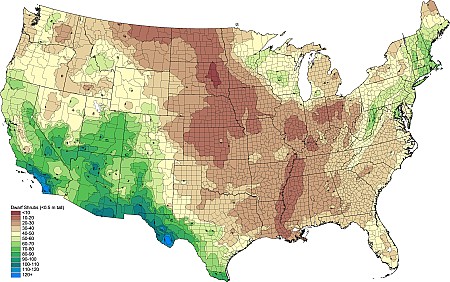
90) Density Gradient of Native Dwarf Shrub (<50 cm) plus Subshrub Species per 10,000 km². BONAP©2015 |
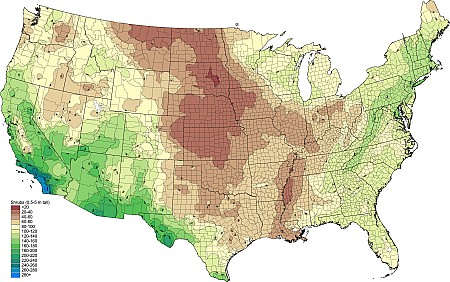
91) Density Gradient of Native Medium to Large Shrub (0.5-5 m tall) Species per 10,000 km². BONAP©2015 |
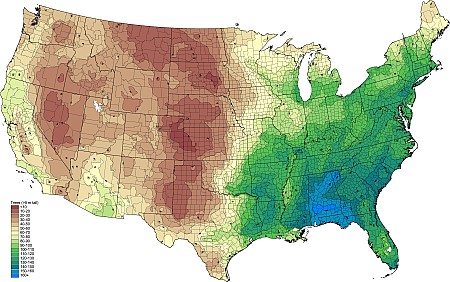
92) Density Gradient of Native Tree (>5 m tall) Species per 10,000 km². BONAP©2015 |
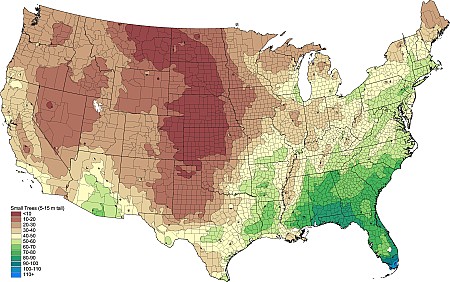
93) Density Gradient of Native Small Tree (5-15 m tall) Species per 10,000 km². BONAP©2015 |
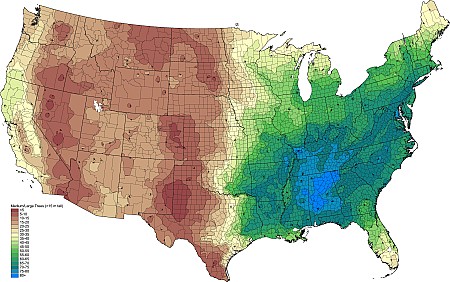
94) Density Gradient of Native Medium to Large Tree (>15 m tall) Species per 10,000 km². BONAP©2015 |
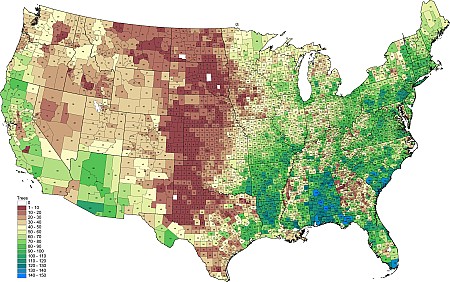
95) Number of Documented Native Tree Species by County. BONAP©2015 NEW |
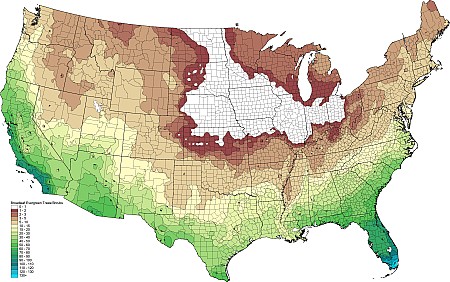
96) Density Gradient of Native Broadleaf Evergreen Tree and Shrub (> 50 cm tall) Species per 10,000 km². BONAP©2015 |
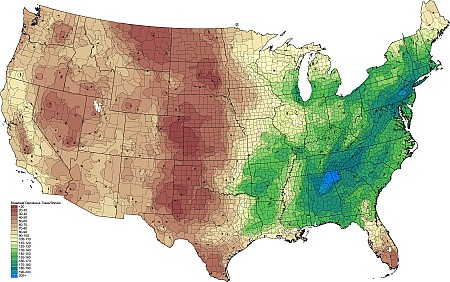
97) Density Gradient of Native Broadleaf Deciduous Tree and Shrub (> 50 cm tall) Species per 10,000 km². BONAP©2015 |
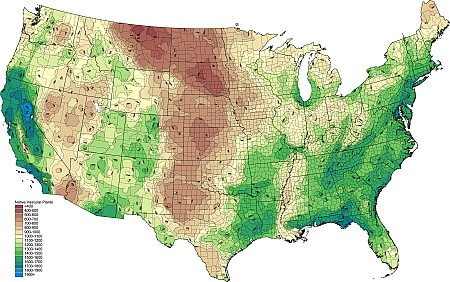
98) Density Gradient of Native Vascular Plant Species per 10,000 km² (EPA Ecoregions Template). BONAP©2015 |
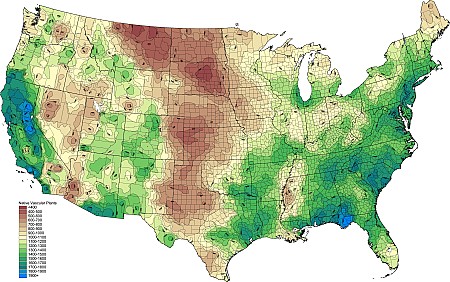
99) Density Gradient of Native Vascular Plant Species per 10,000 km² (Watersheds Template). BONAP©2015 |
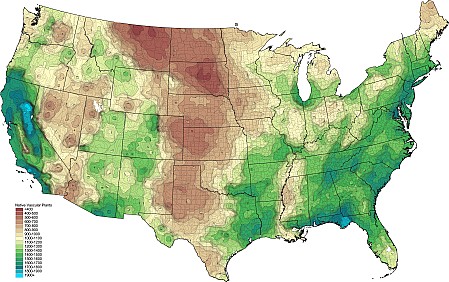
100) Density Gradient of Native Vascular Plant Species per 10,000 km² (HUC Watershed, USFS Ecoregion, and EPA Ecoregion as templates averaged). BONAP©2015 |
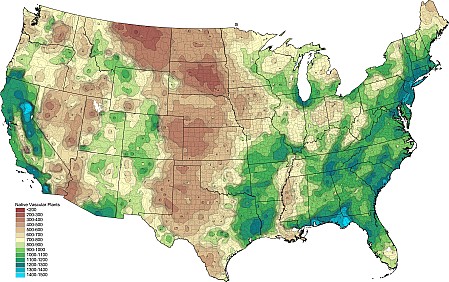
101) Density Gradient of Native Vascular Plant Species per 2,500 km² (HUC Watershed, USFS Ecoregion, and EPA Ecoregion as templates averaged). BONAP©2015 |
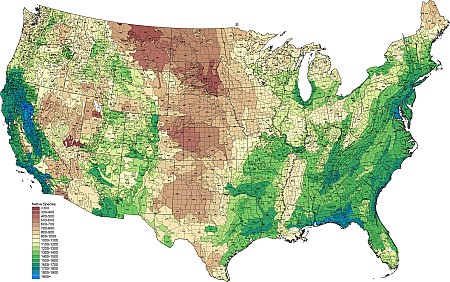
102) Native Vascular Plant Species per 10,000 km² by USFS Ecoregion. BONAP©2015 NEW |
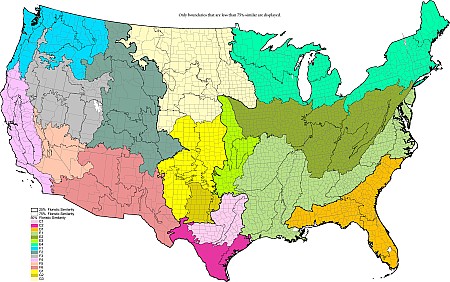
103) Floristic Similarity (Sorensen coefficient) of Native Flora among USFS Ecoregion Sections using Cluster Analysis (UPGMA). BONAP©2015 |
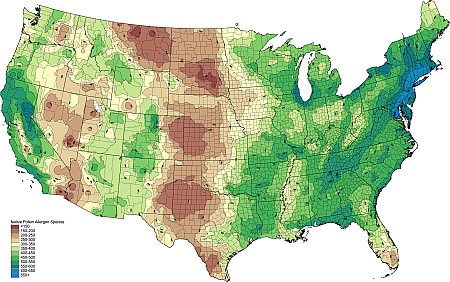
104) Density Gradient of Native Pollen Allergen Species per 10,000 km². BONAP©2015 |
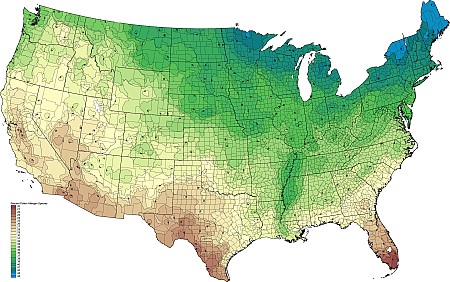
105) Percentage Pollen Allergens among Native Vascular Plant Species. BONAP©2015 |
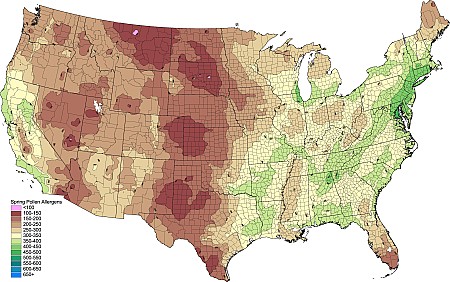
106) Density Gradient of Spring Flowering Native Pollen Allergen Species per 10,000 km². BONAP©2015 |
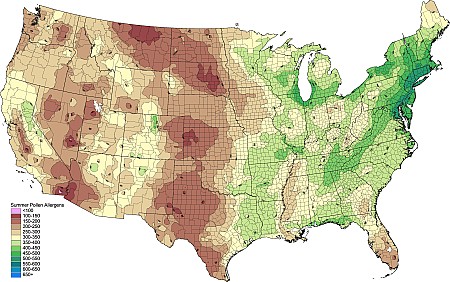
107) Density Gradient of Summer Flowering Native Pollen Allergen Species per 10,000 km². BONAP©2015 |
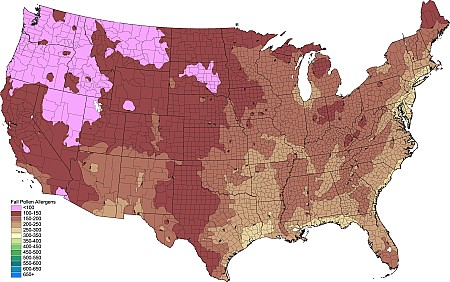
108) Density Gradient of Fall Flowering Native Pollen Allergen Species per 10,000 km². BONAP©2015 |
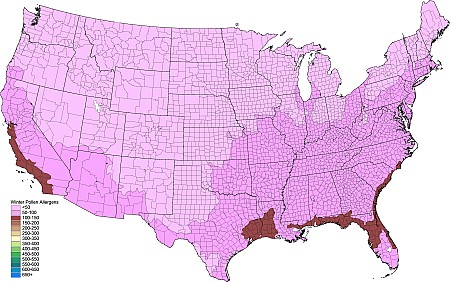
109) Density Gradient of Winter Flowering Native Pollen Allergen Species per 10,000 km². BONAP©2015 |
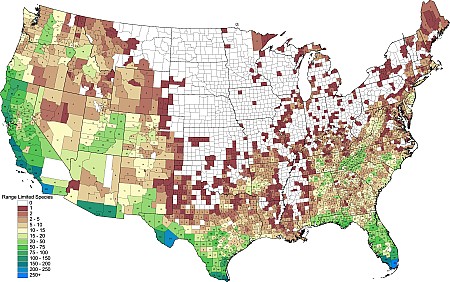
110) Number of Documented Native Range Limited (<15,000 km²) Vascular Plant Species by County. BONAP©2015 NEW |
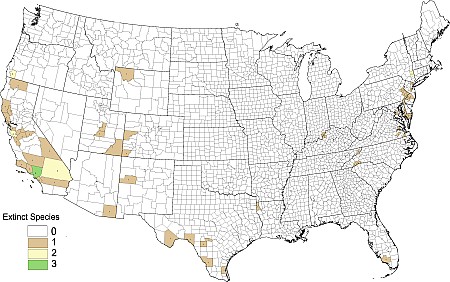
111) Number of Documented Extinct or Possibly Extinct Vascular Plant Species by County. BONAP©2015 NEW |
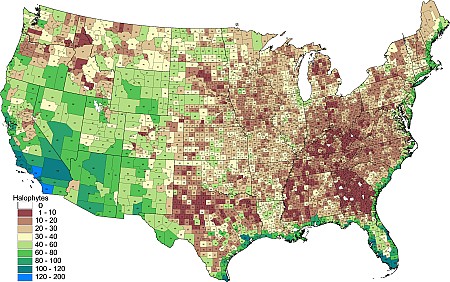
112) Number of Documented Native Halophyte Vascular Plant Species by County. BONAP©2015 NEW |
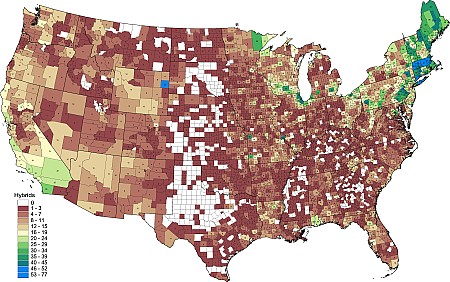
113) Number of Documented Named Hybrid (Native plus Exotic) Vascular Plant Species by County. BONAP©2015 NEW |
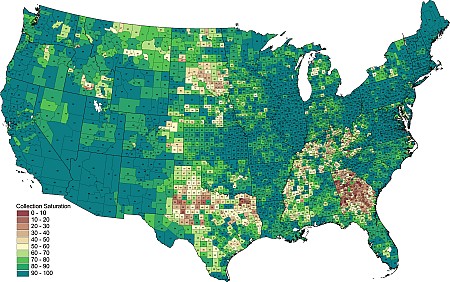
114) Approximate Percentage of Native Vascular Plant Collection Saturation (documented records versus expected species range continuity). Counties showing <80% are in great need of collecting; those showing <60% are some of our poorest collected counties; those showing 30% or less, appear to be hopeless. BONAP©2015 NEW |
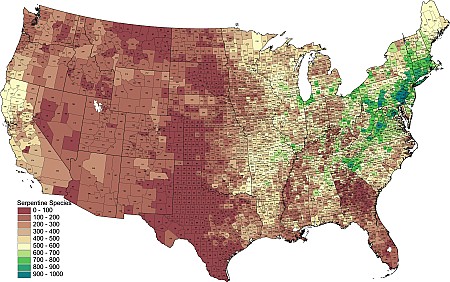
115) Number of Documented Native Serpentine-tolerant Vascular Plant Species by County. BONAP©2015 NEW |
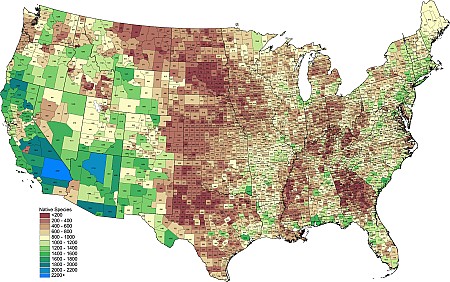
116) Number of Documented Native Vascular Plant Species by County. BONAP©2015 NEW |
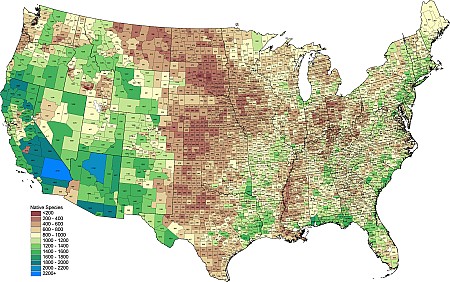
117) Number of Expected Vascular Plant Species by County (based on species range continuity). BONAP©2015 NEW |
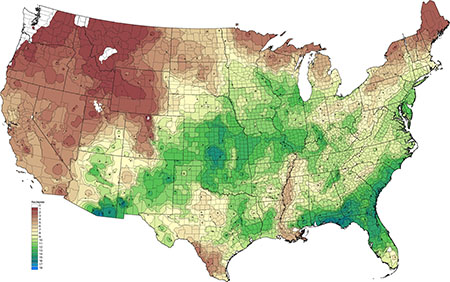
118) Density Gradient of Native Asclepias Species per 10,000 km². BONAP©2015 NEW |