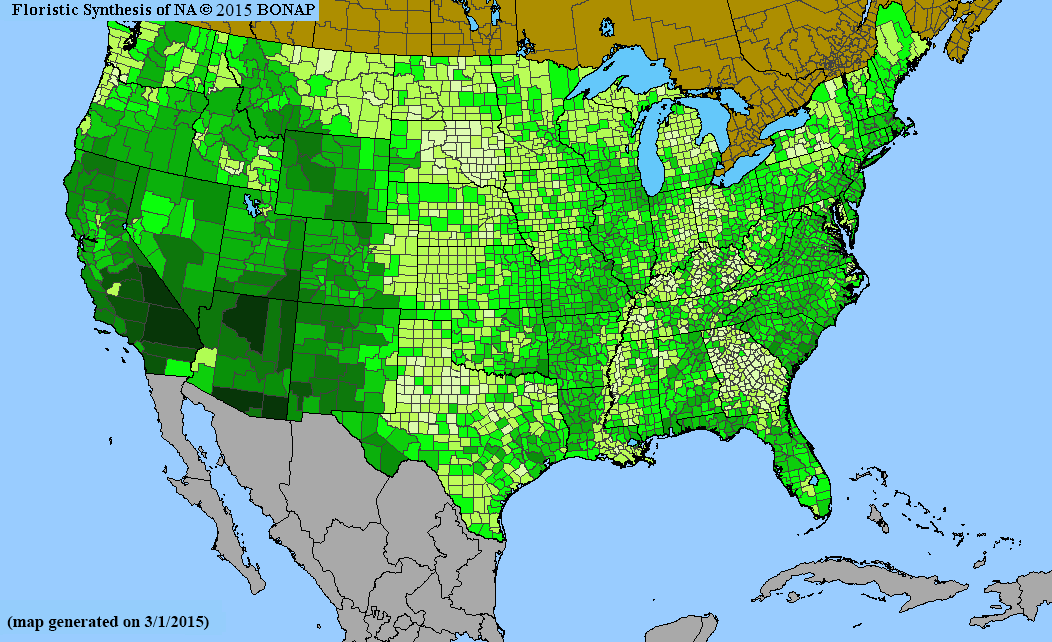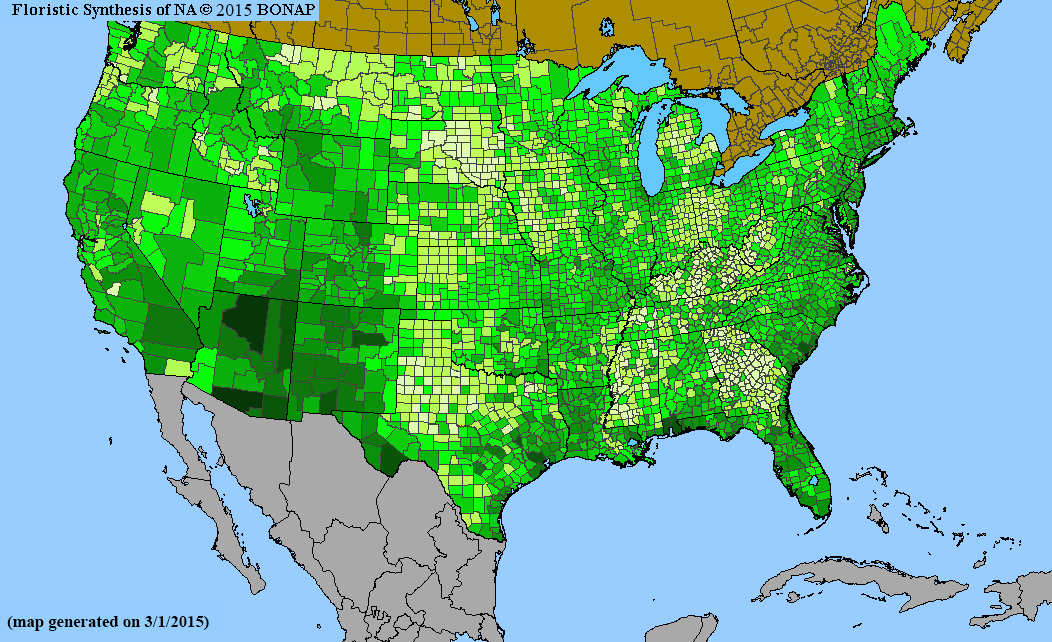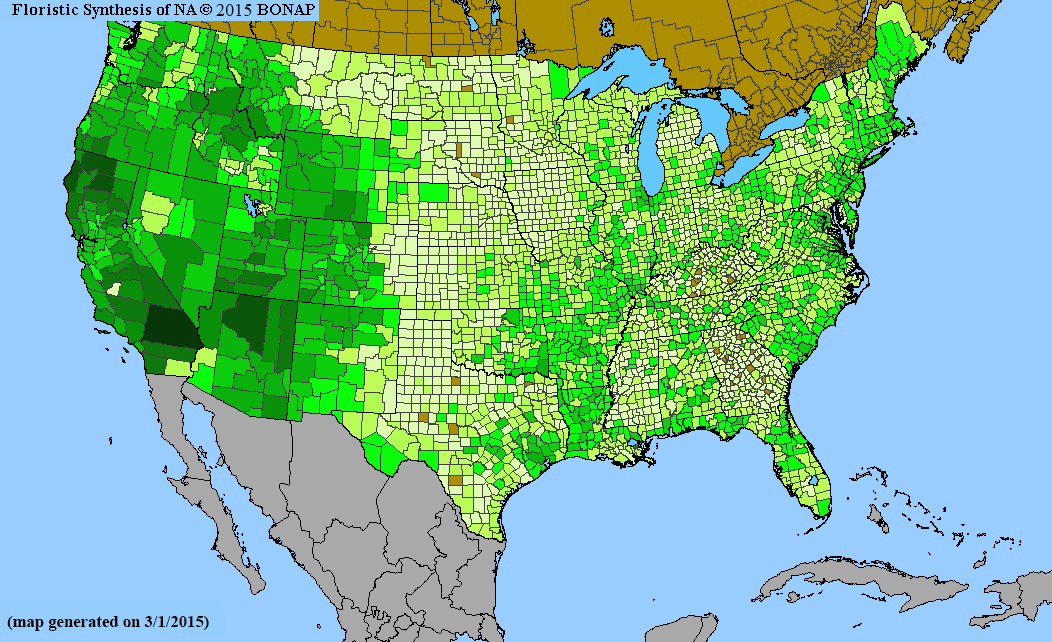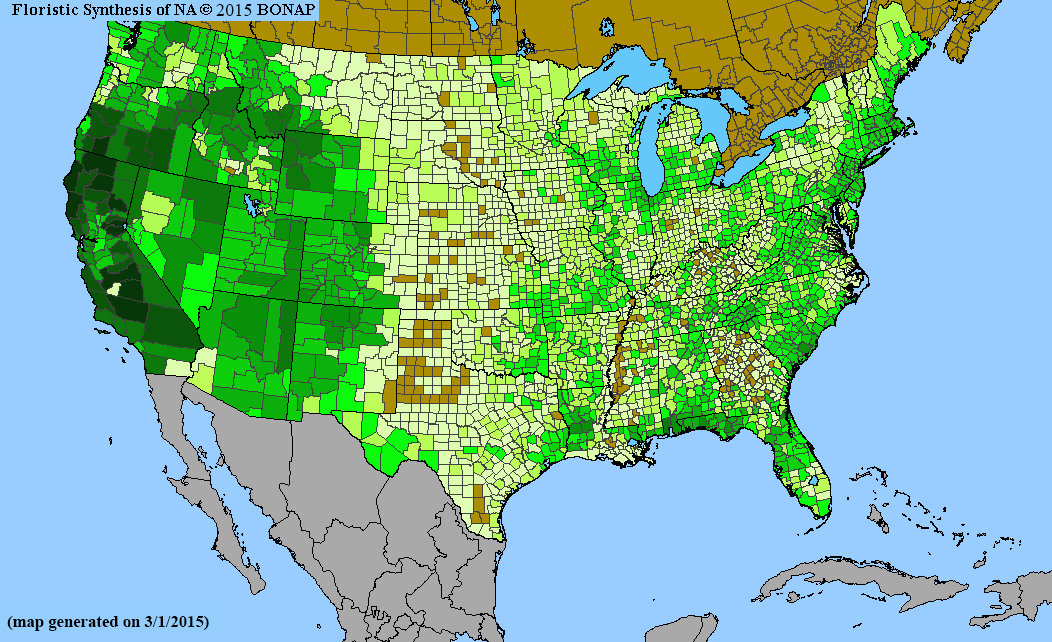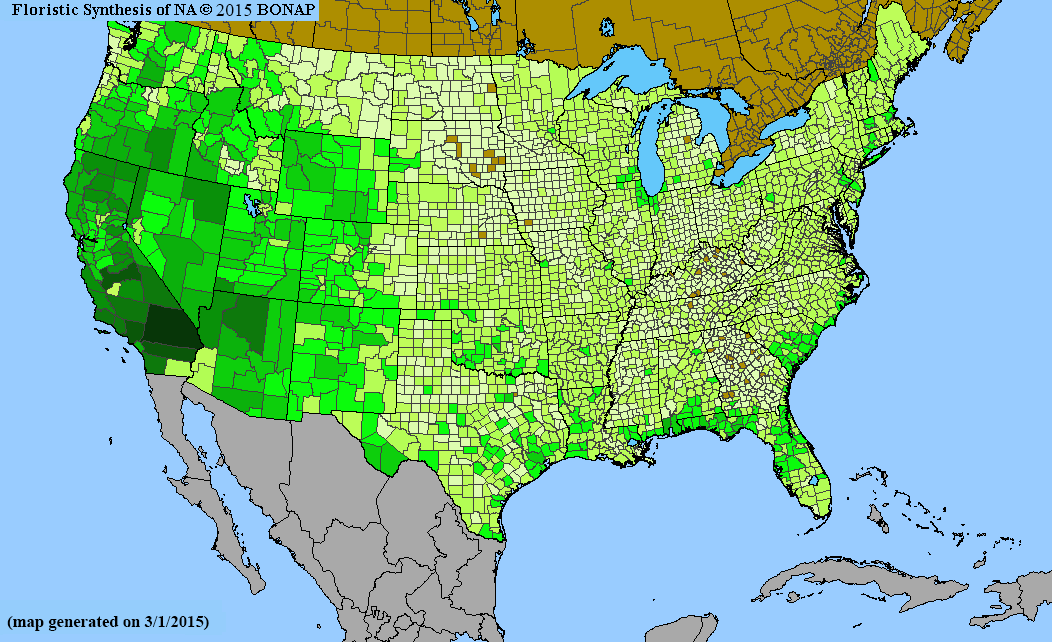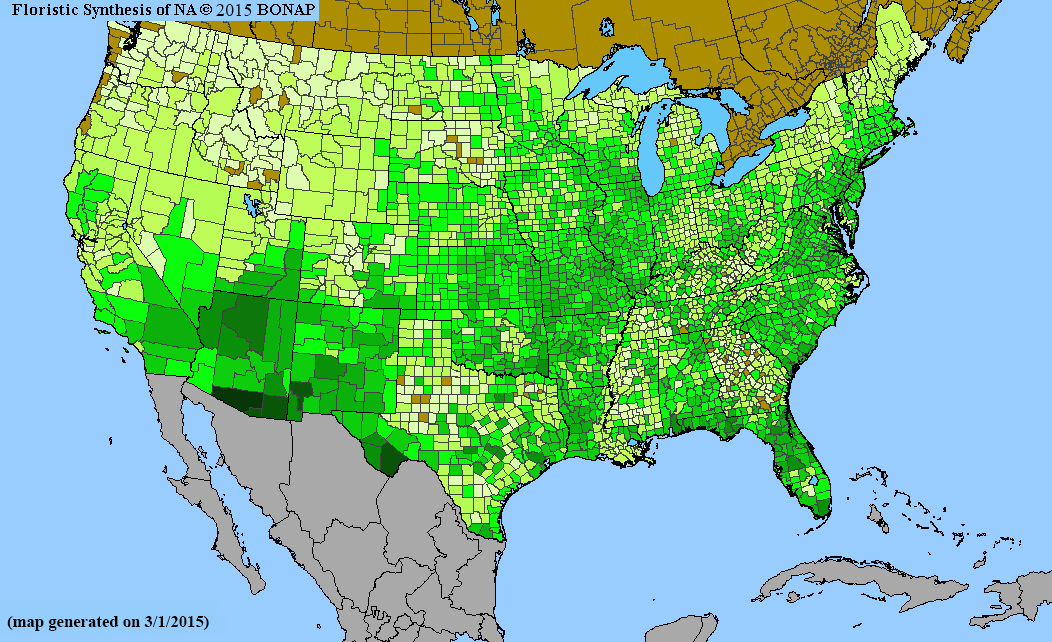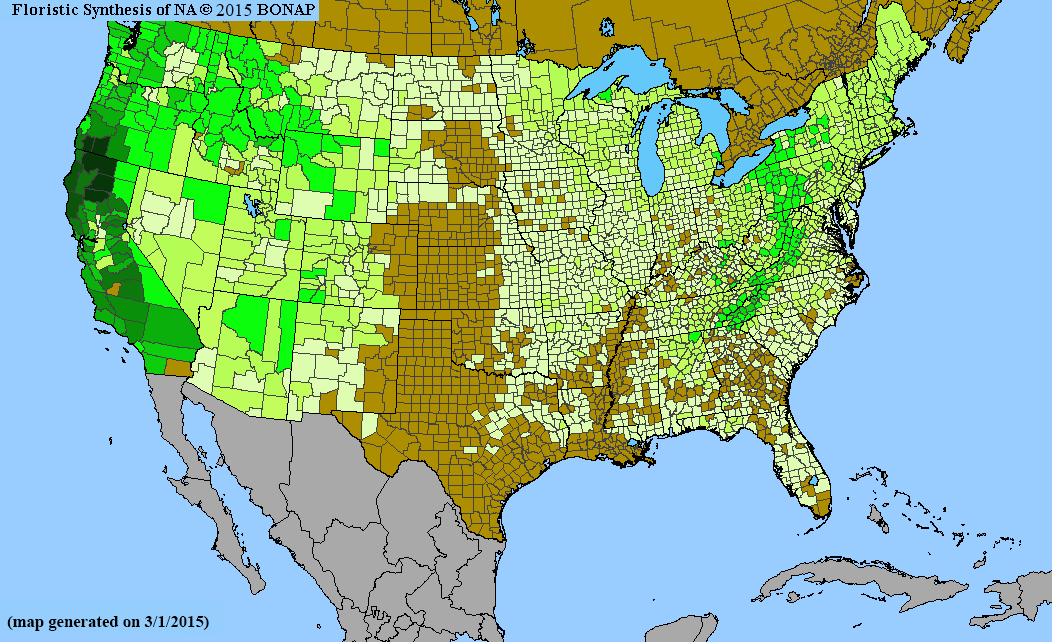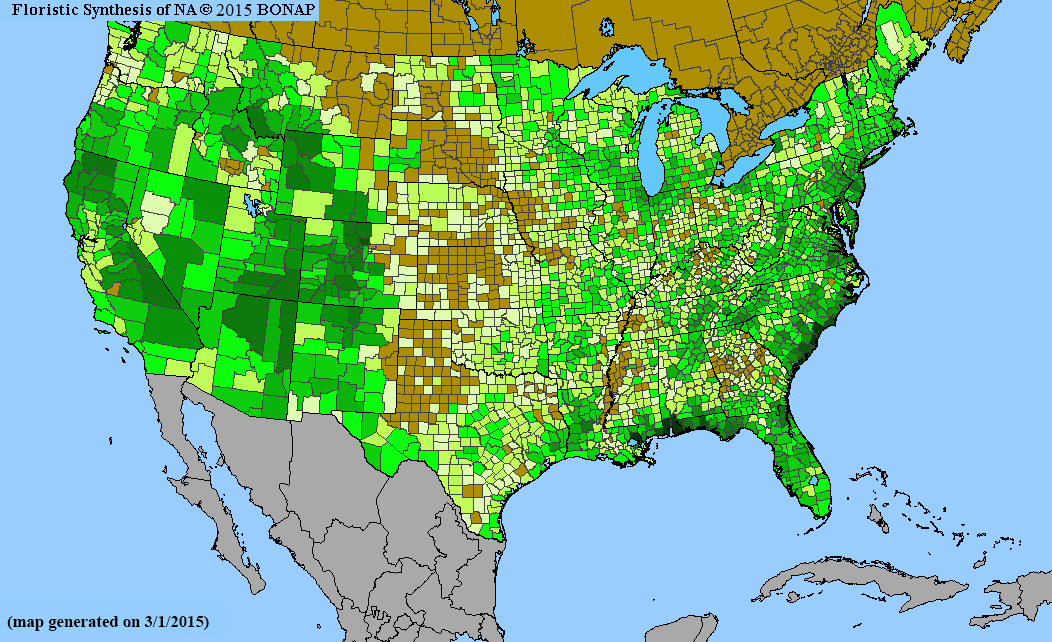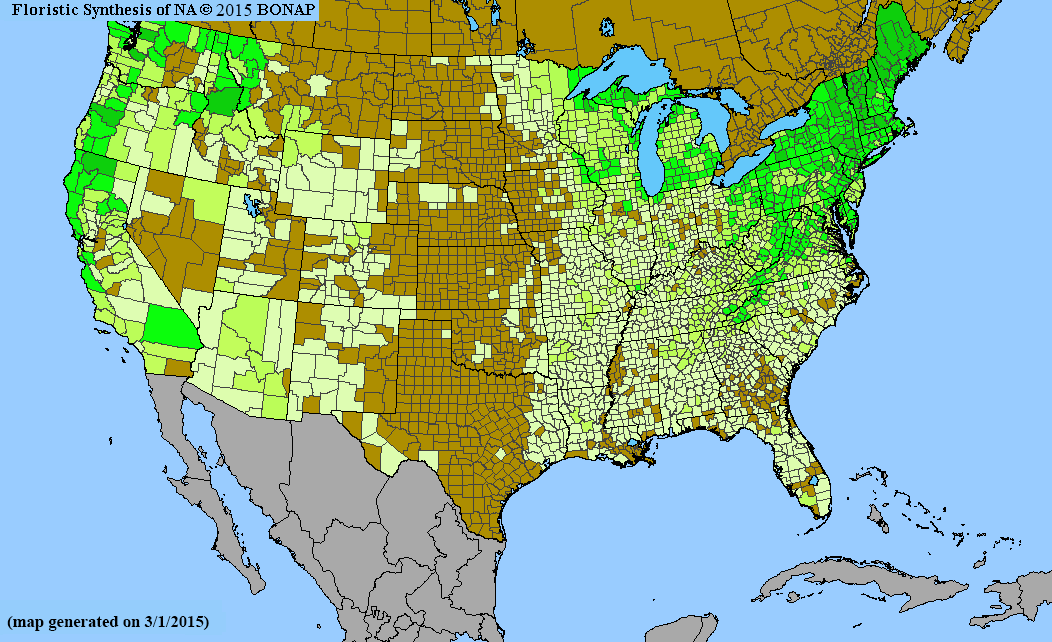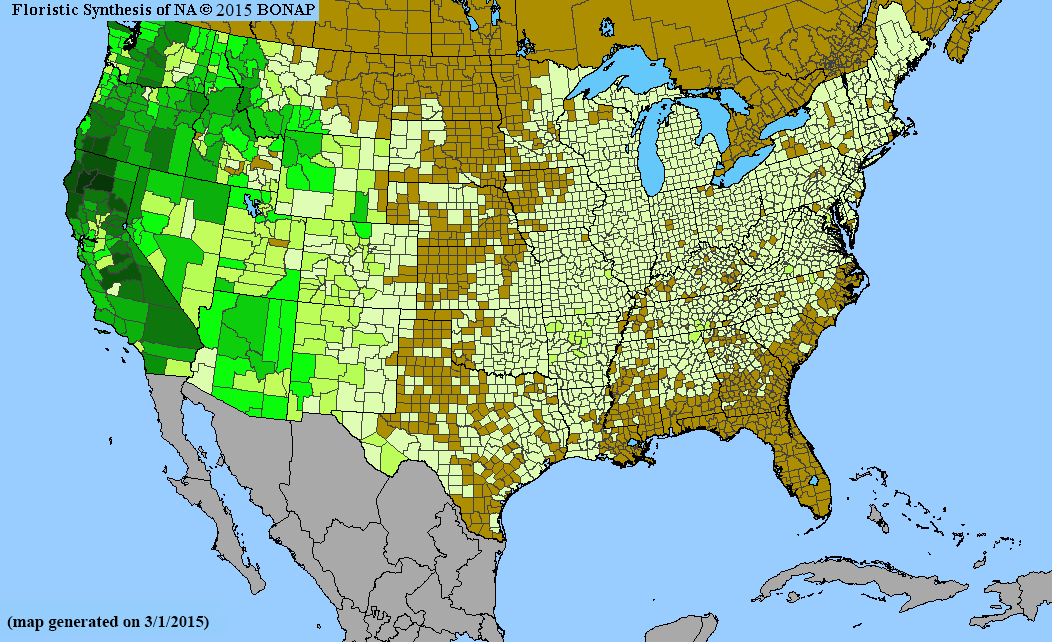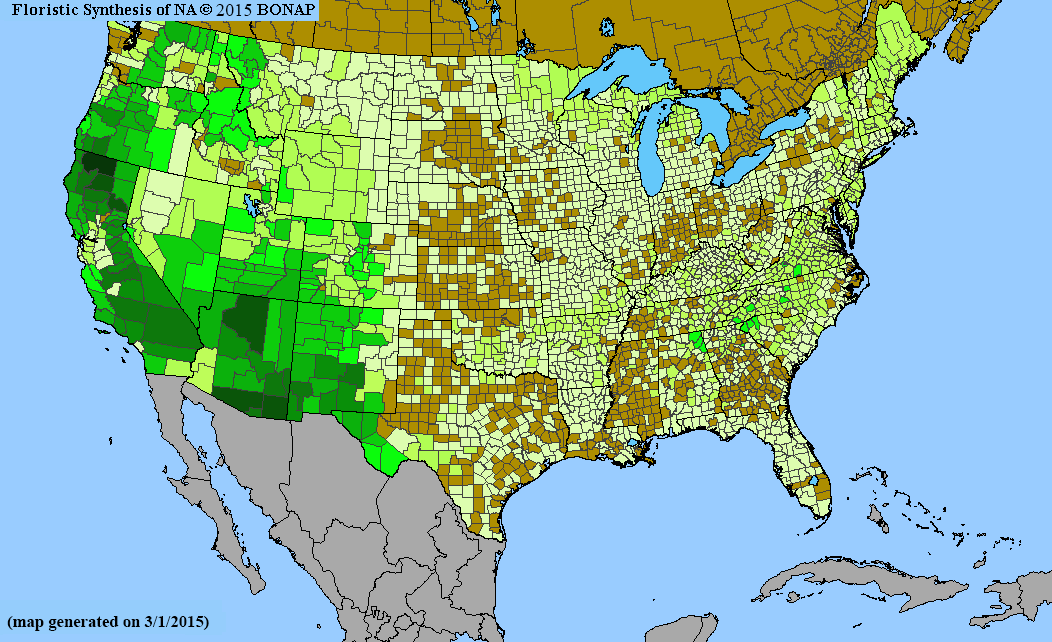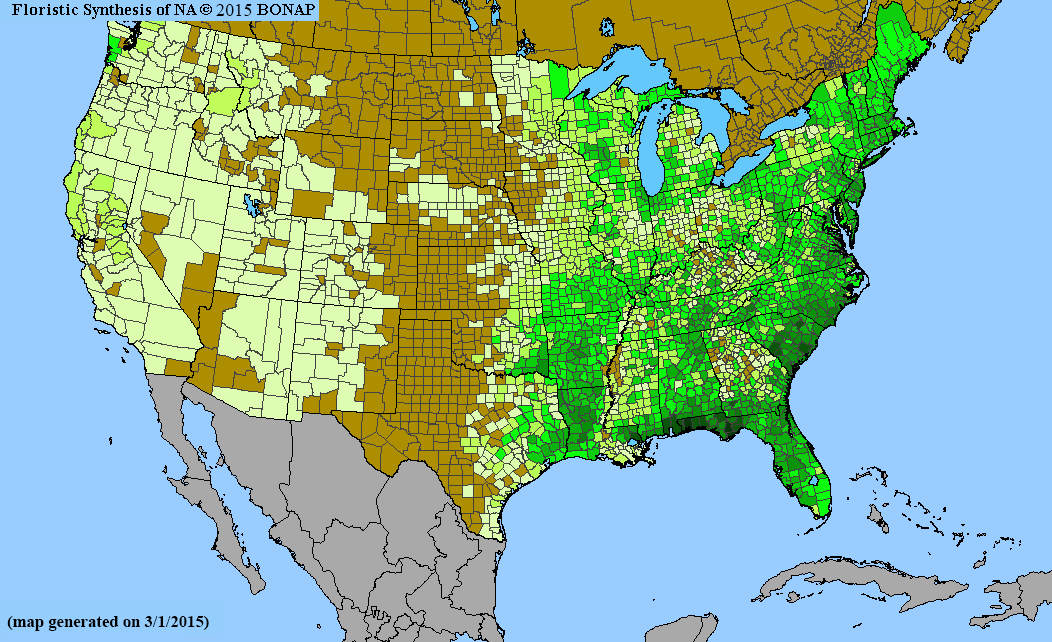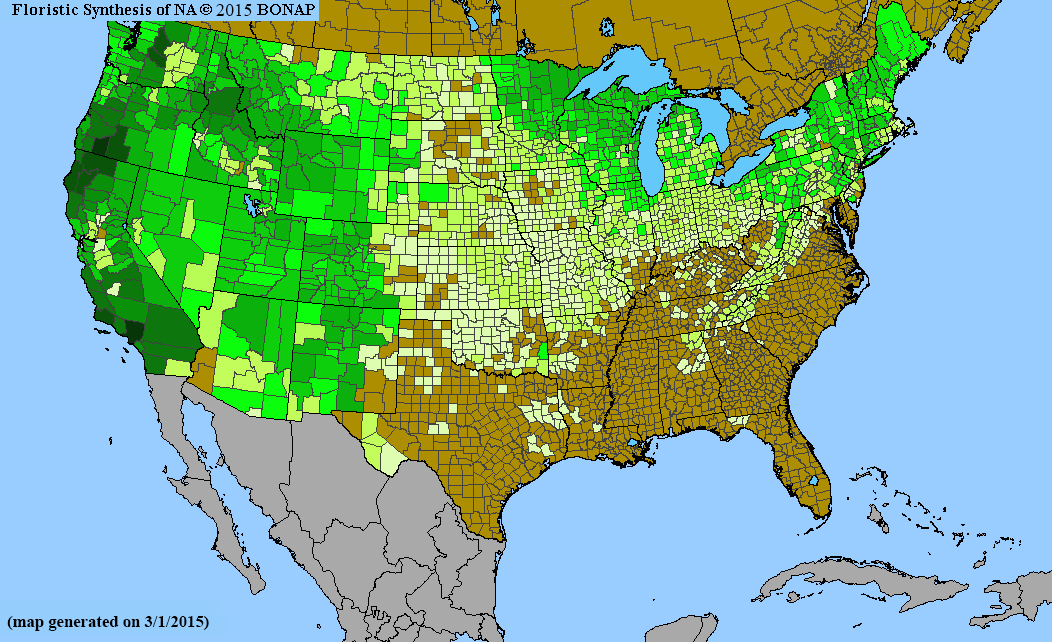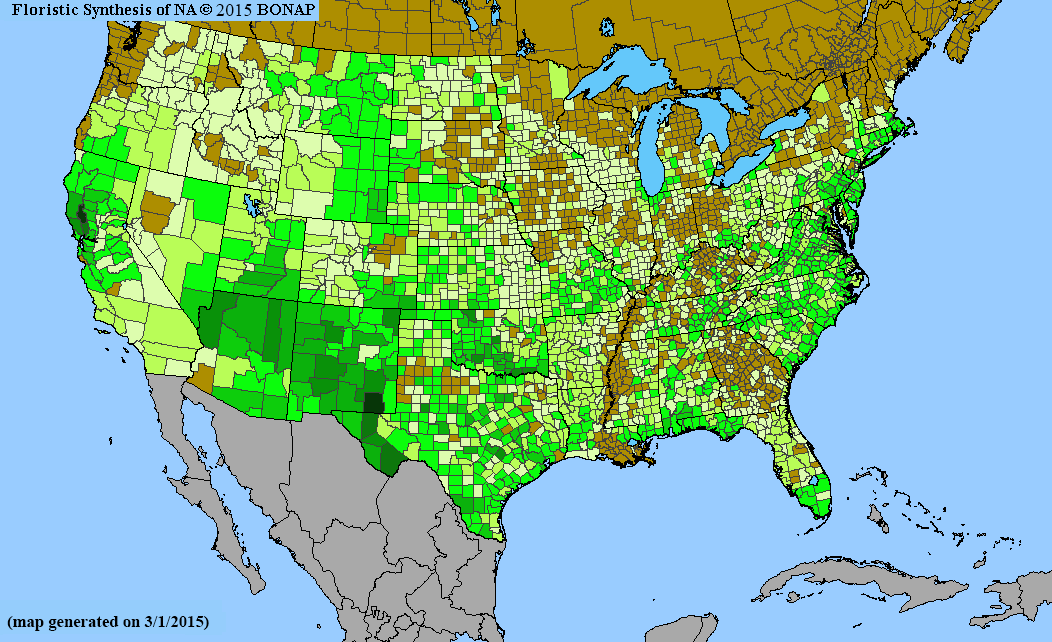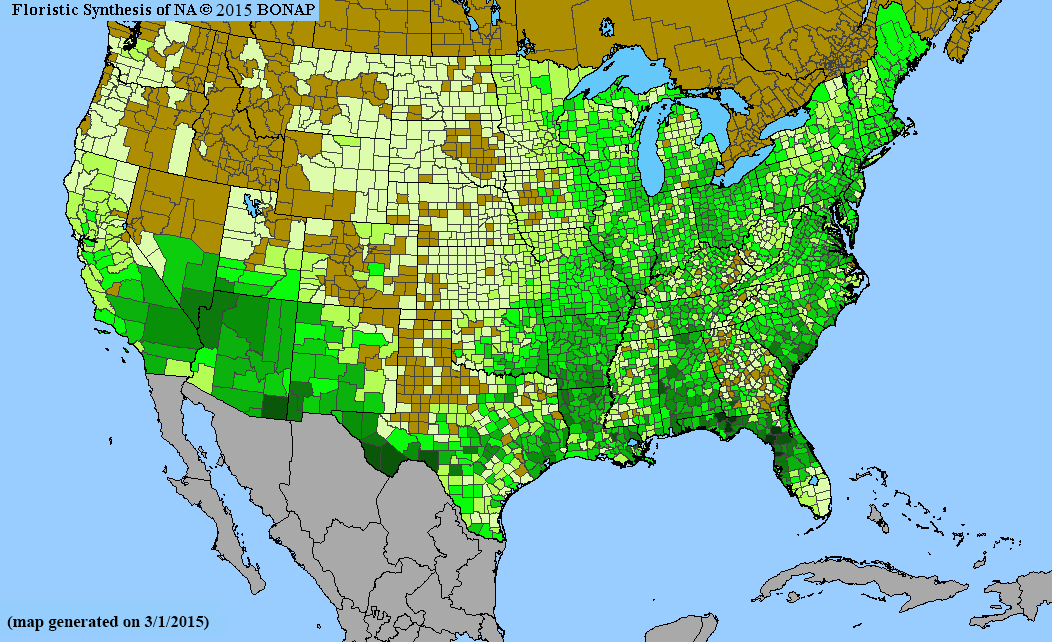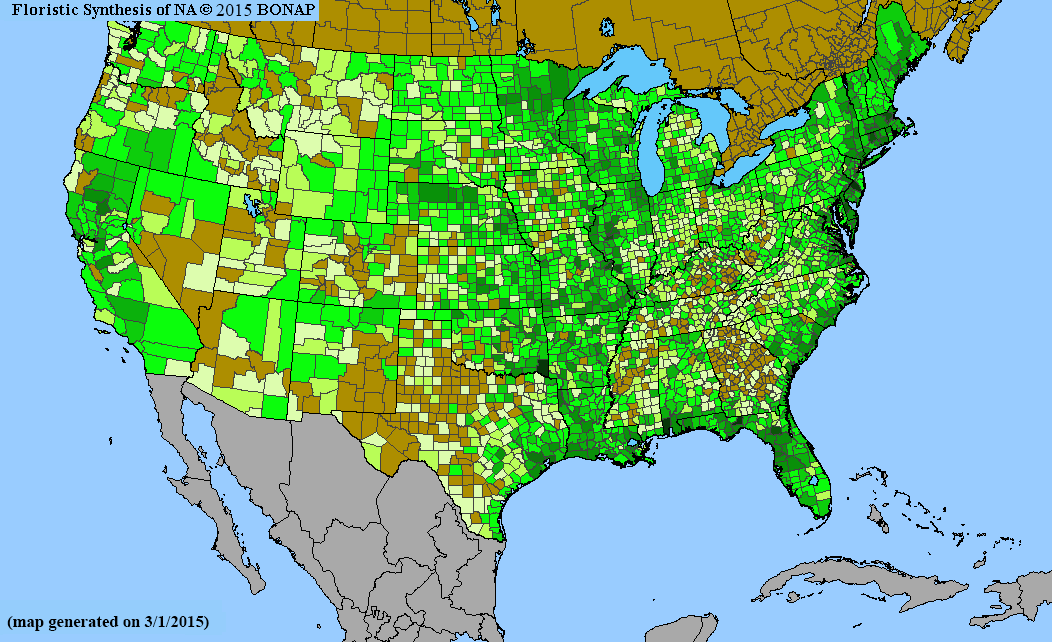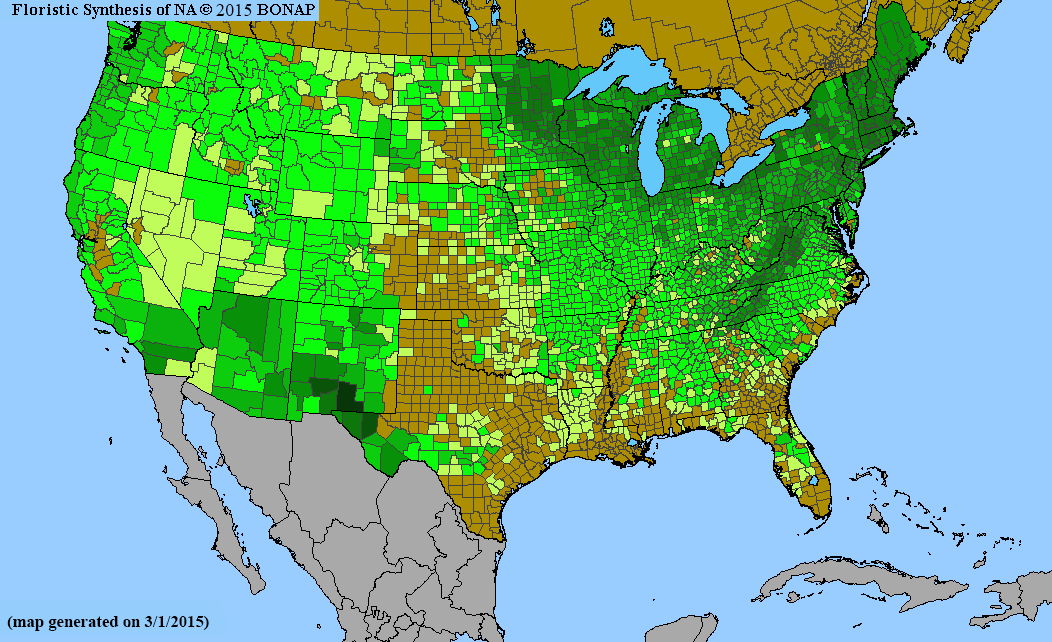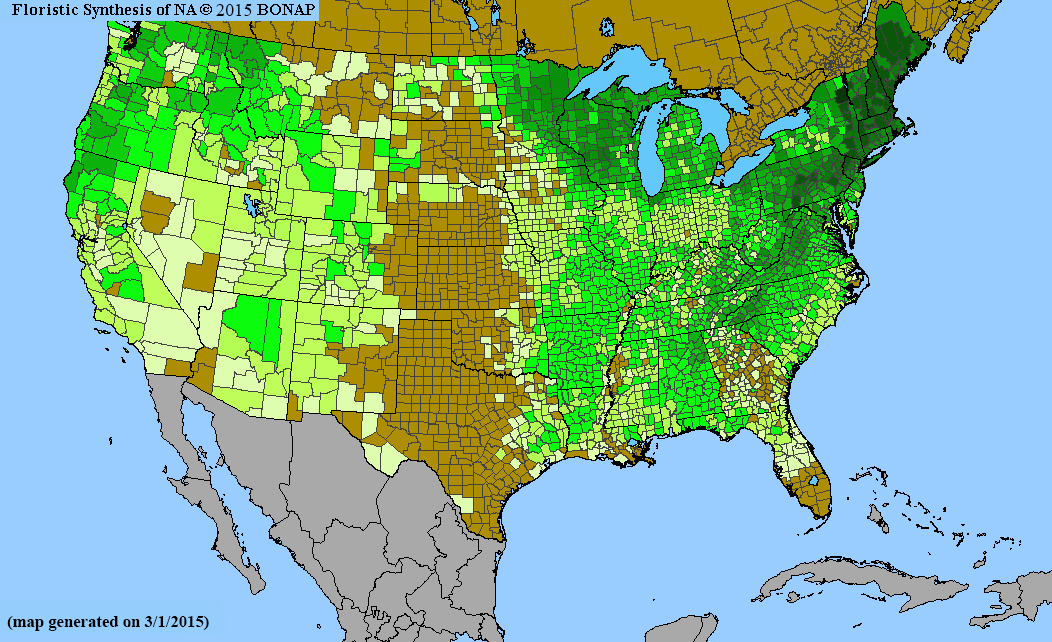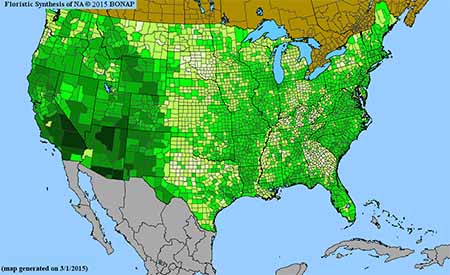
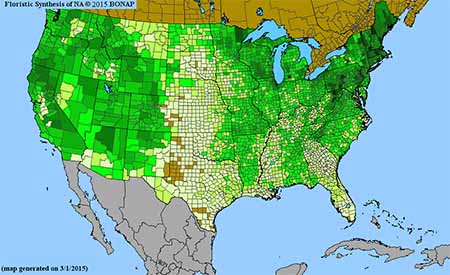
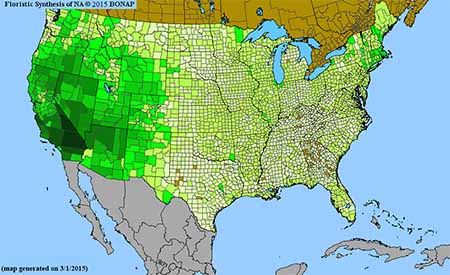
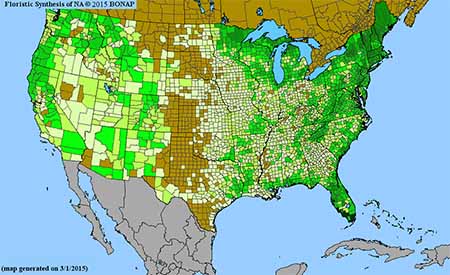
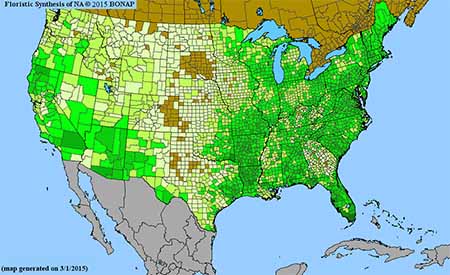
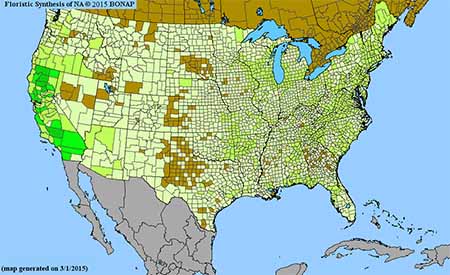
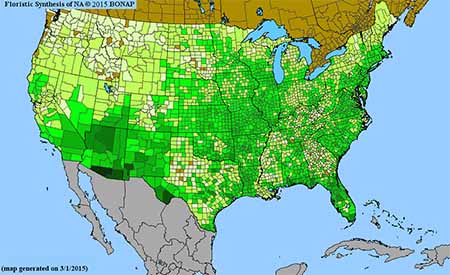
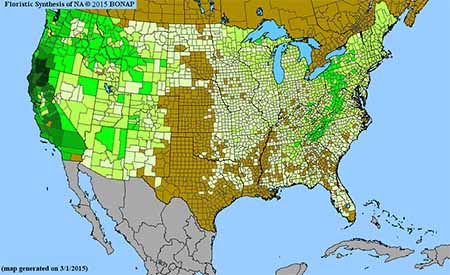
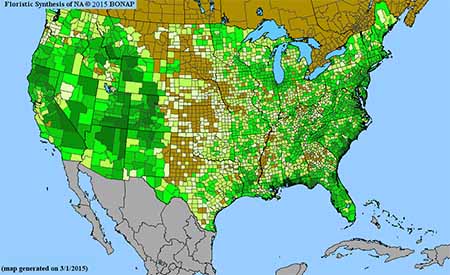
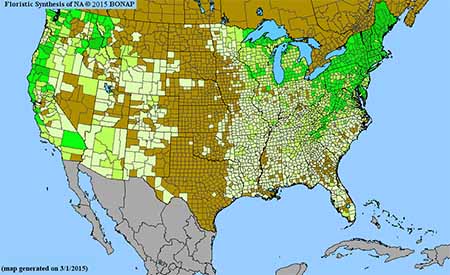
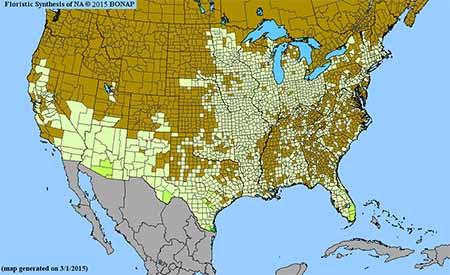
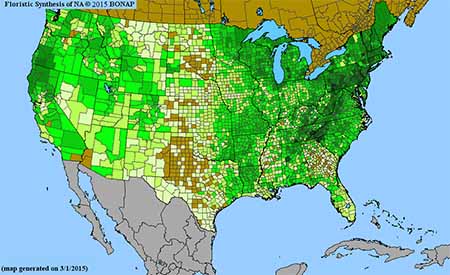
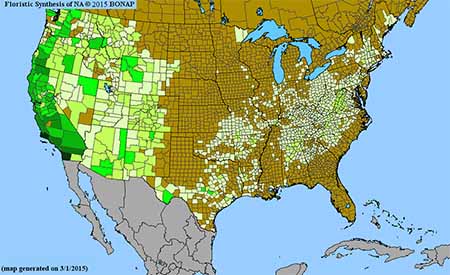
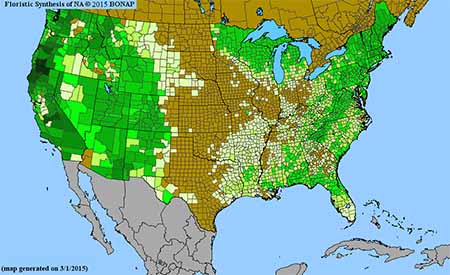
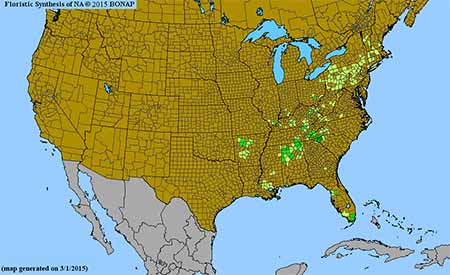
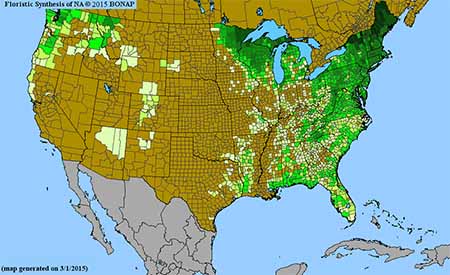
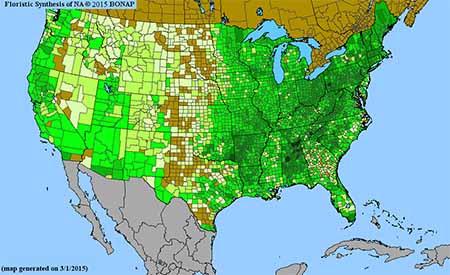
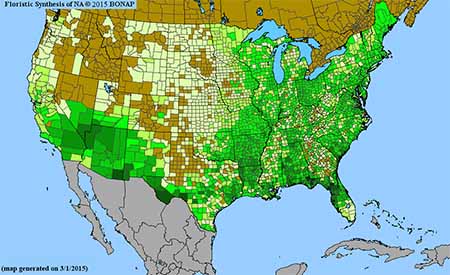
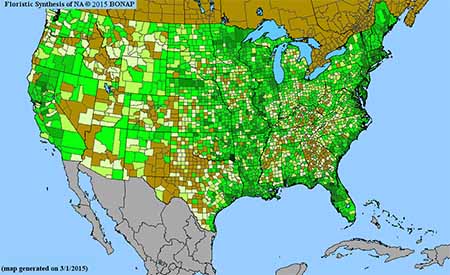
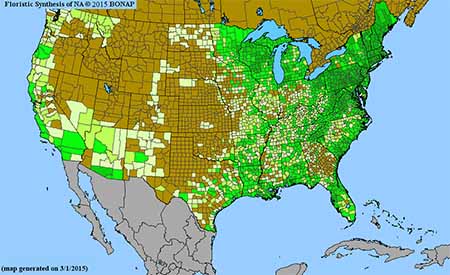
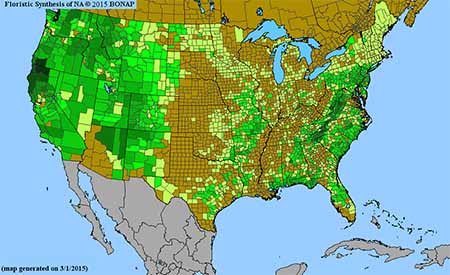
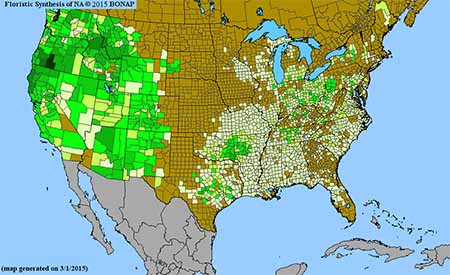
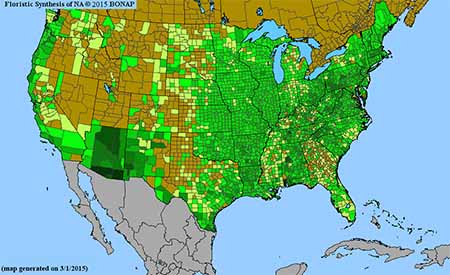
Density gradient of native species for ASTERACEAE. Darkest green (333 spp. Coconino County, AZ) indicates the highest species concentration. BONAP©2015 |
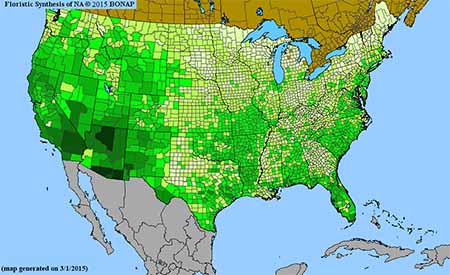
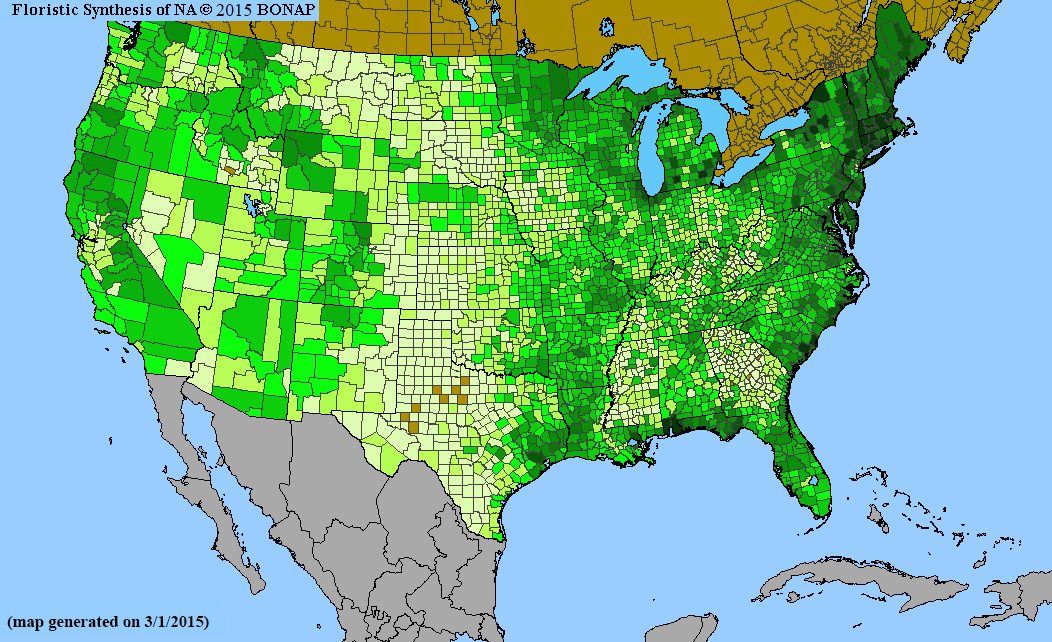
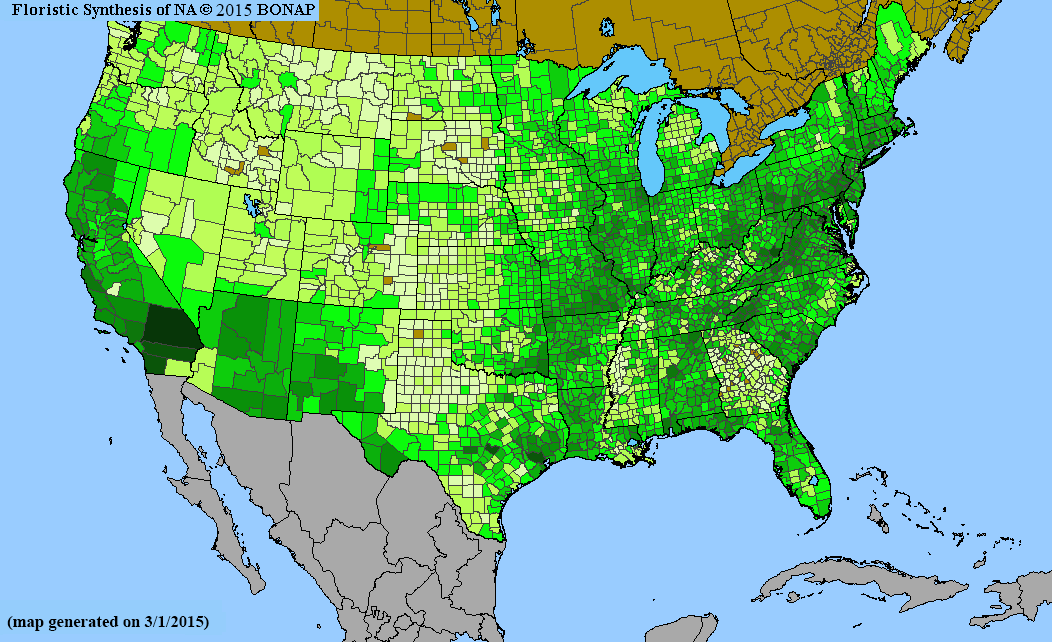
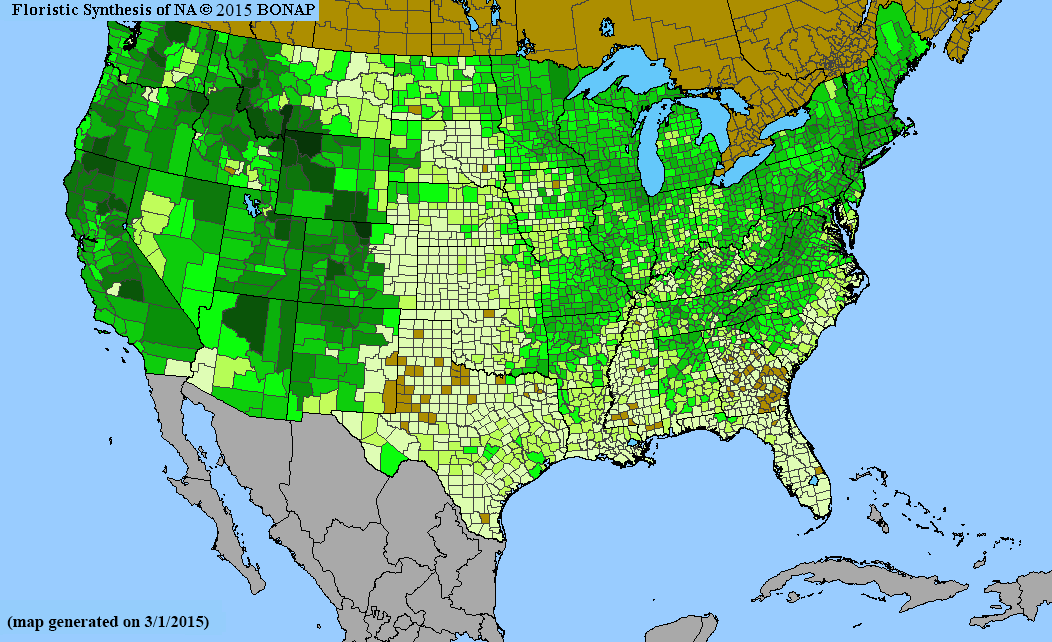
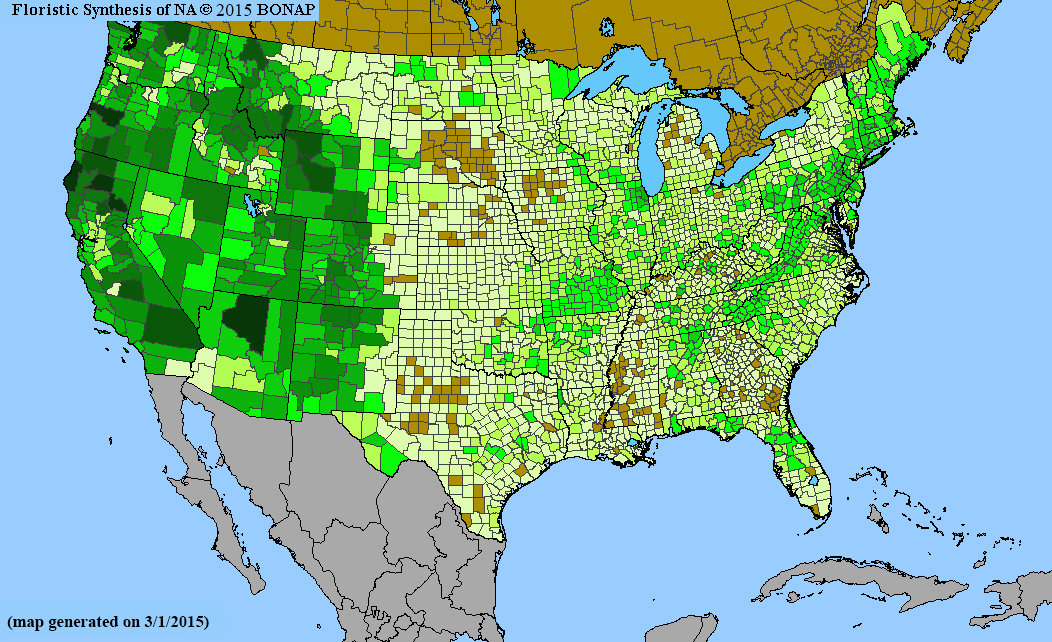
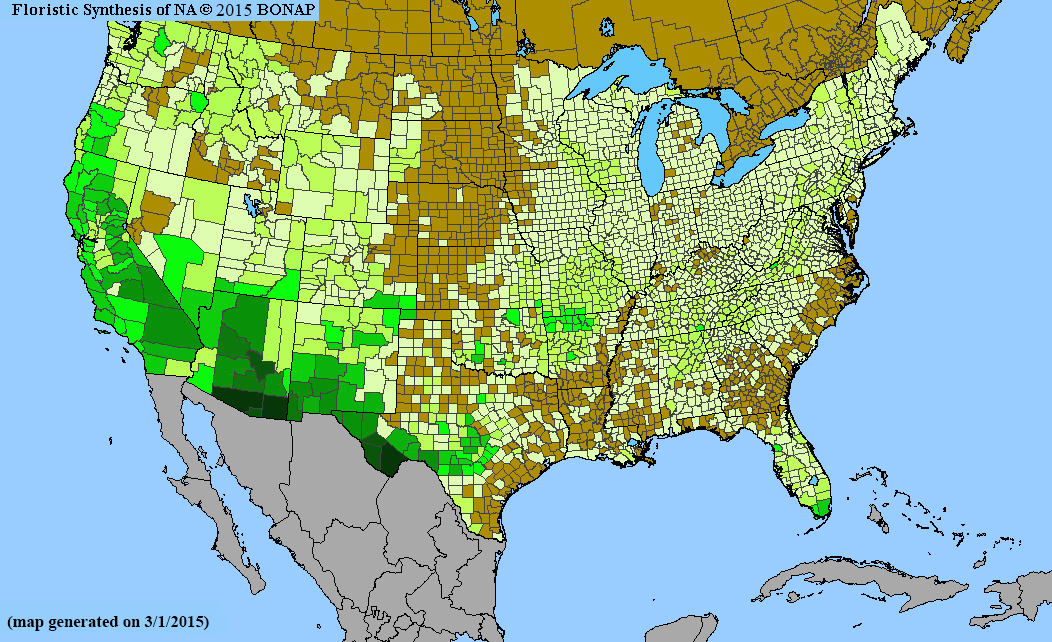
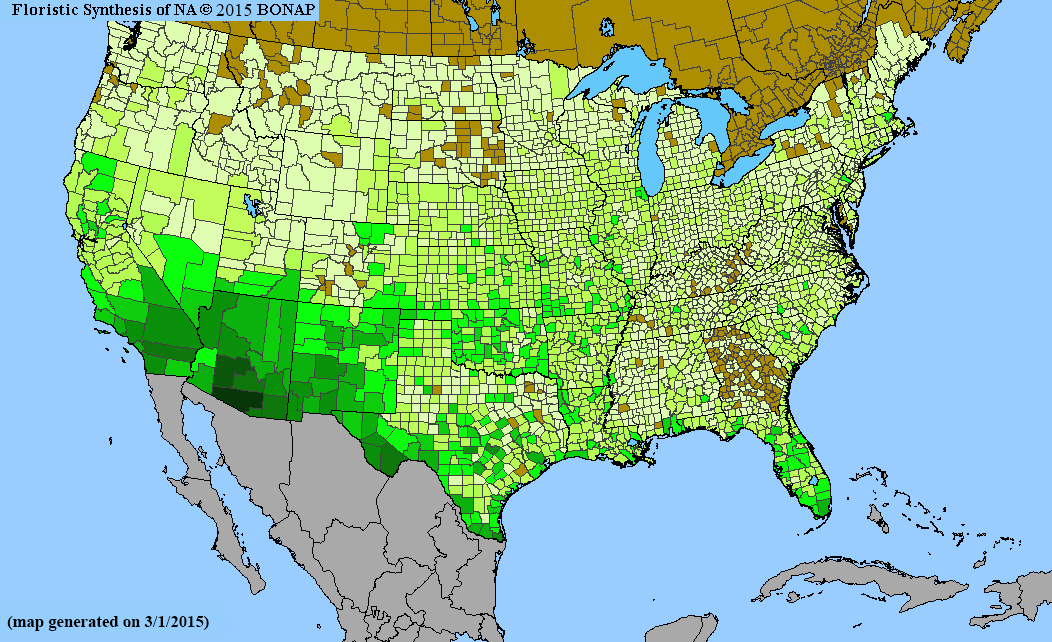
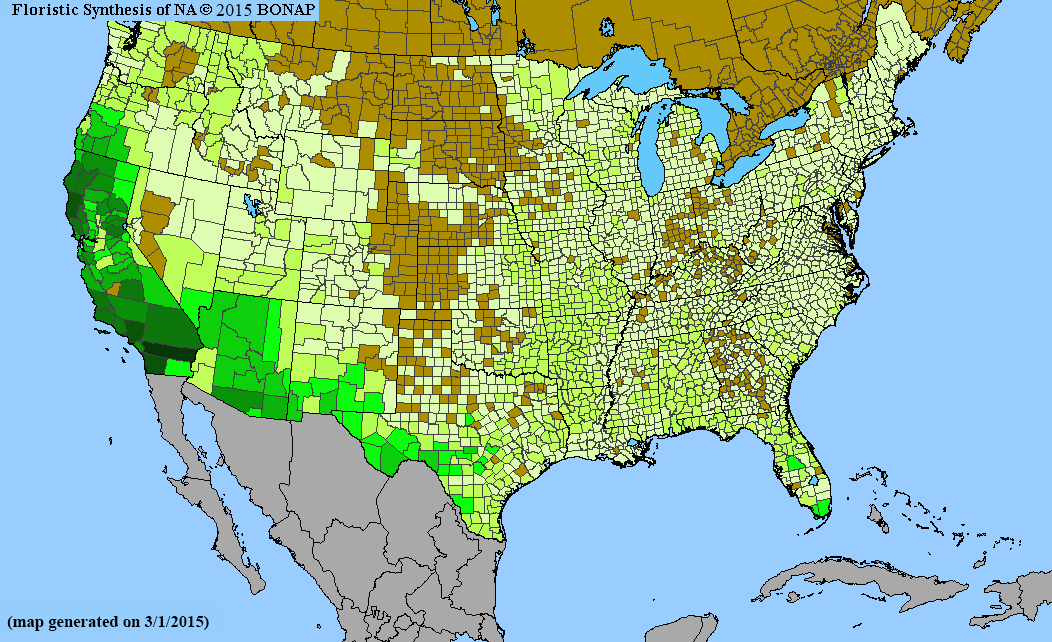
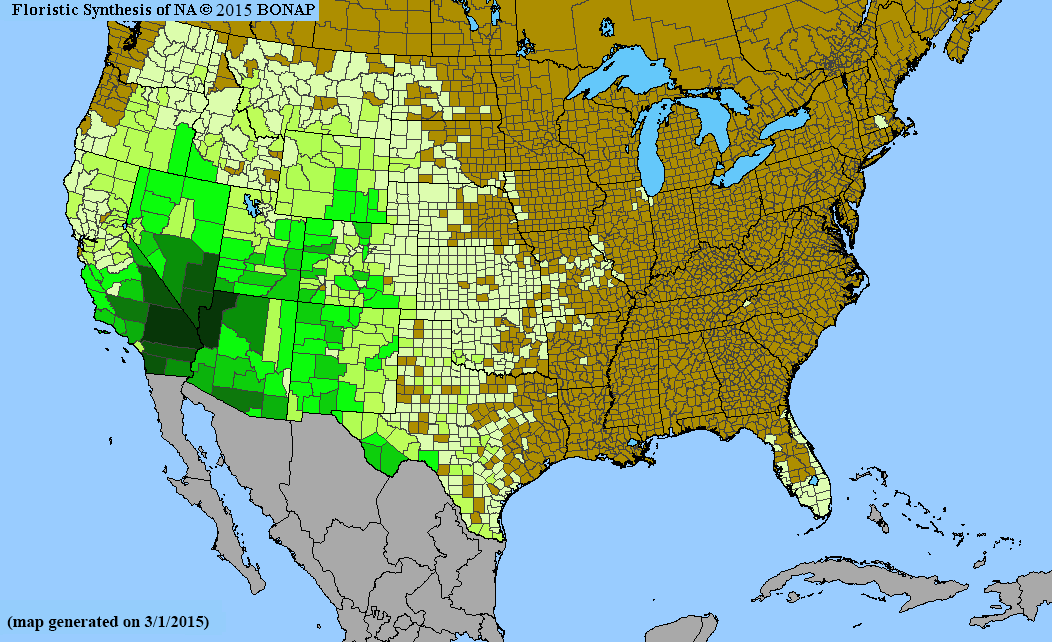
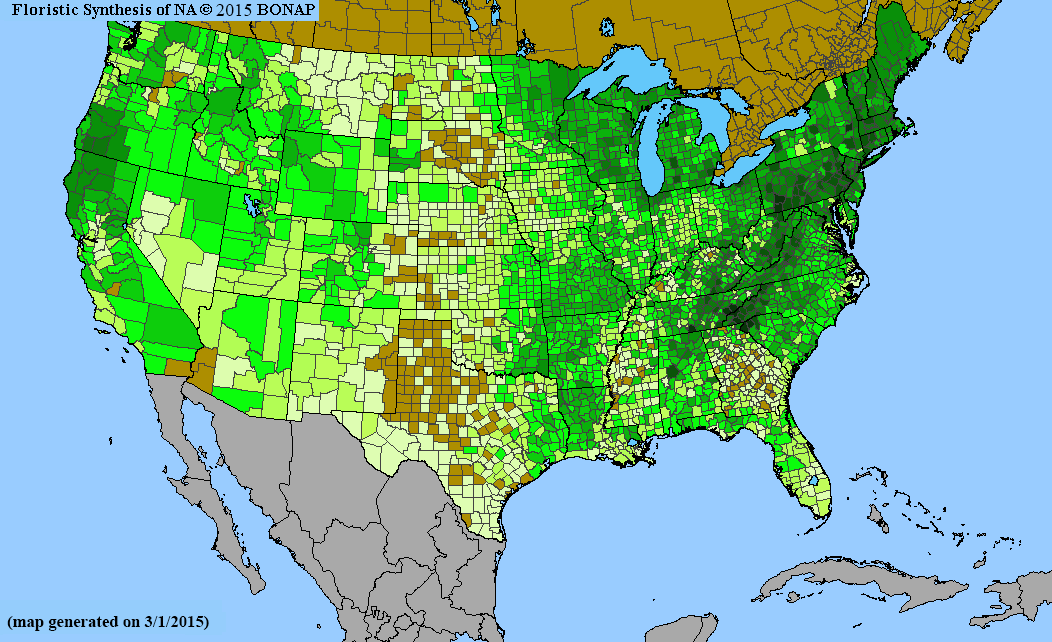
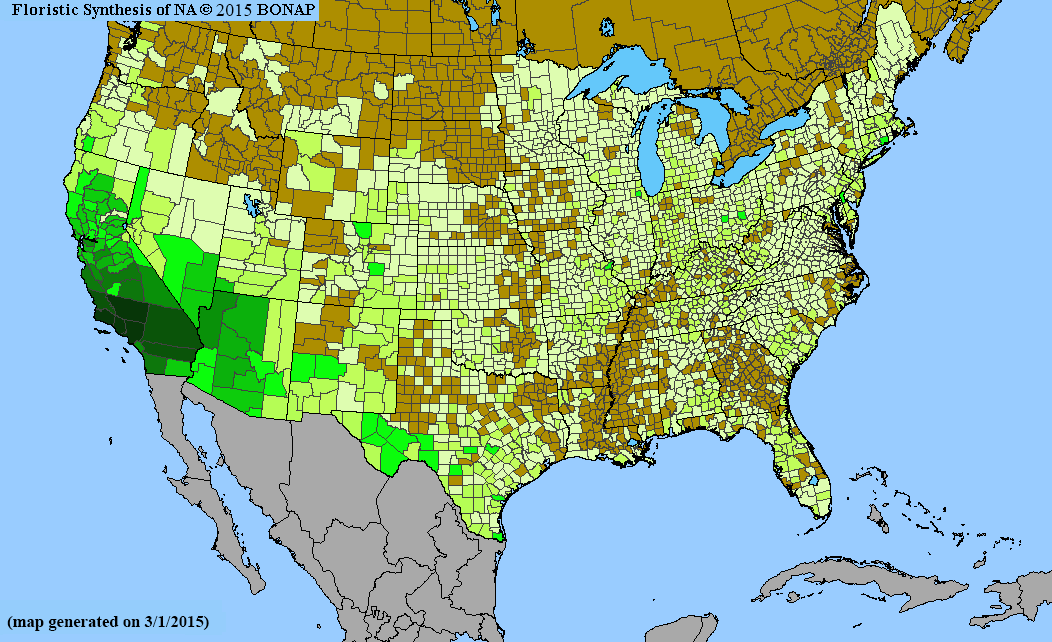
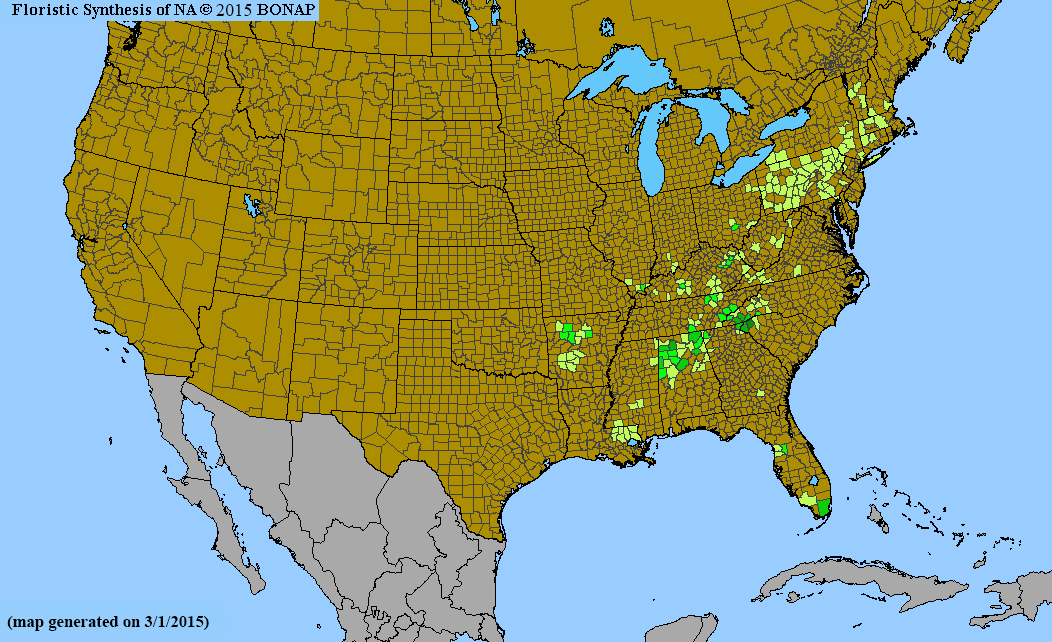
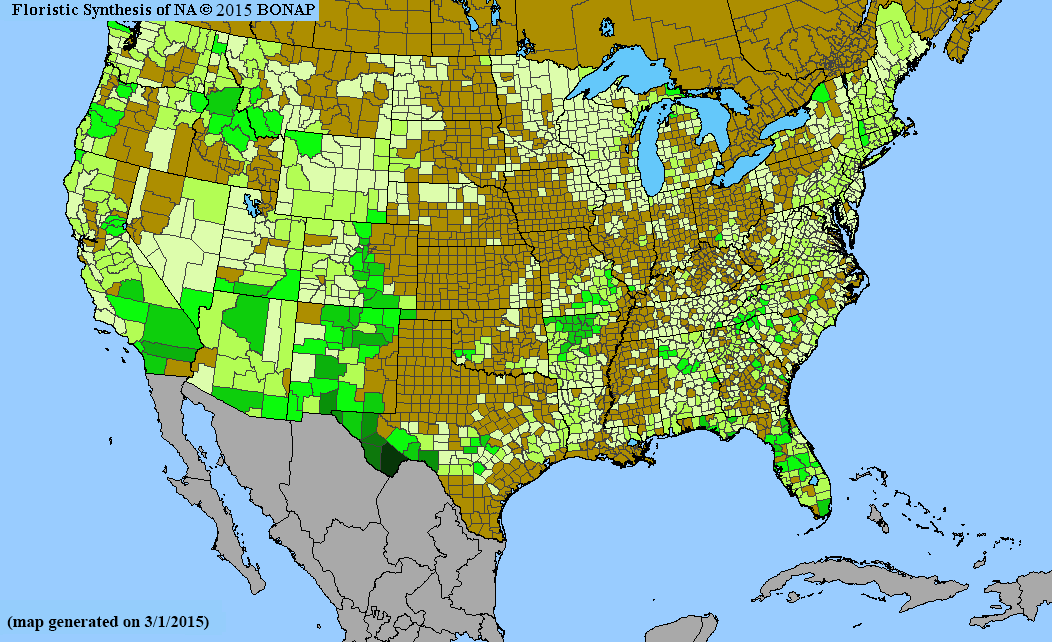
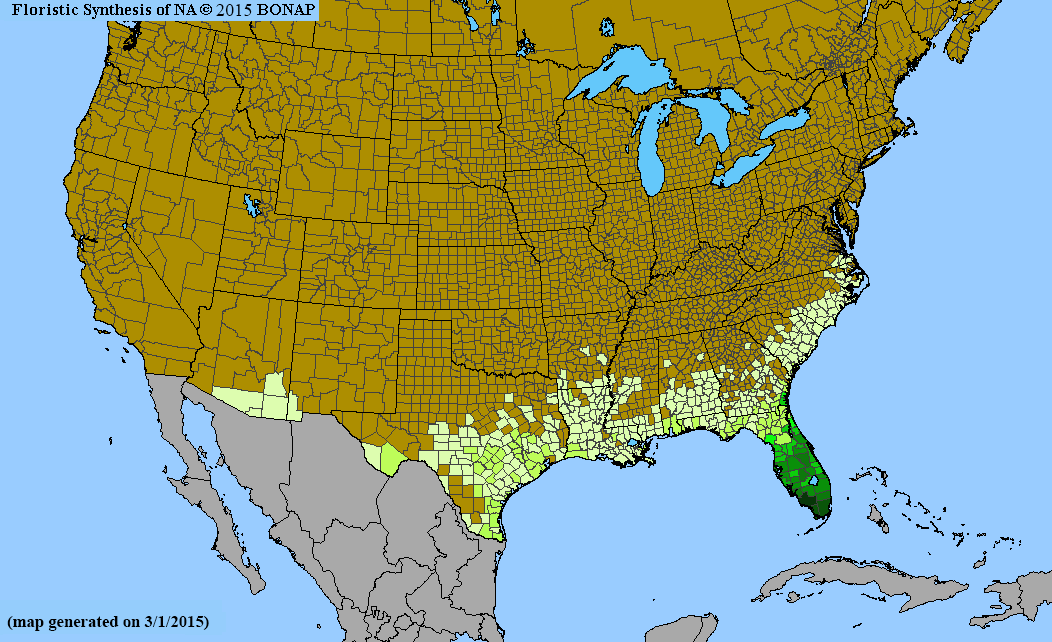
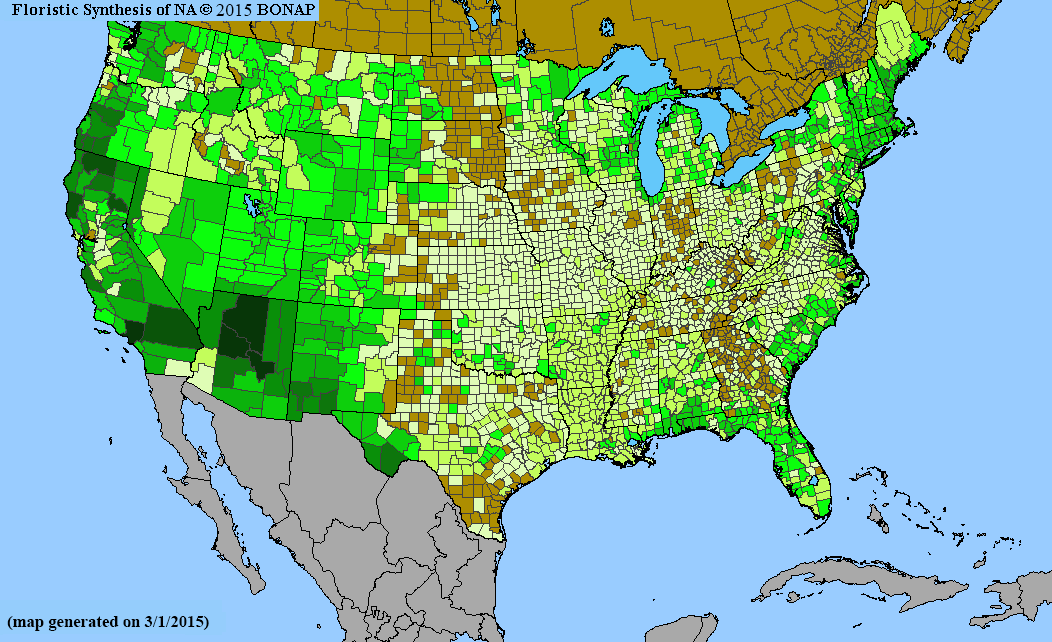
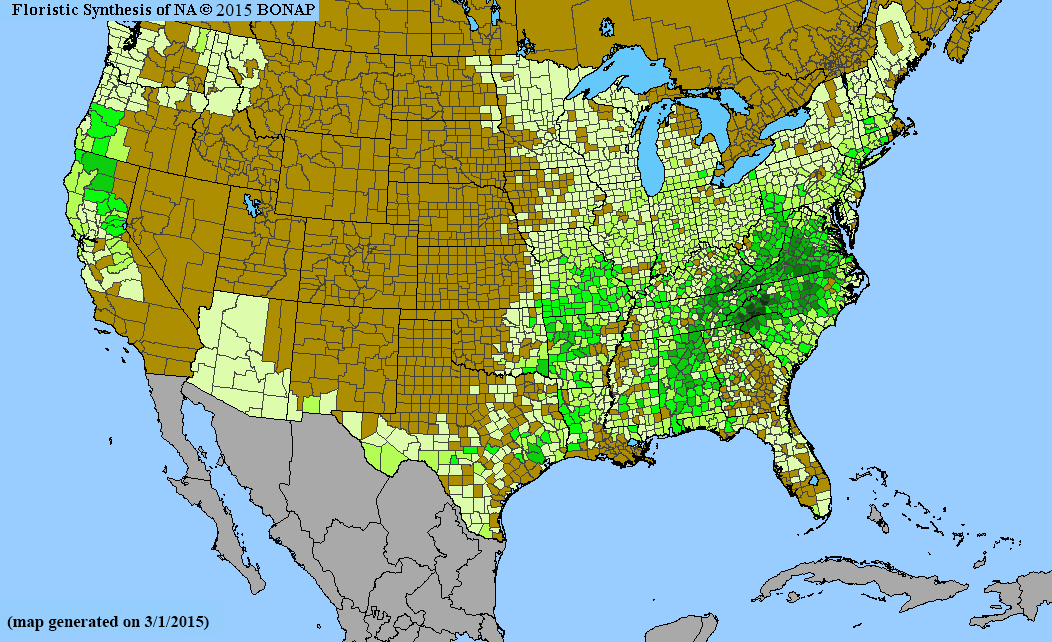
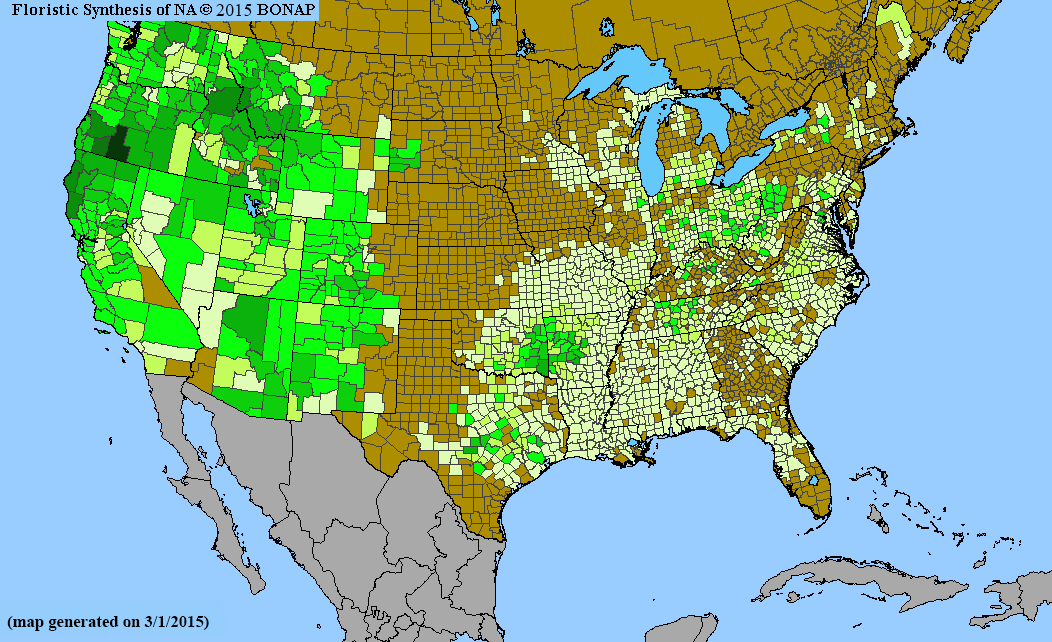
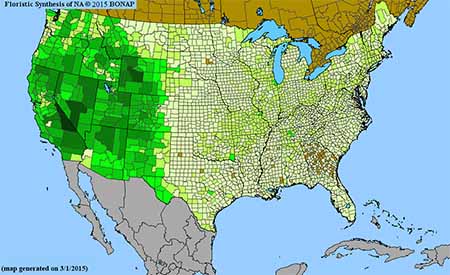
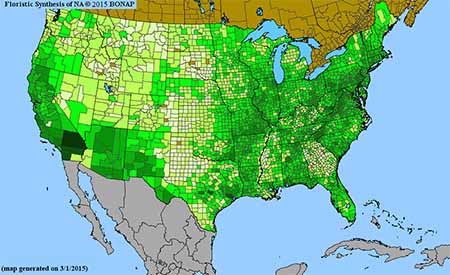
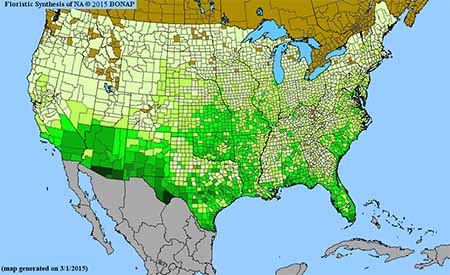
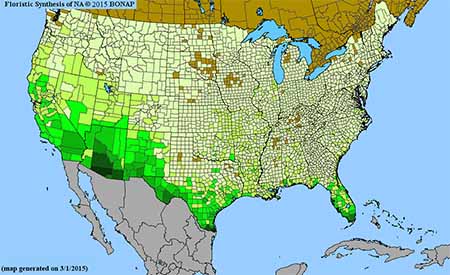
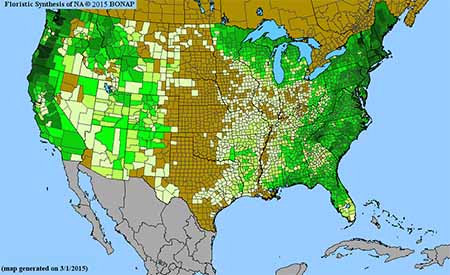
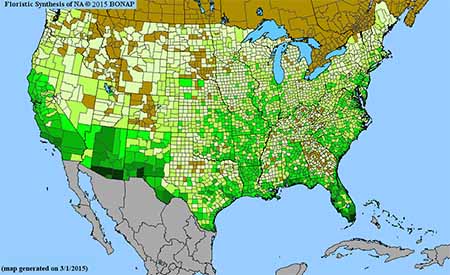
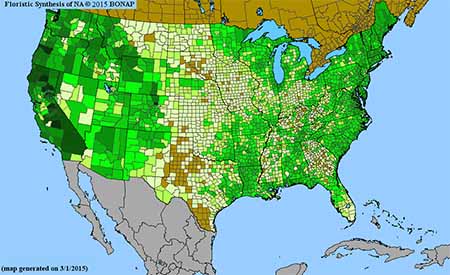
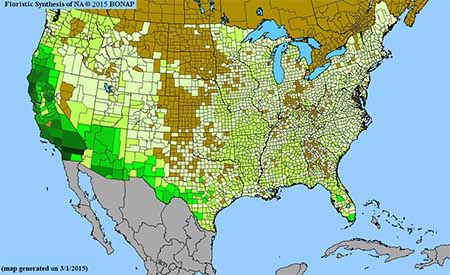
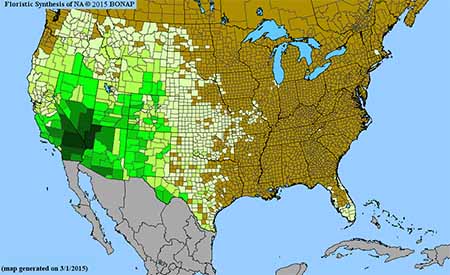
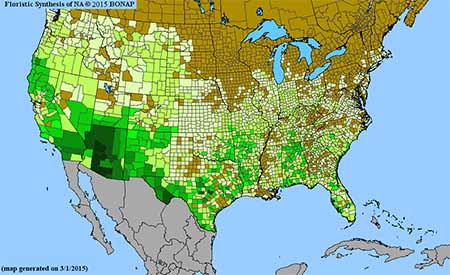
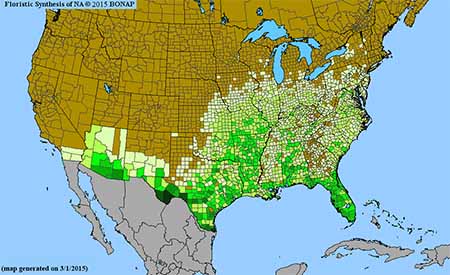
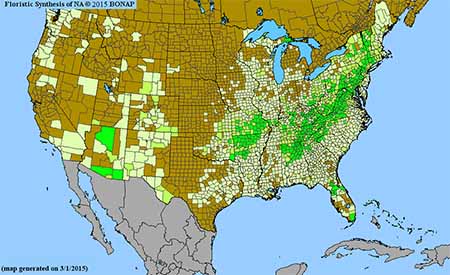
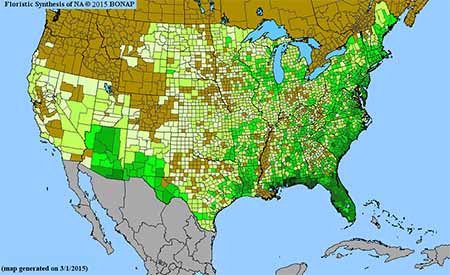
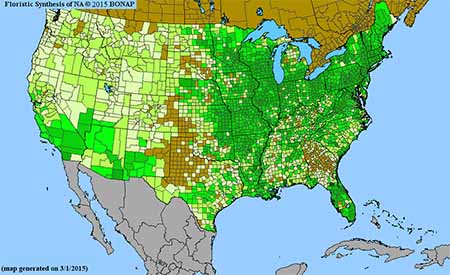
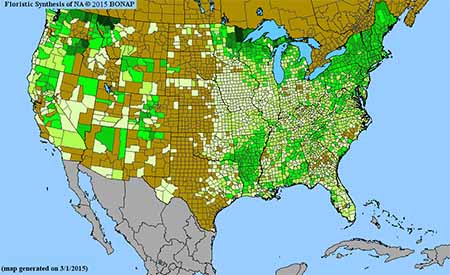
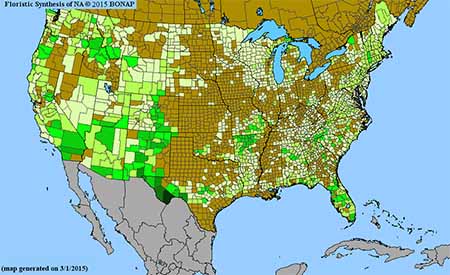
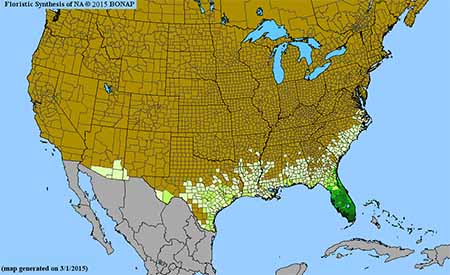
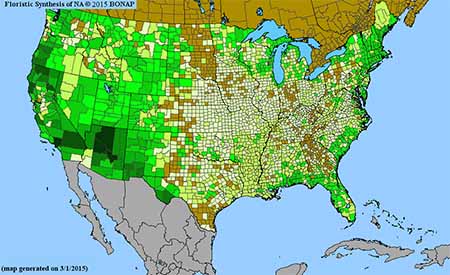
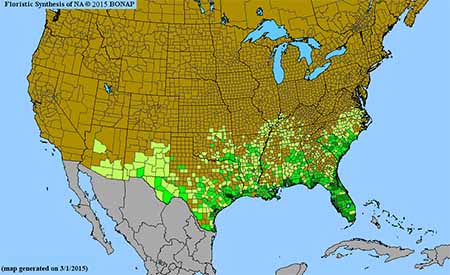
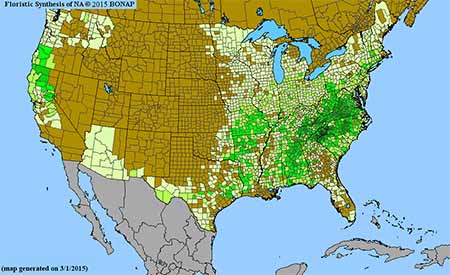
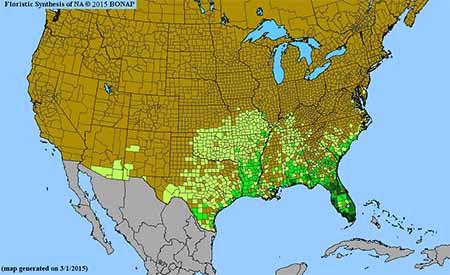
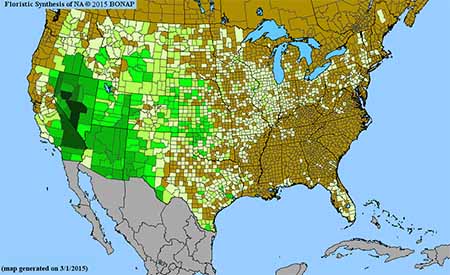
Density gradient of native species for FABACEAE. Darkest green (157 spp. Coconino County, AZ) indicates the highest species concentration. BONAP©2015 |
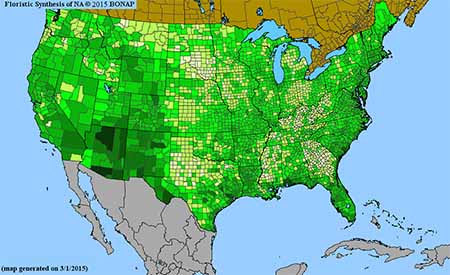
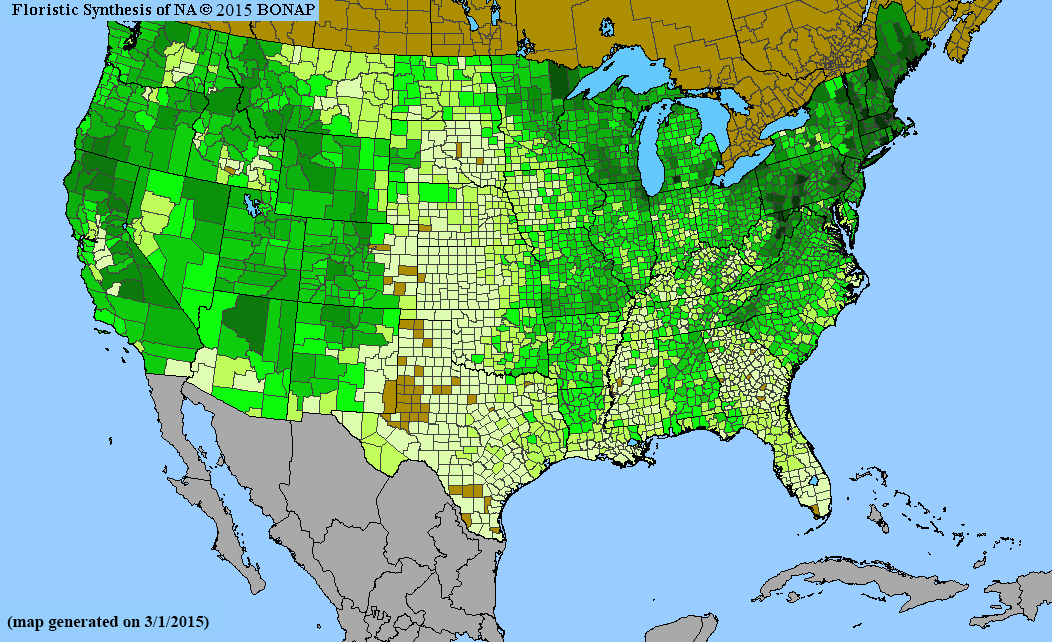
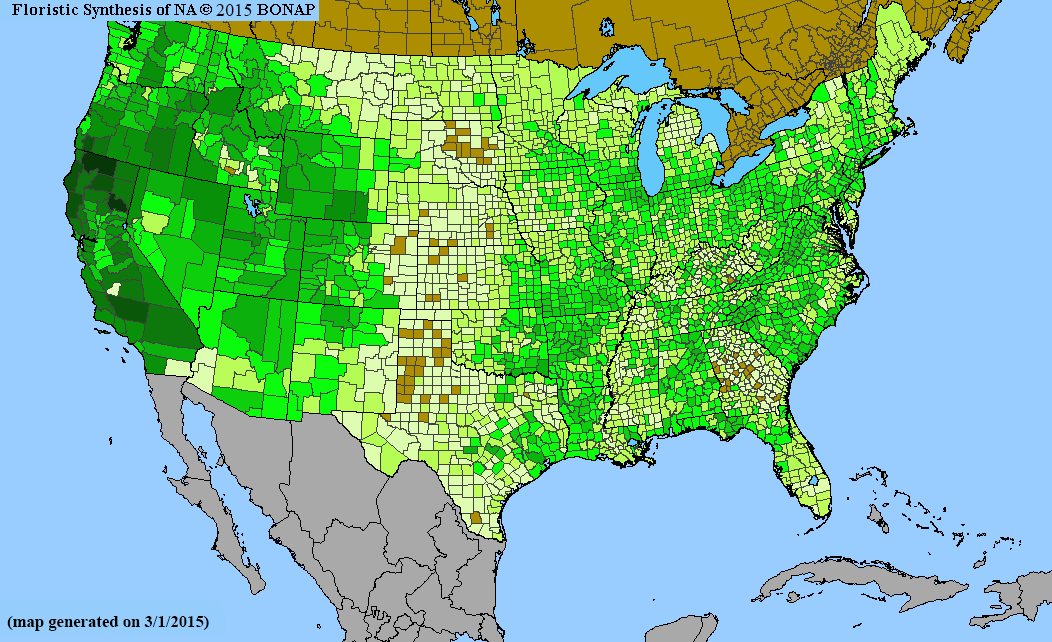
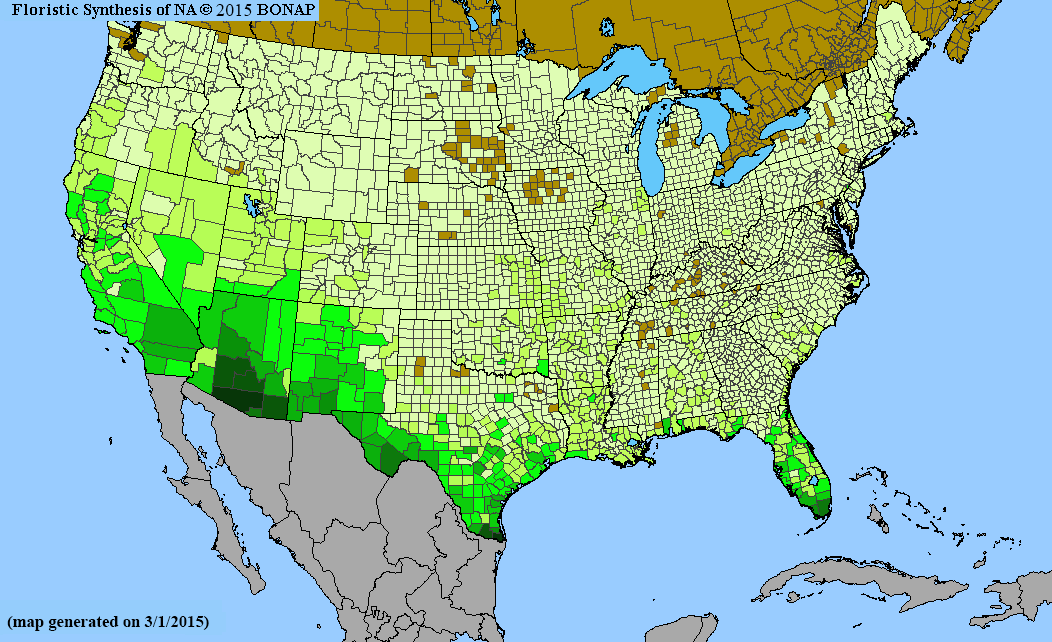
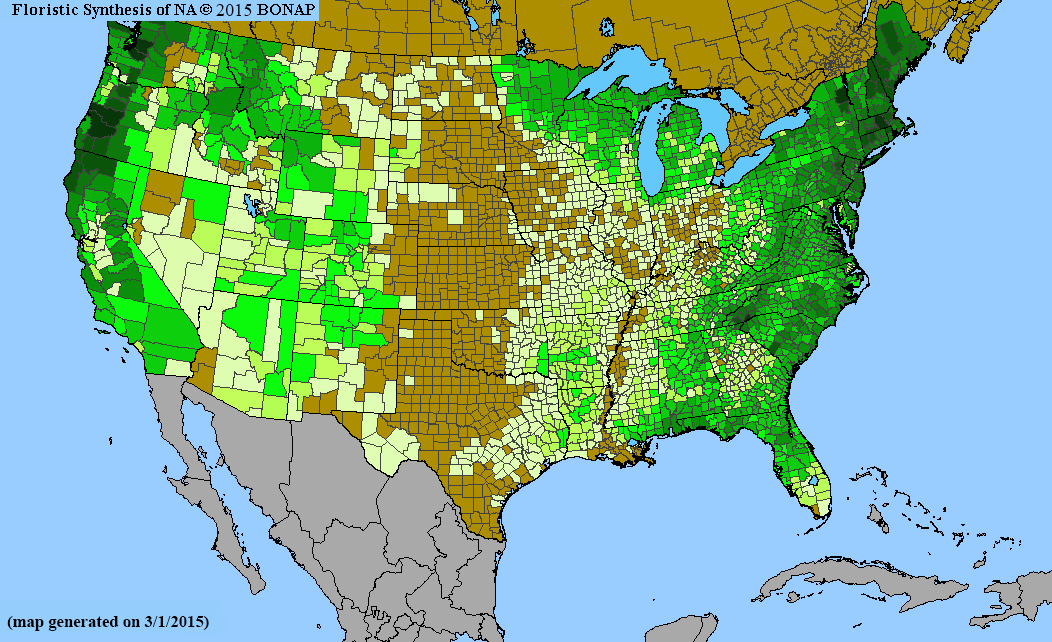
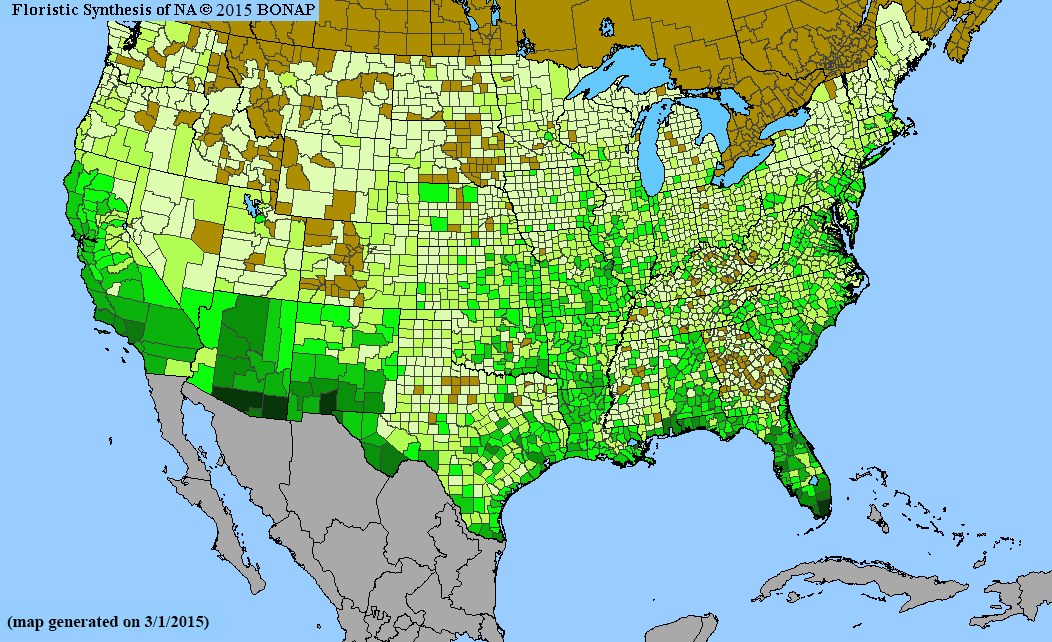
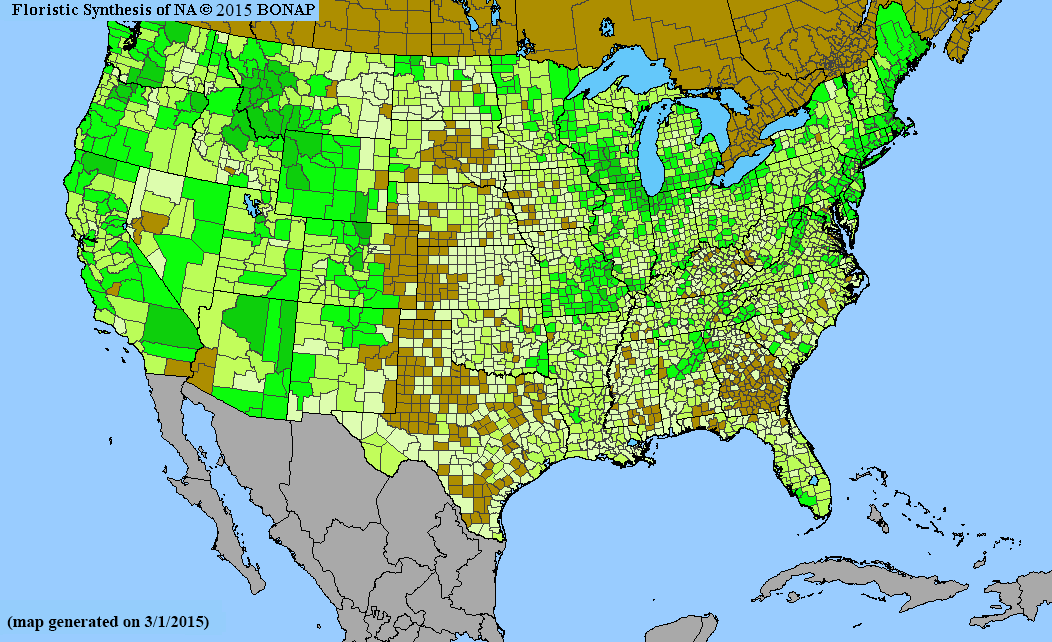
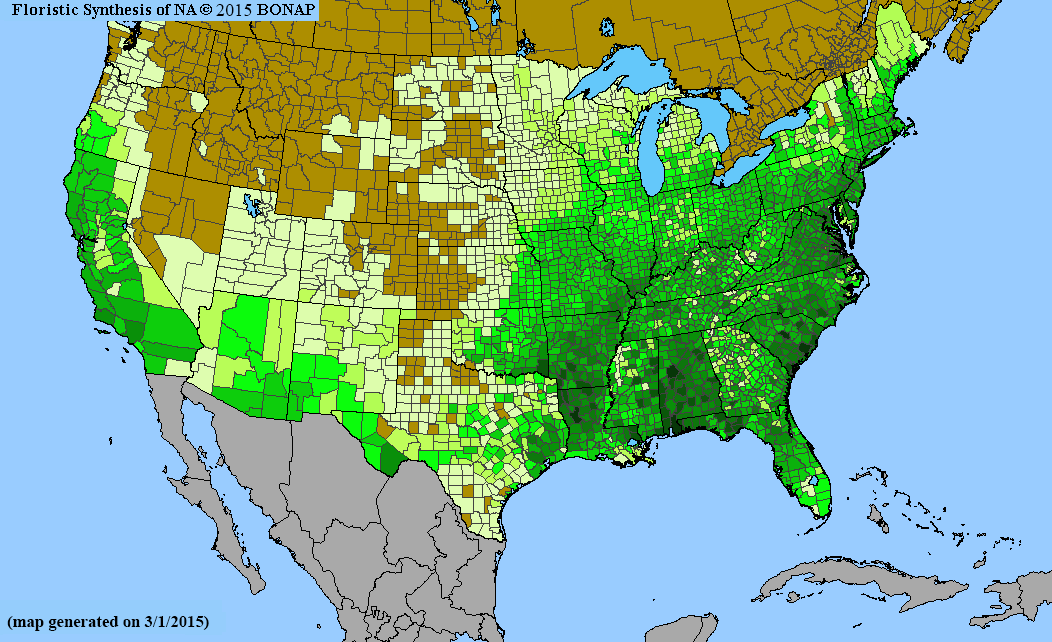
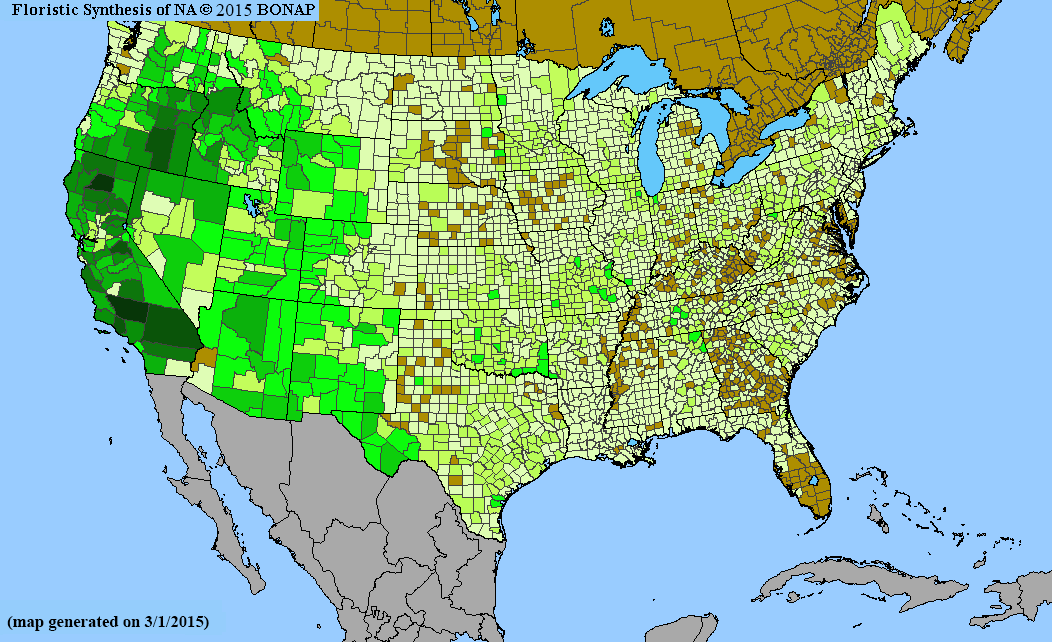
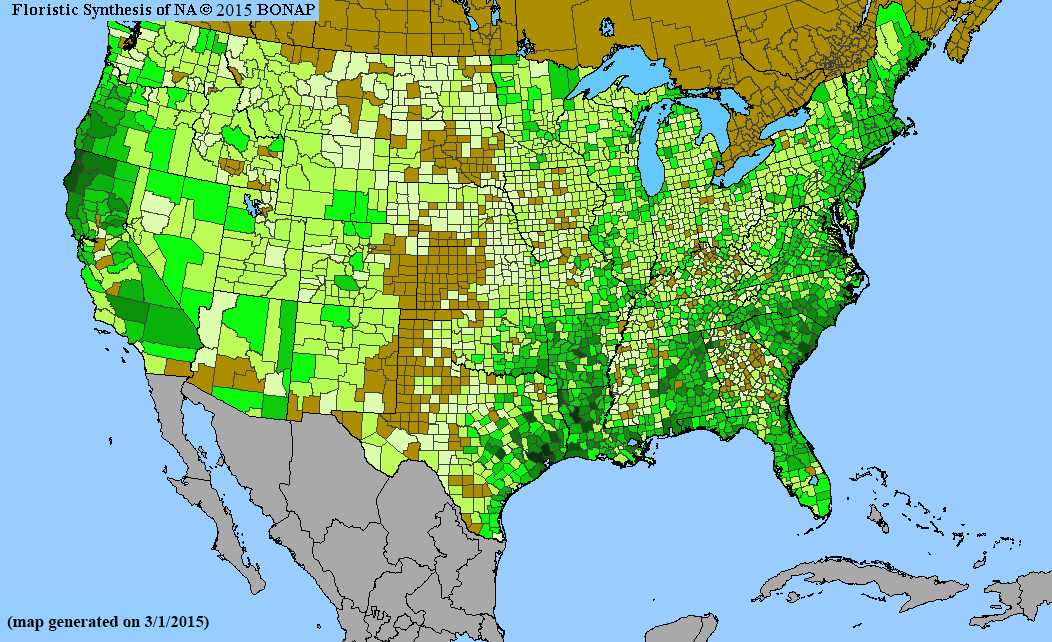
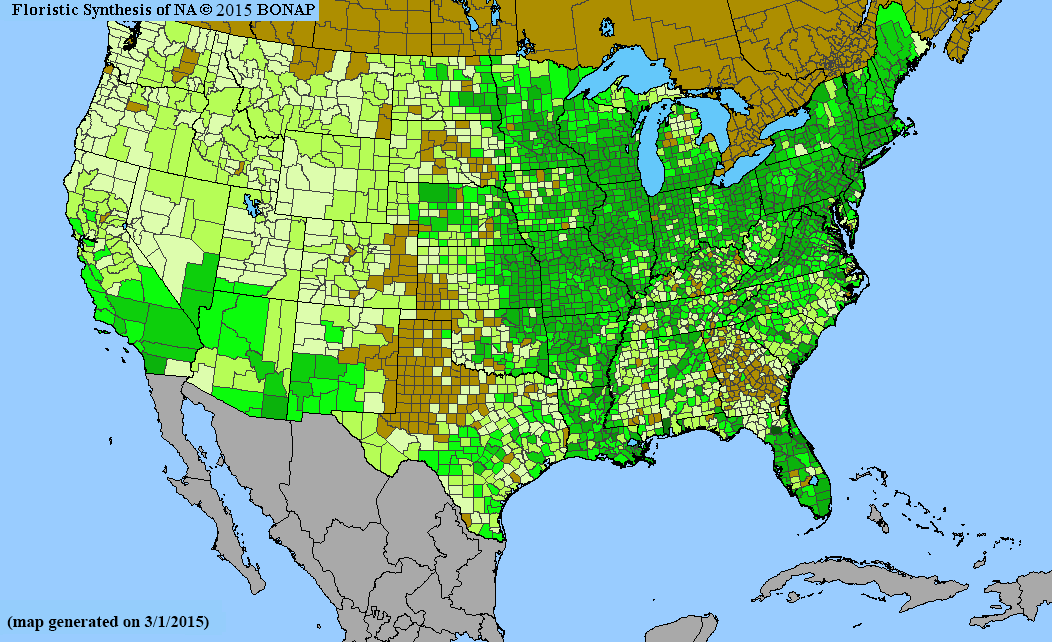
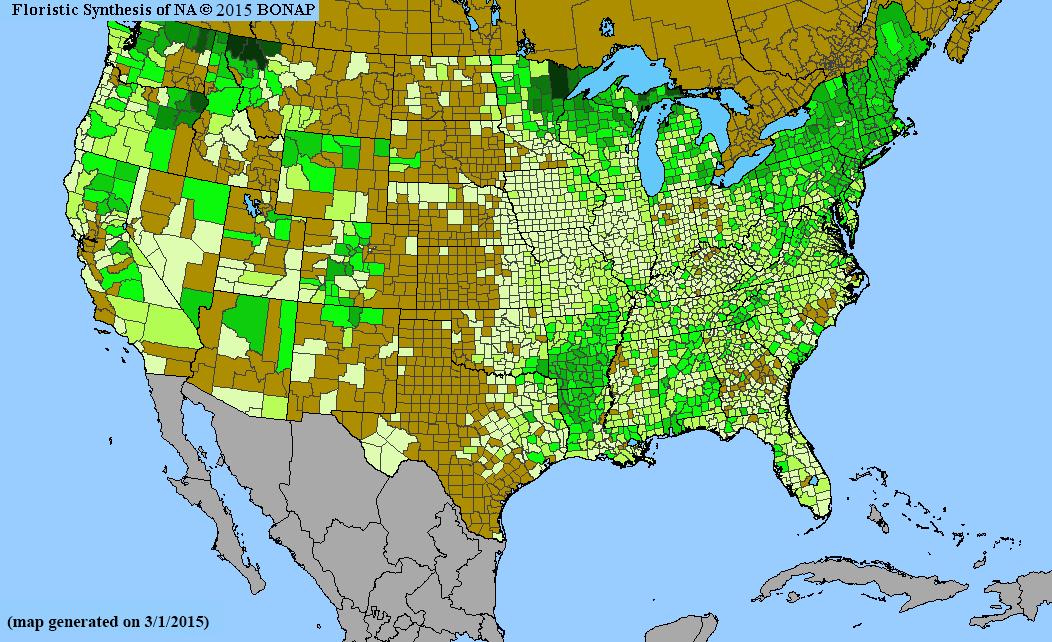
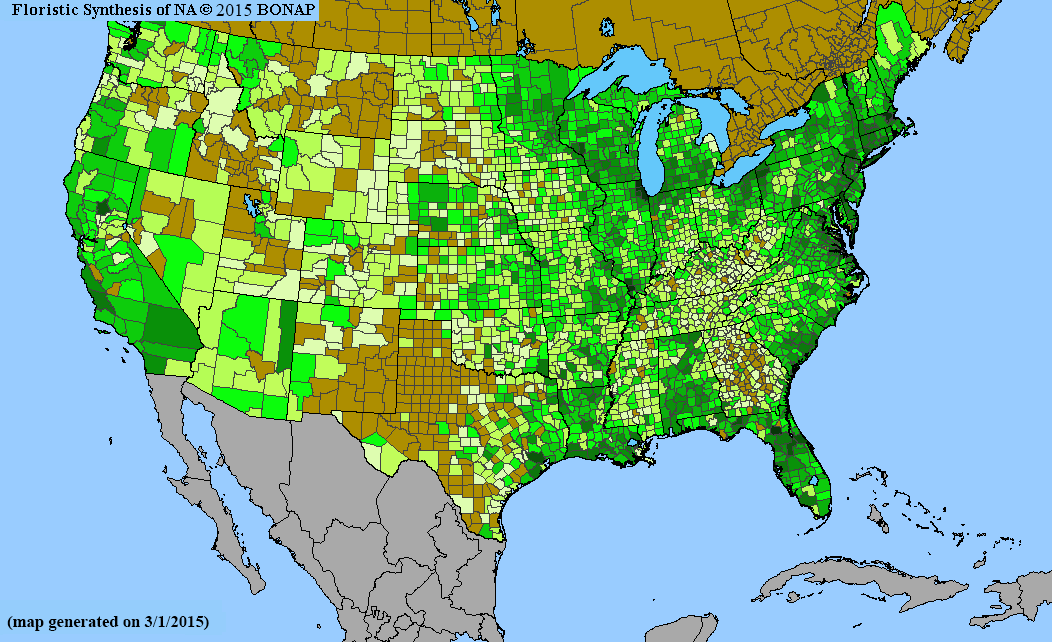
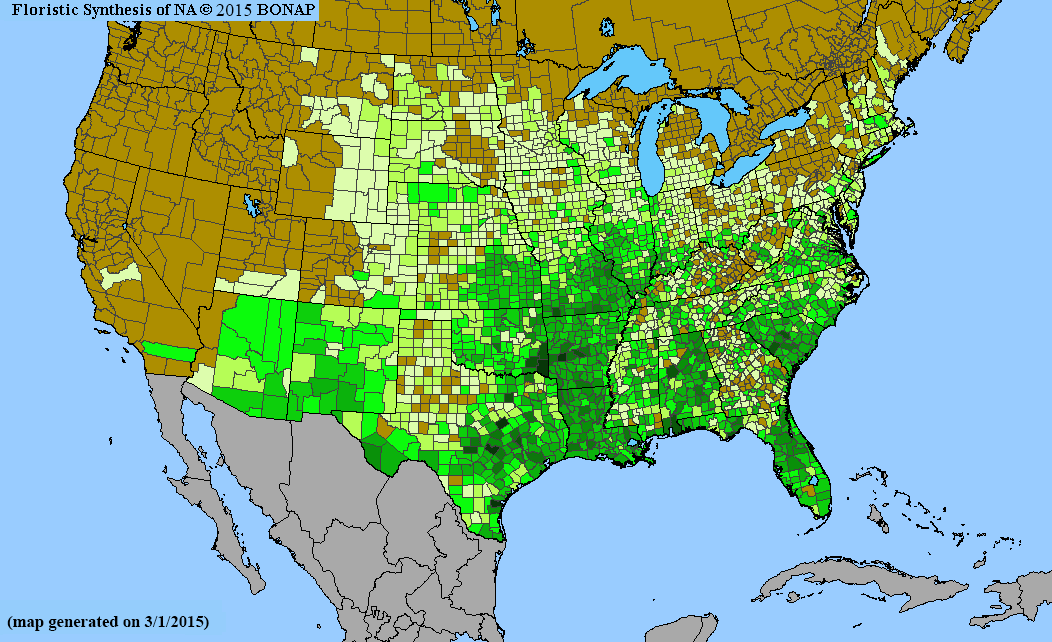
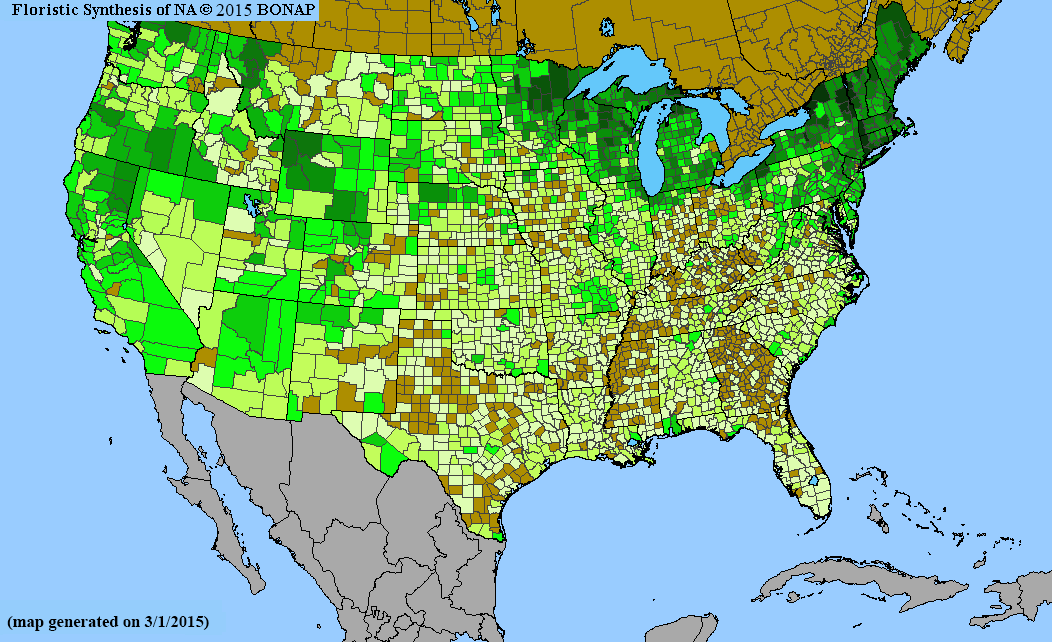
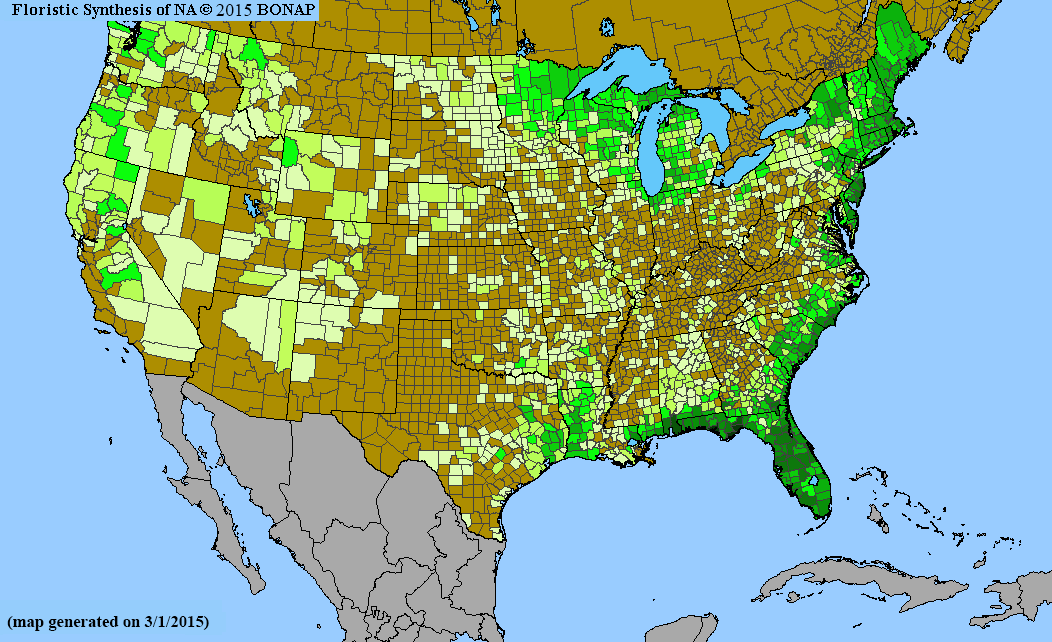
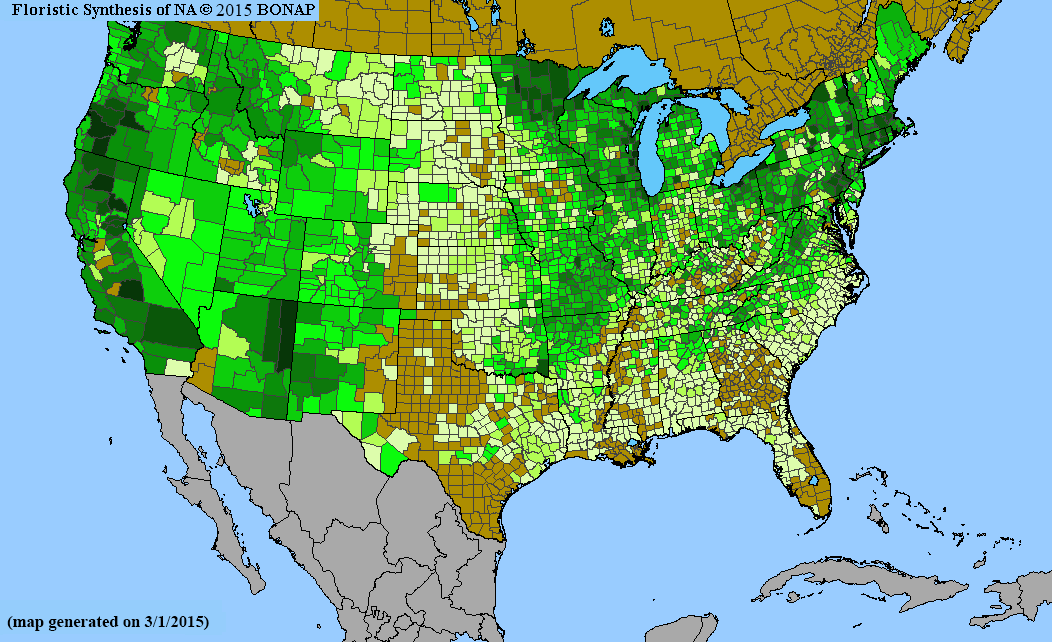
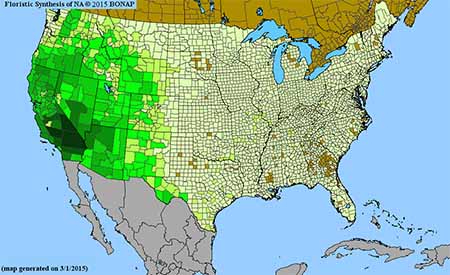
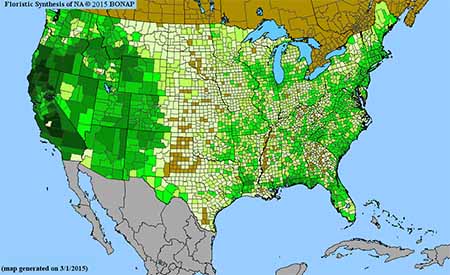
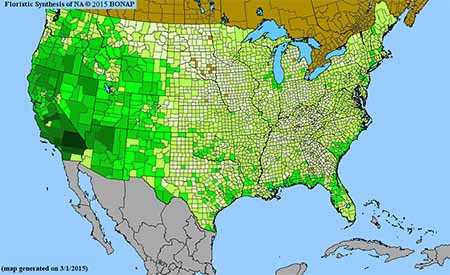
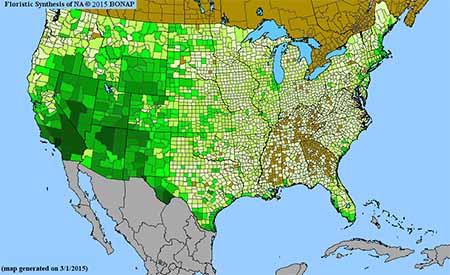
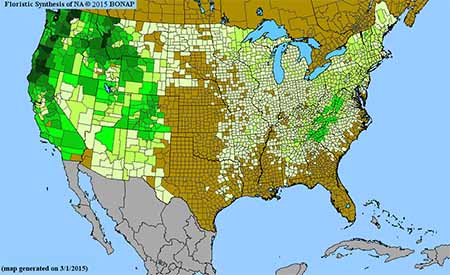
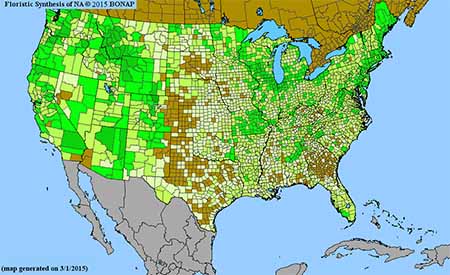
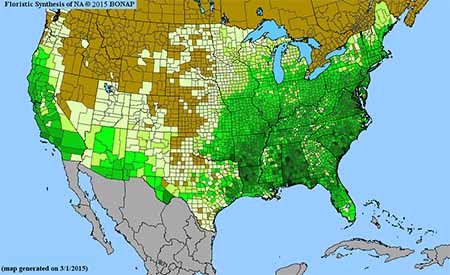
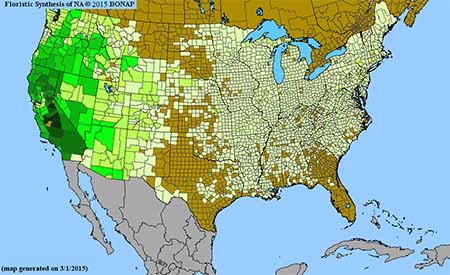
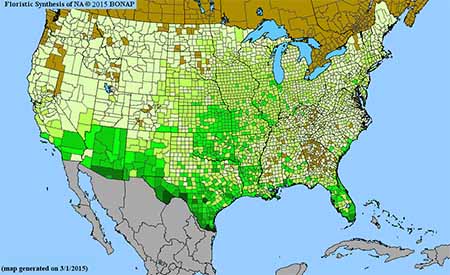
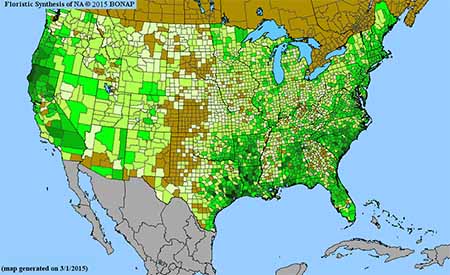
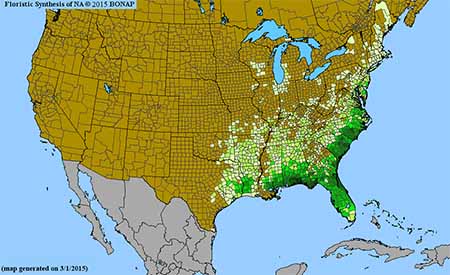
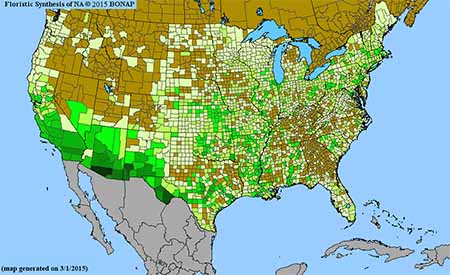
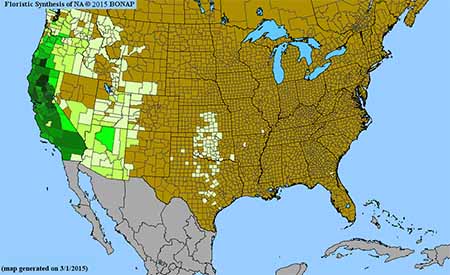
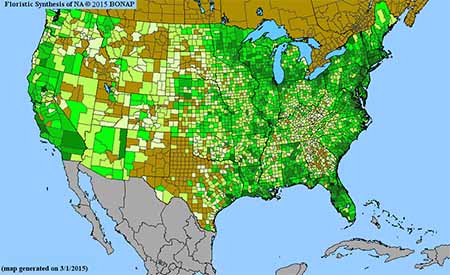
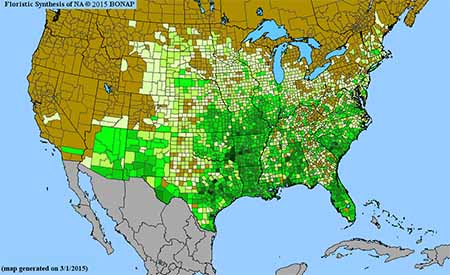
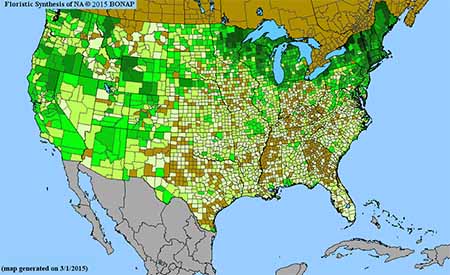
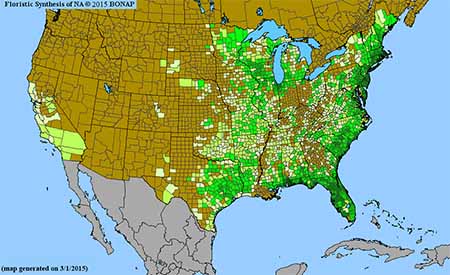
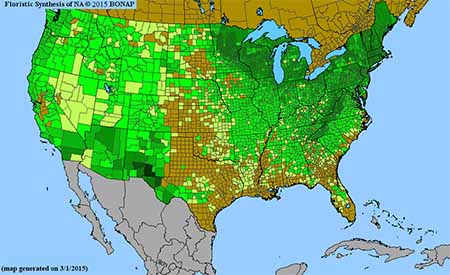
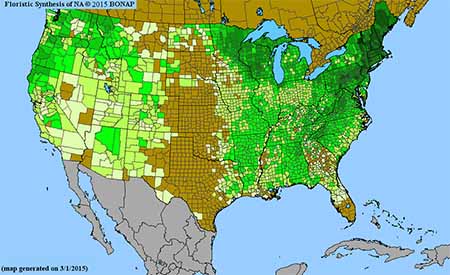
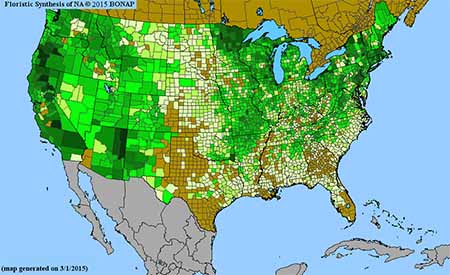
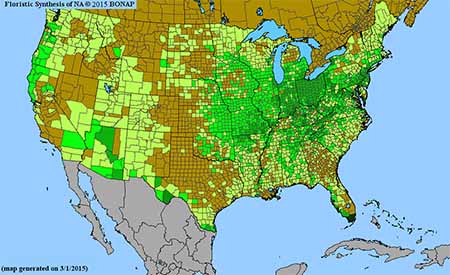
Density gradient of native species for POACEAE. Darkest green (220 spp. Coconino County, AZ) indicates the highest species concentratio. BONAP©2015 |
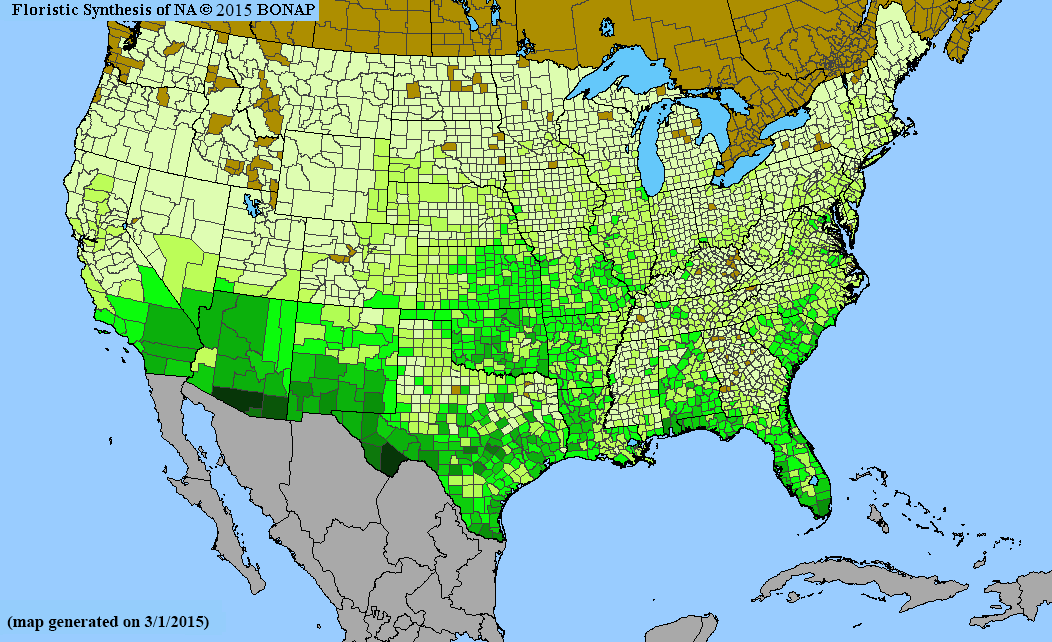
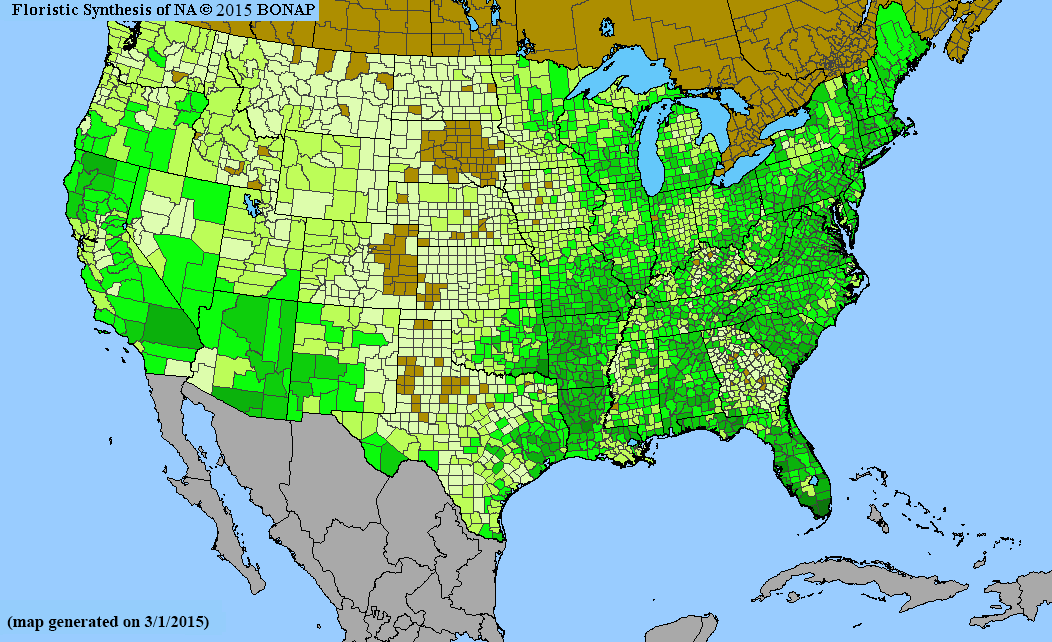
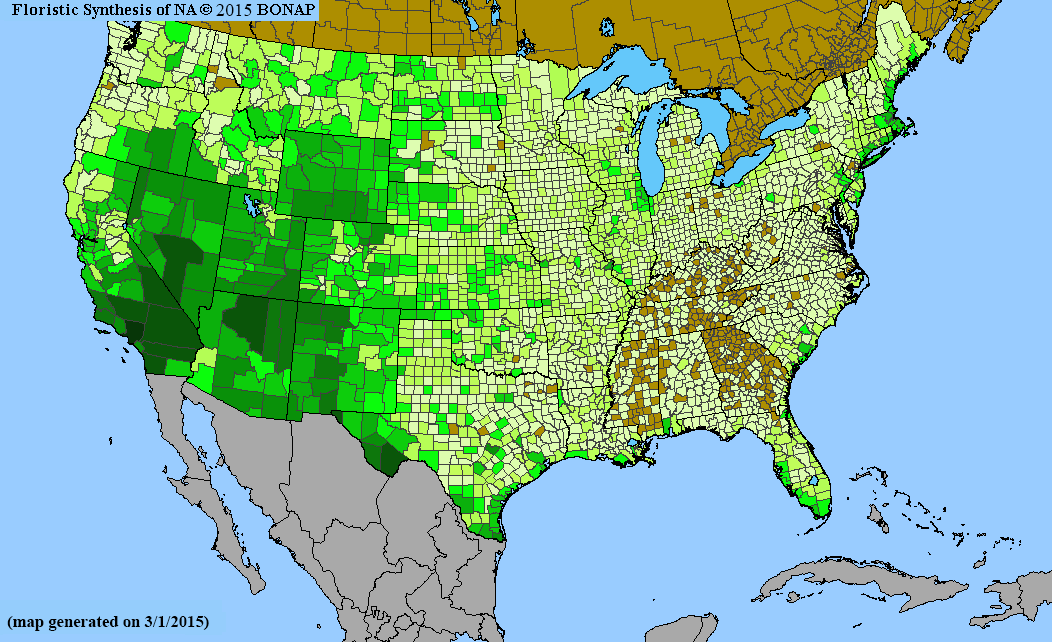
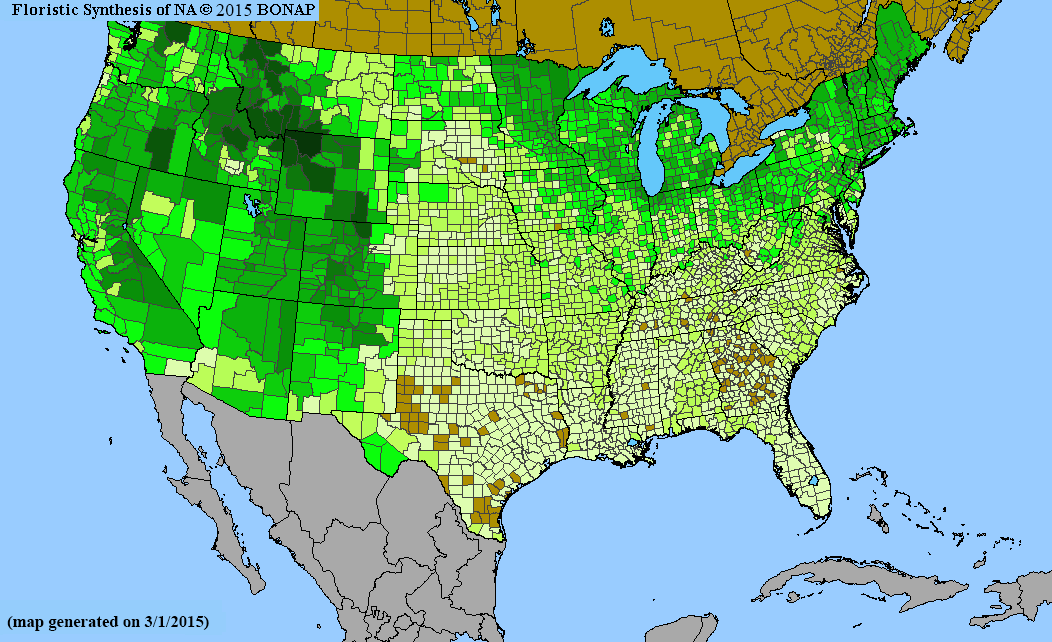
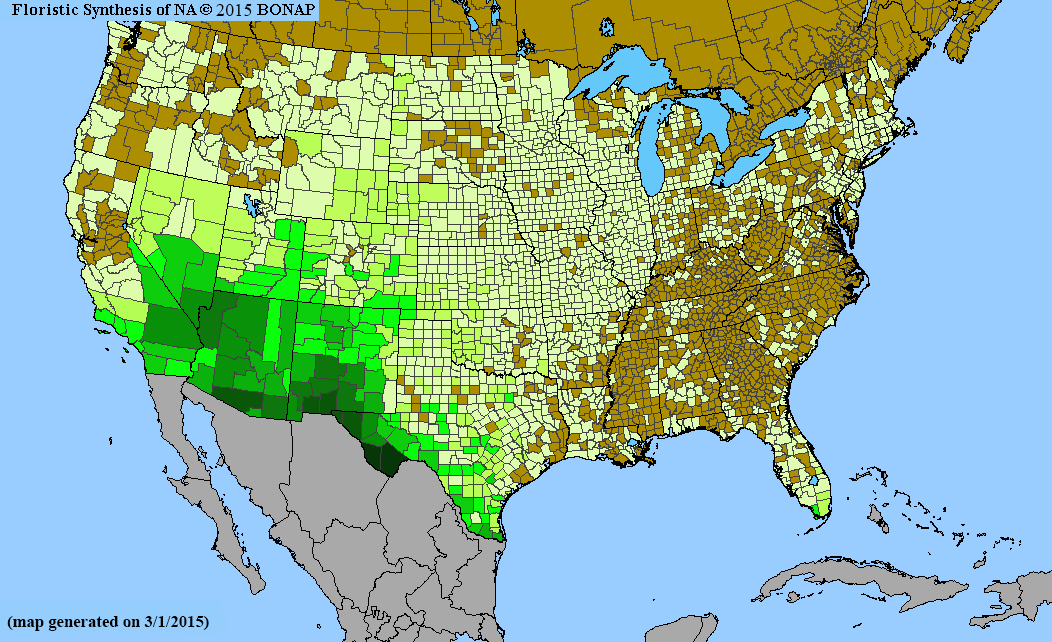
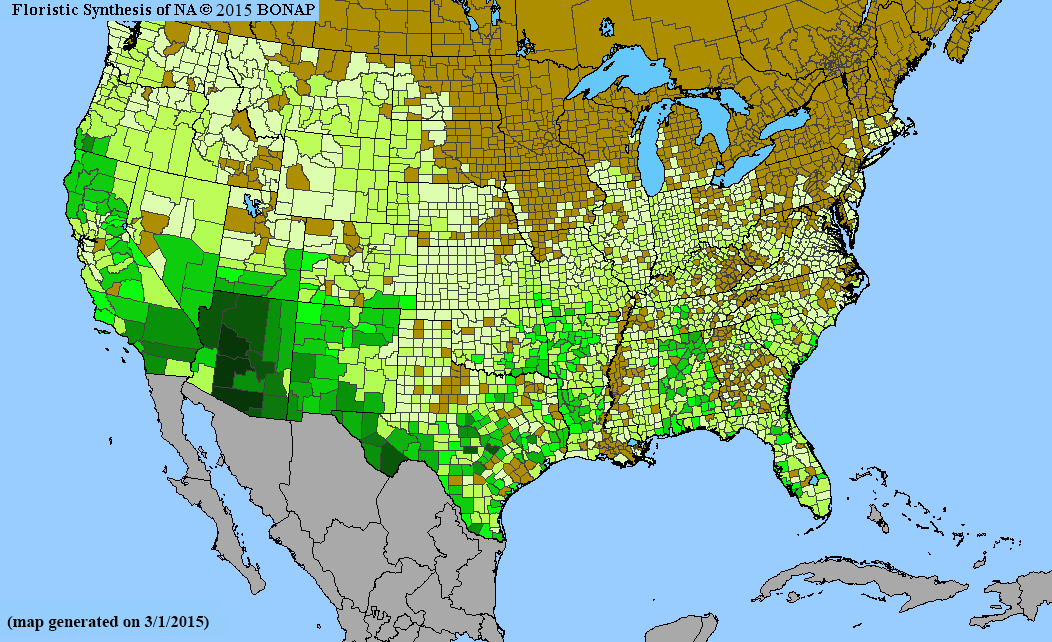
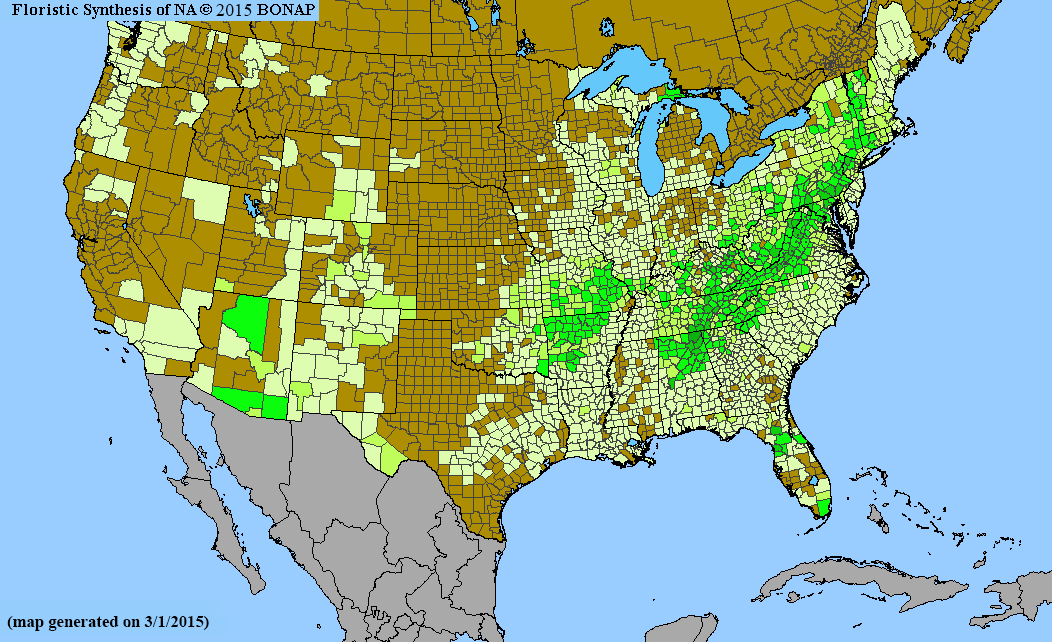
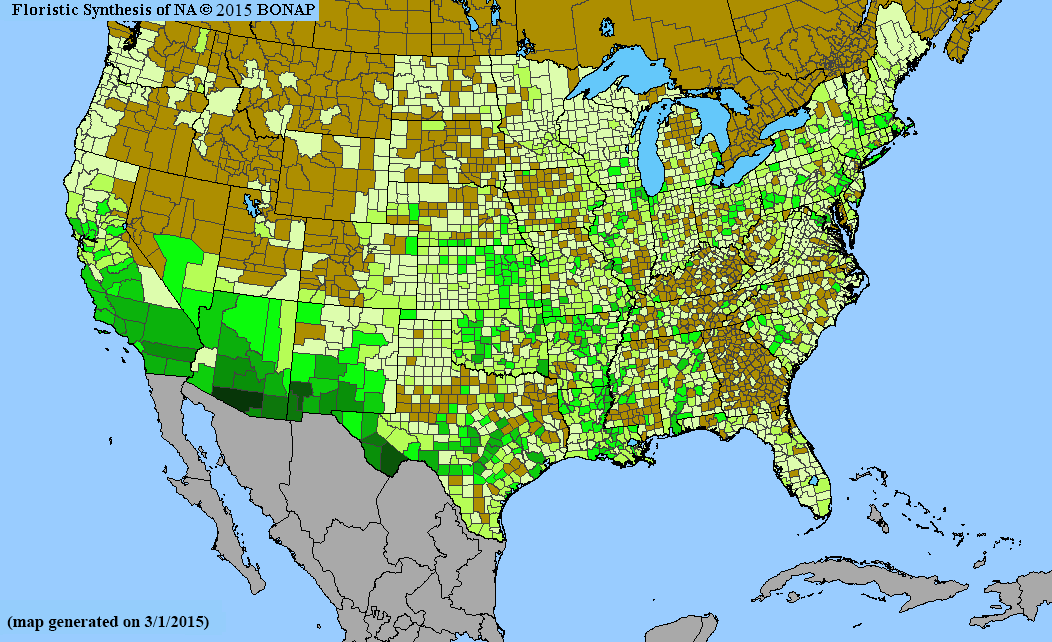
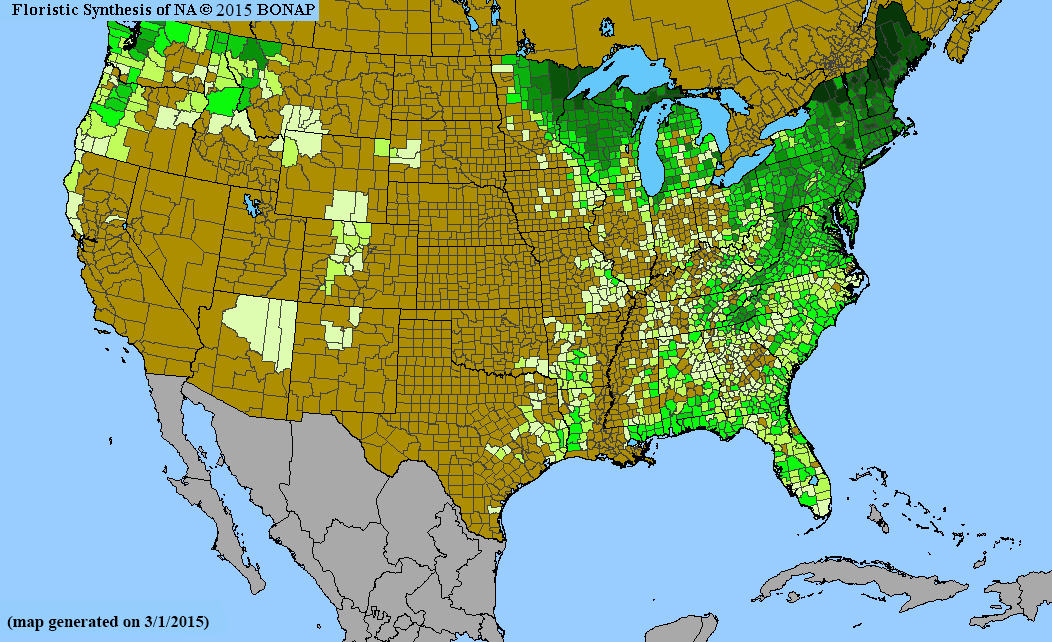
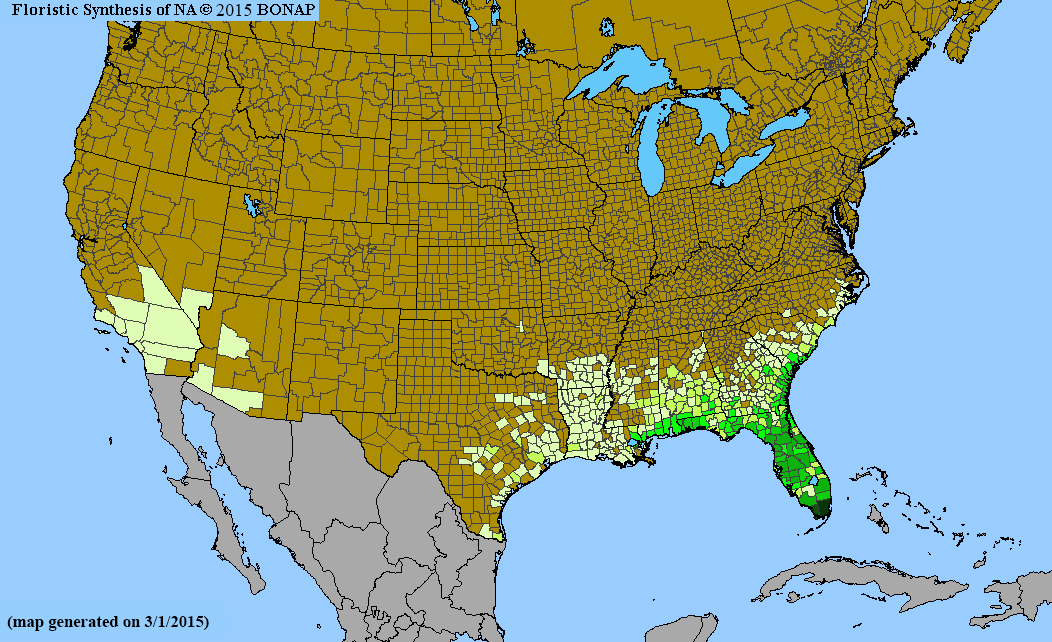
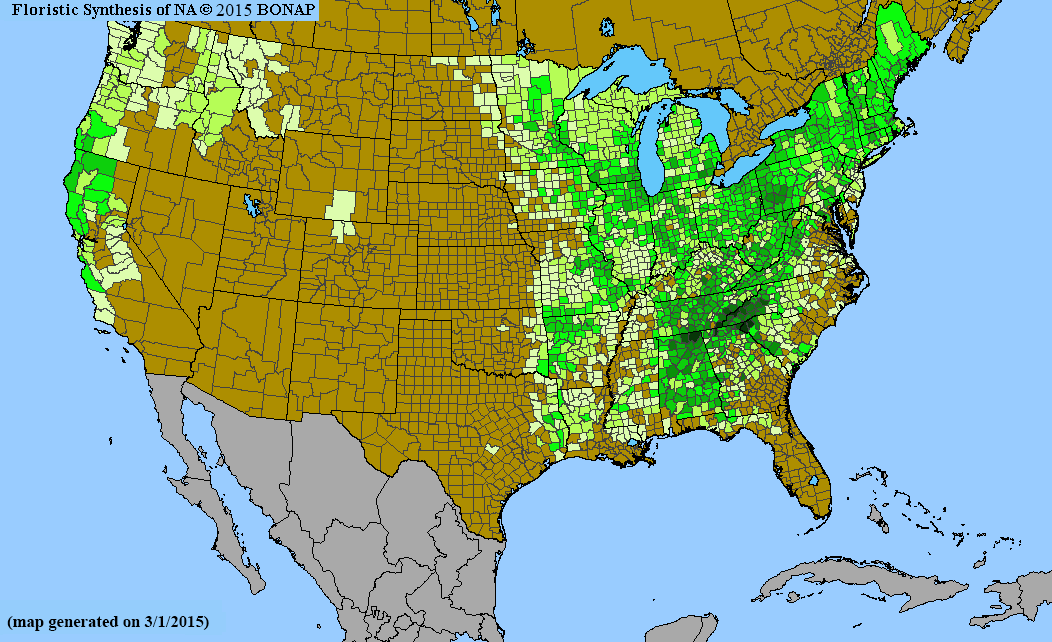
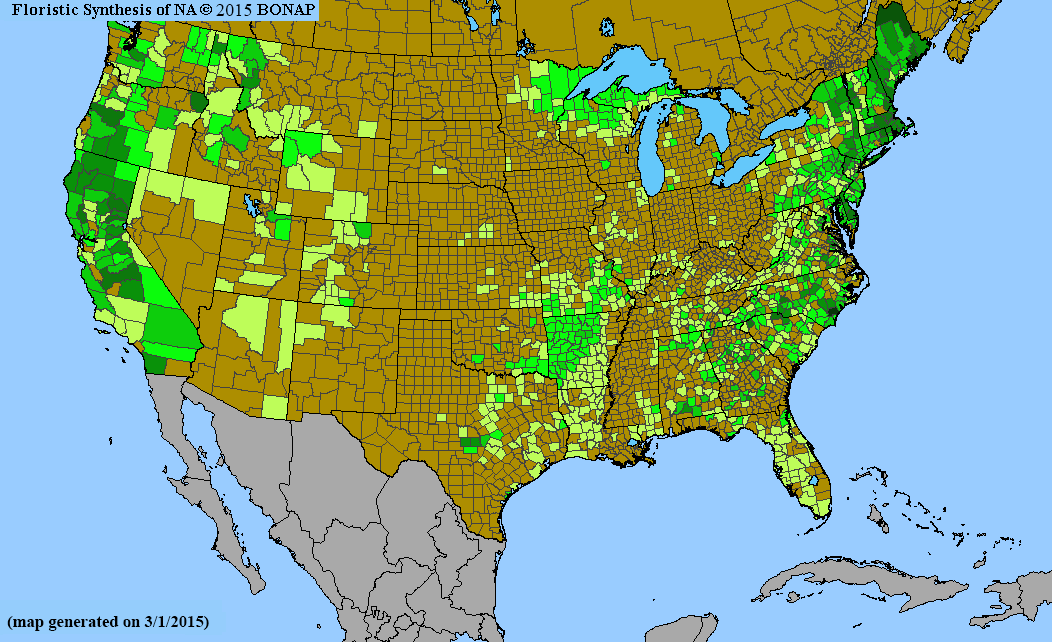
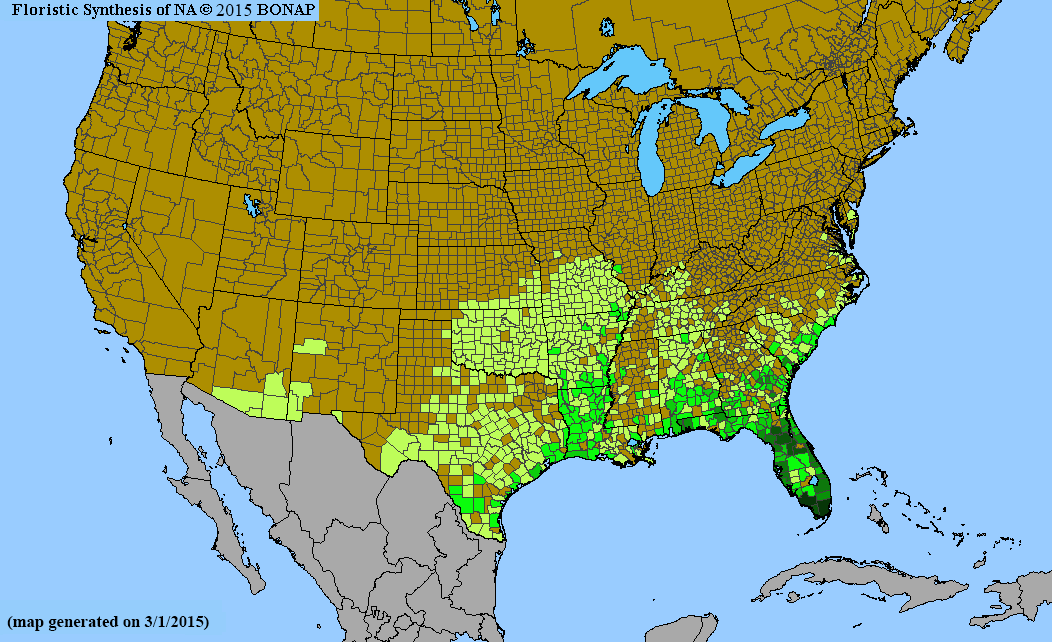
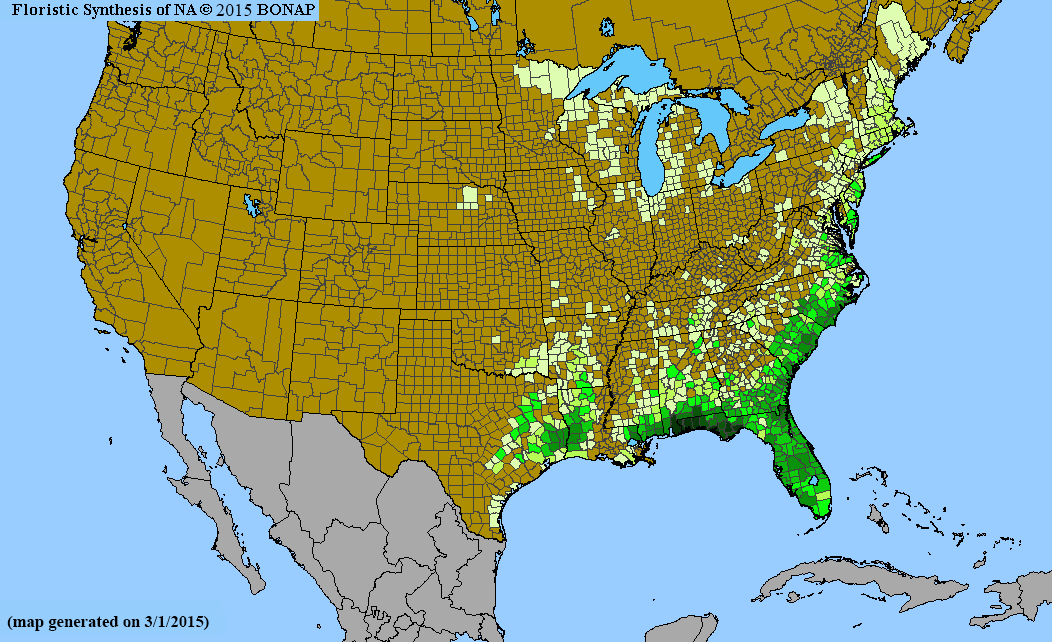
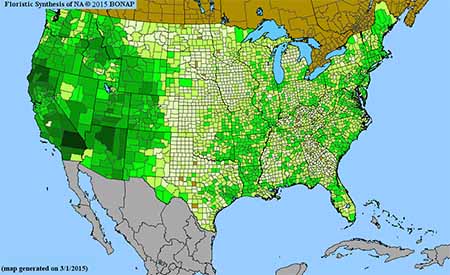
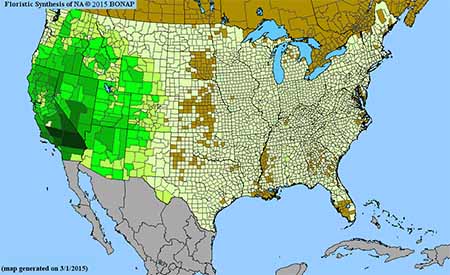
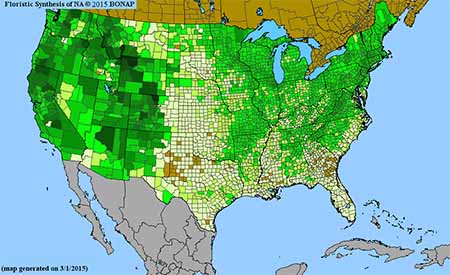
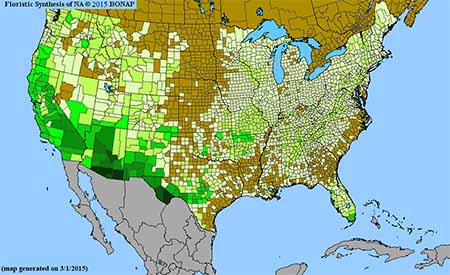
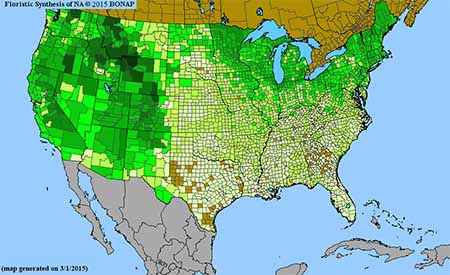
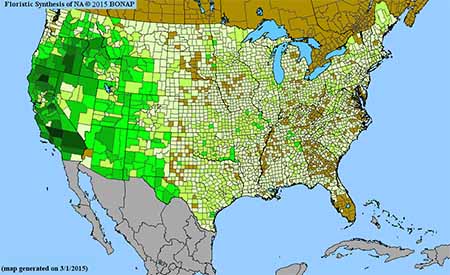
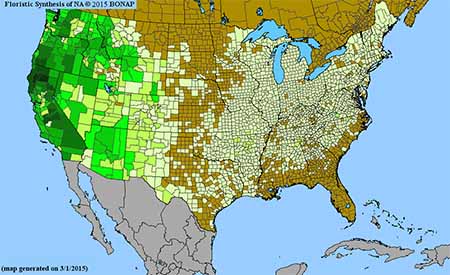
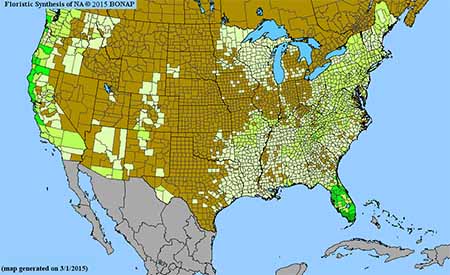
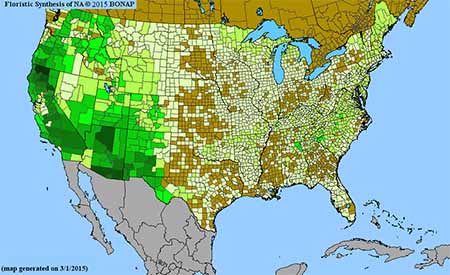
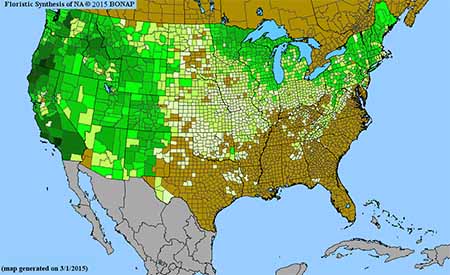
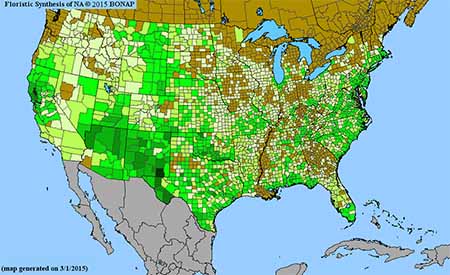
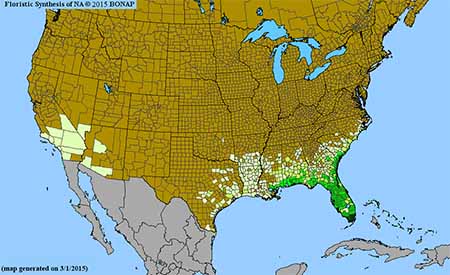
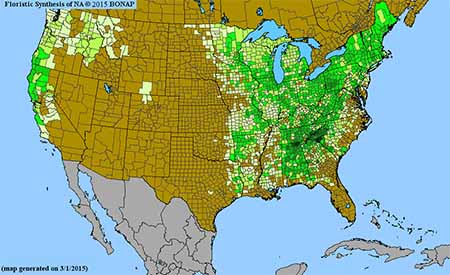
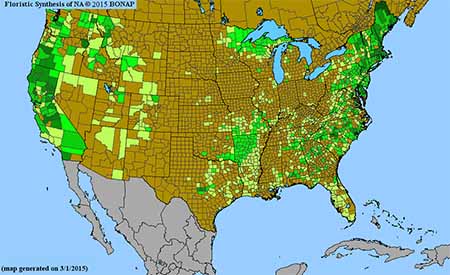
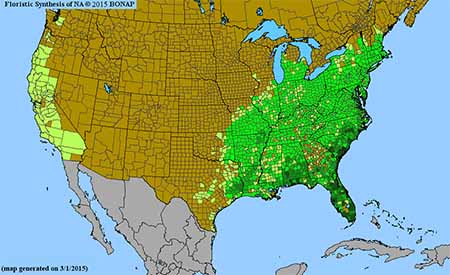
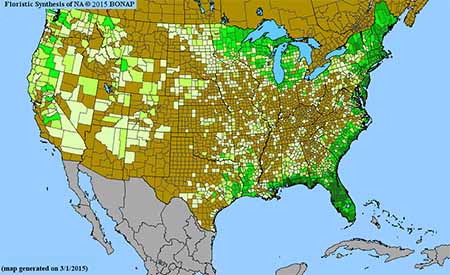
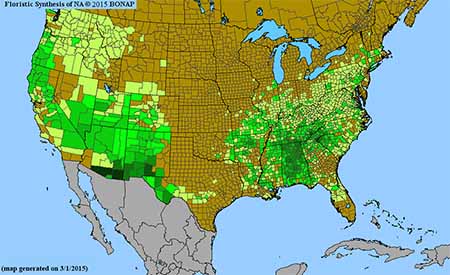
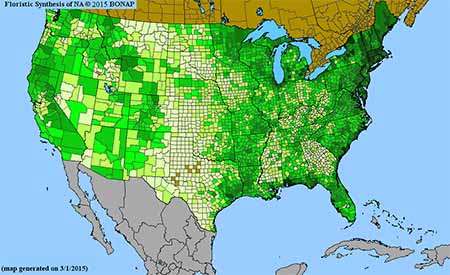 Density gradient of native species for CYPERACEAE. Darkest green (185 spp. Suffolk County, NY) indicates the highest species concentration. BONAP©2015 |
Density gradient of native species for ROSACEAE. Darkest green (89 spp. Kalamazoo County, MI) indicates the highest species concentrationes. BONAP©2015 |
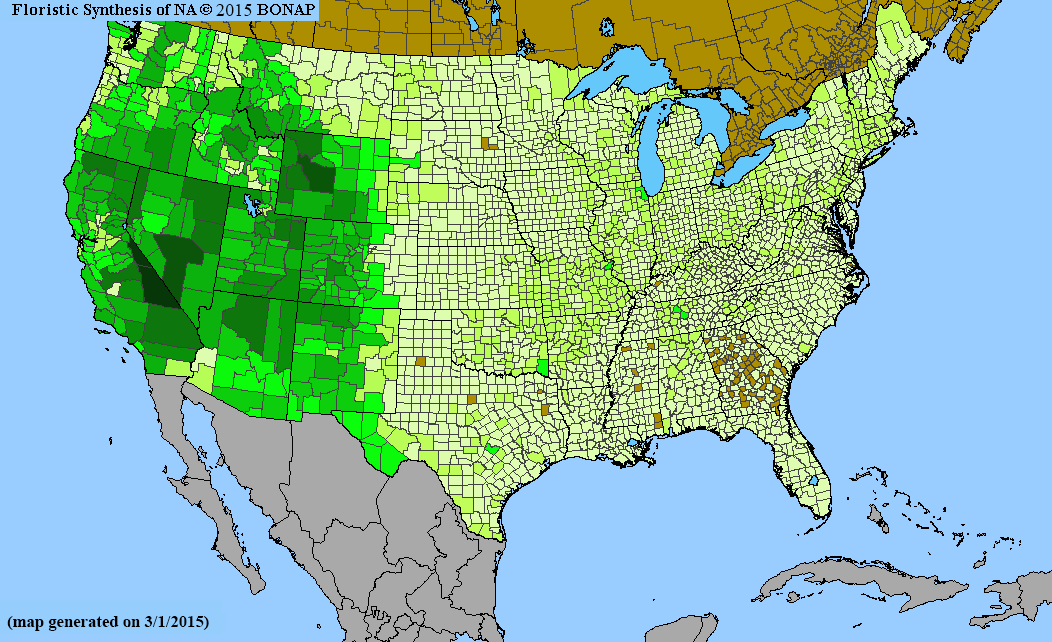
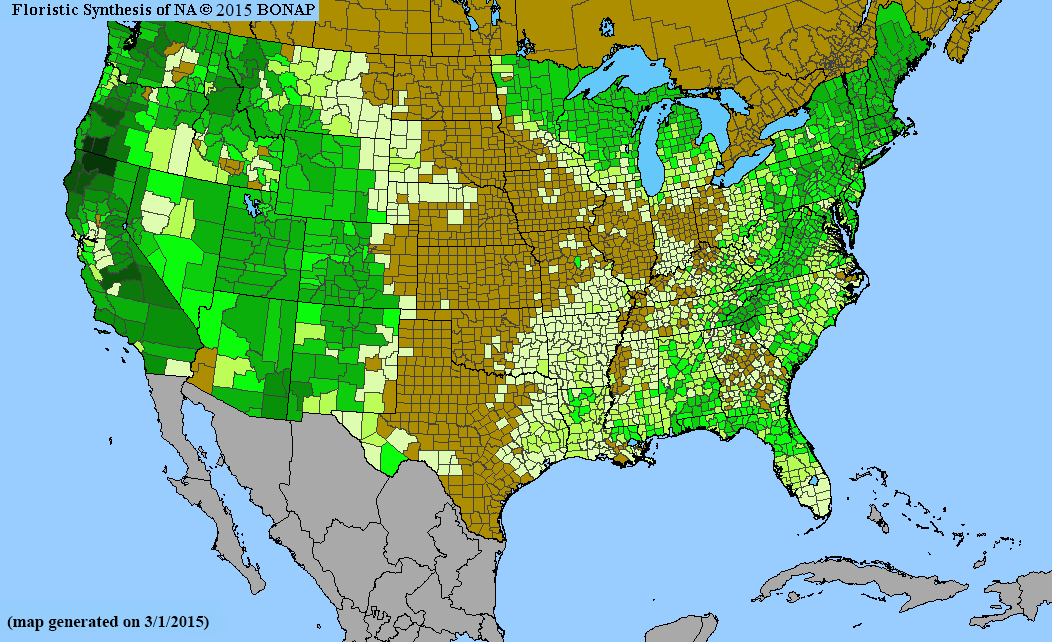
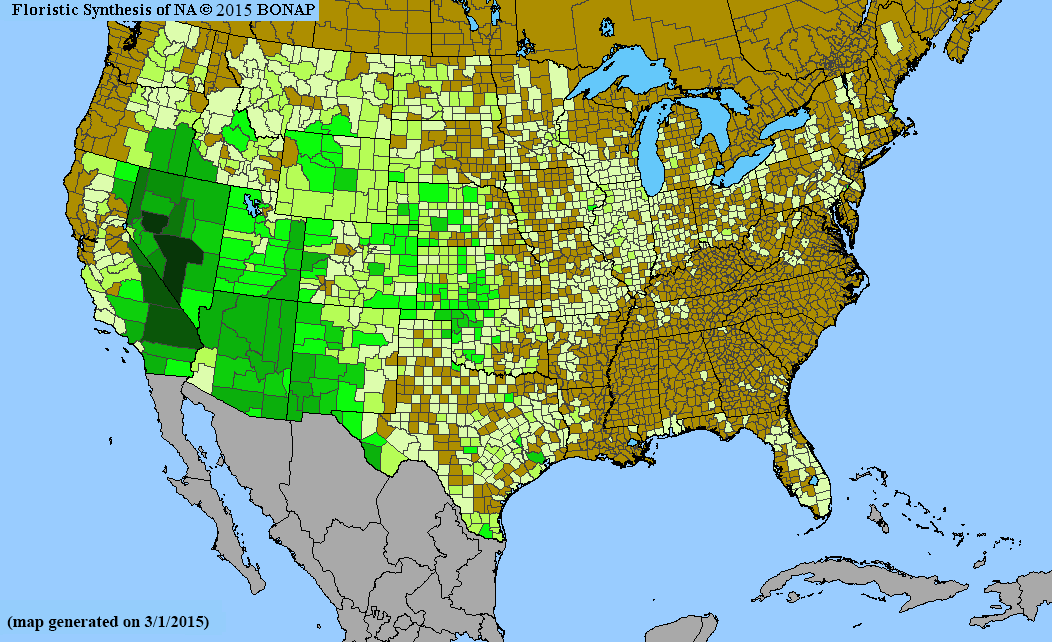
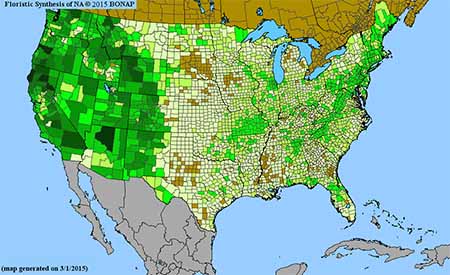
Densitygradient of native species for BRASSICACEAE. Darkest green (110 spp. Inyo County, CA) indicates the highest species concentration. BONAP©2015 |
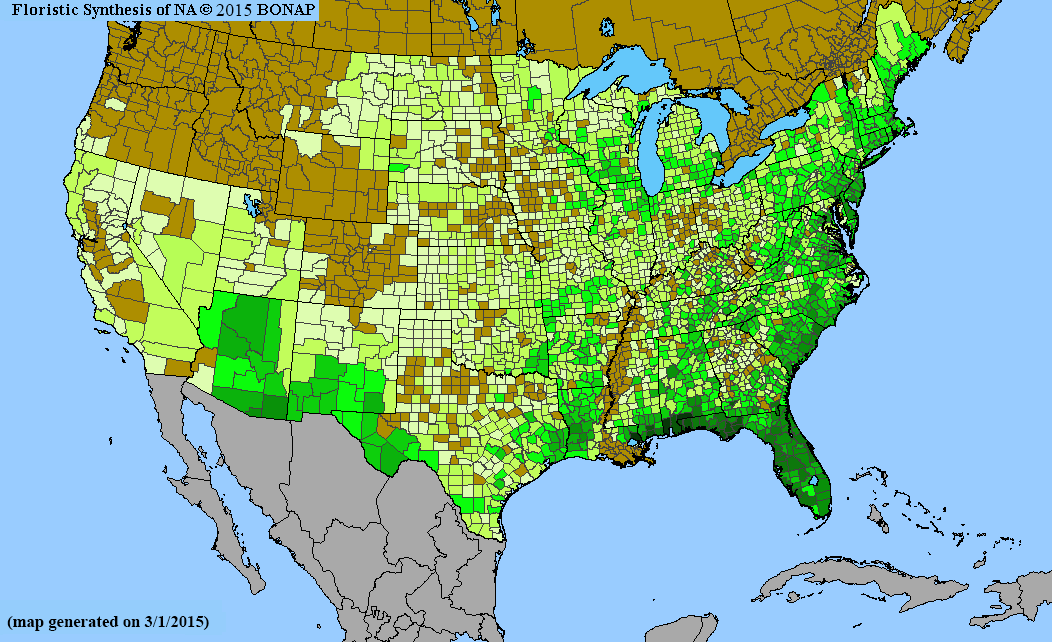
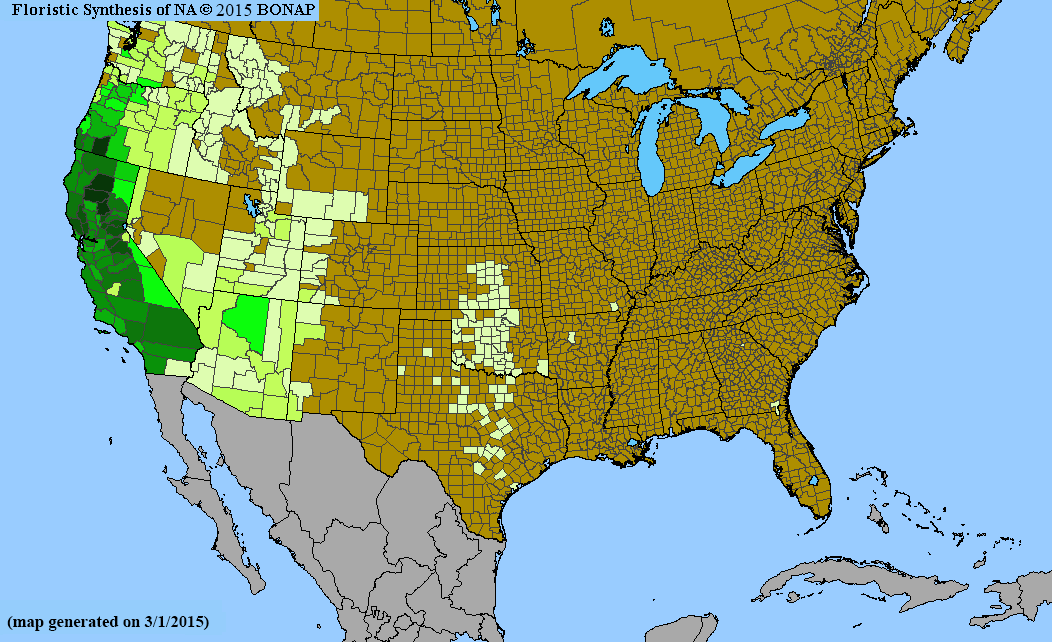
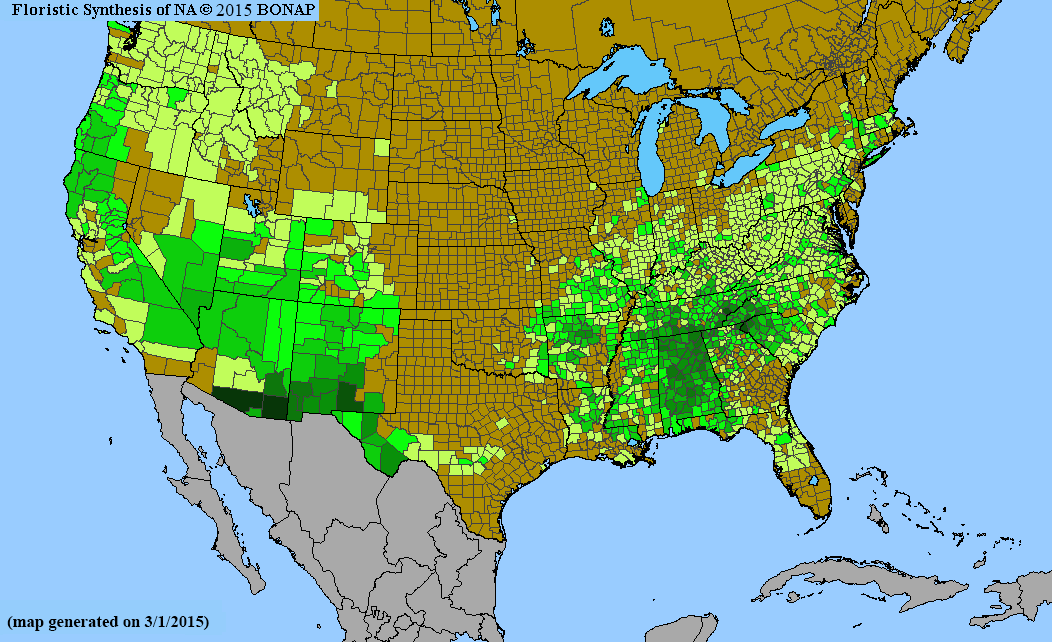
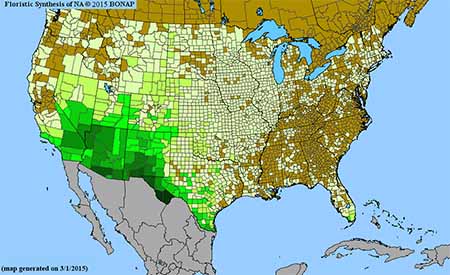
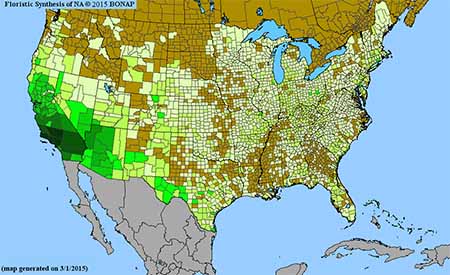
 Density gradient of native species for BORAGINACEAE. Darkest green (136 spp. San Bernardino County, CA) indicates the highest species concentration. BONAP©2015 |
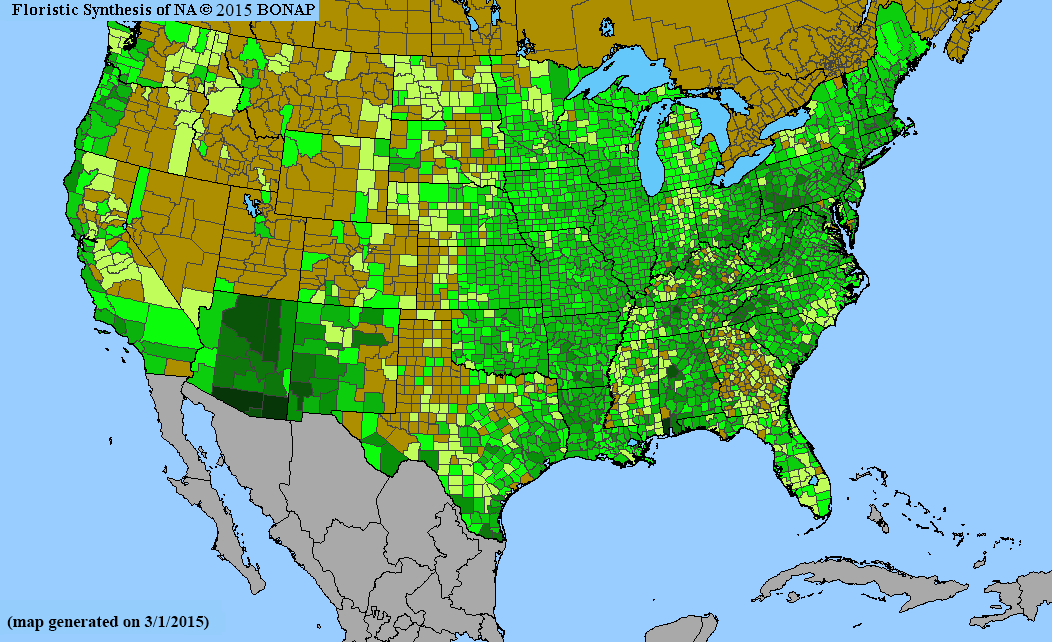
 Density gradient of native species for PLANTAGINACEAE. Darkest green (63 spp. San Bernardino County, CA) indicates the highest species concentration. BONAP©2015 |
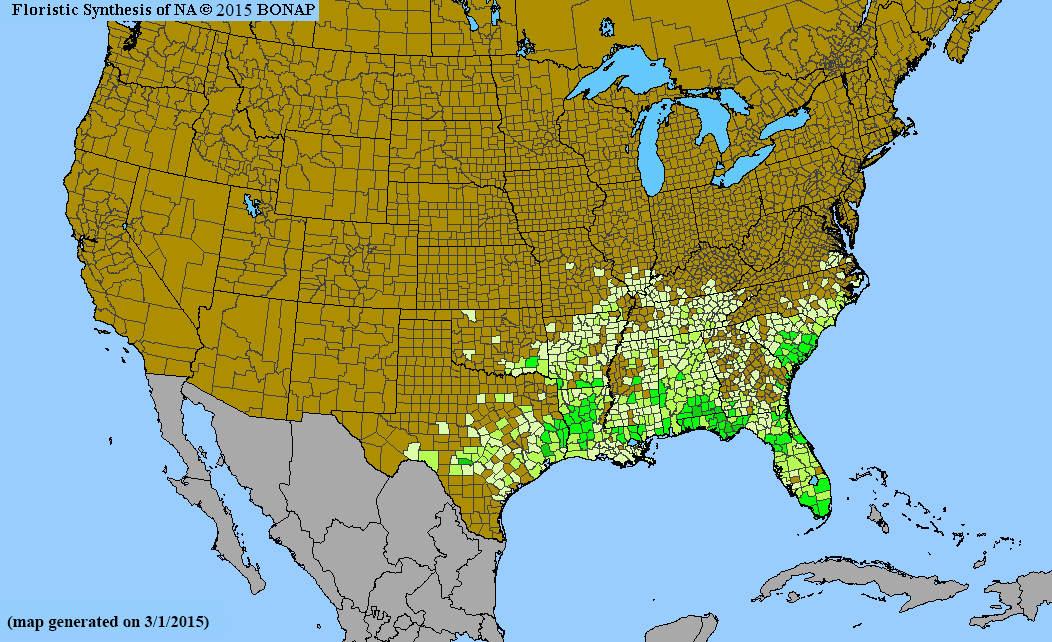
Density gradient of native species for POLYGONACEAE. Darkest green (87 spp. Inyo County, CA) indicates the highest species concentration. BONAP©2015 |
 Density gradient of native species for LAMIACEAE. Darkest green (51 spp. San Bernardino County, CA) indicates the highest species concentration. BONAP©2015 | 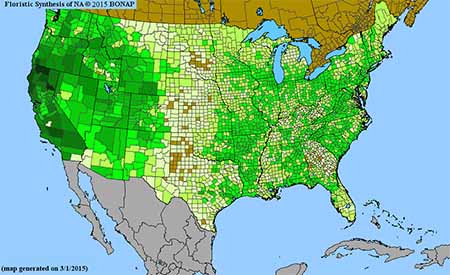 Density gradient of native species for APIACEAE. Darkest green (58 spp. Siskiyou County, CA) indicates the highest species concentration. BONAP©2015 |
 Density gradient of native species for POLEMONIACEAE. Darkest green (98 spp. San Bernardino County, CA) indicates the highest species concentration. BONAP©2015 |
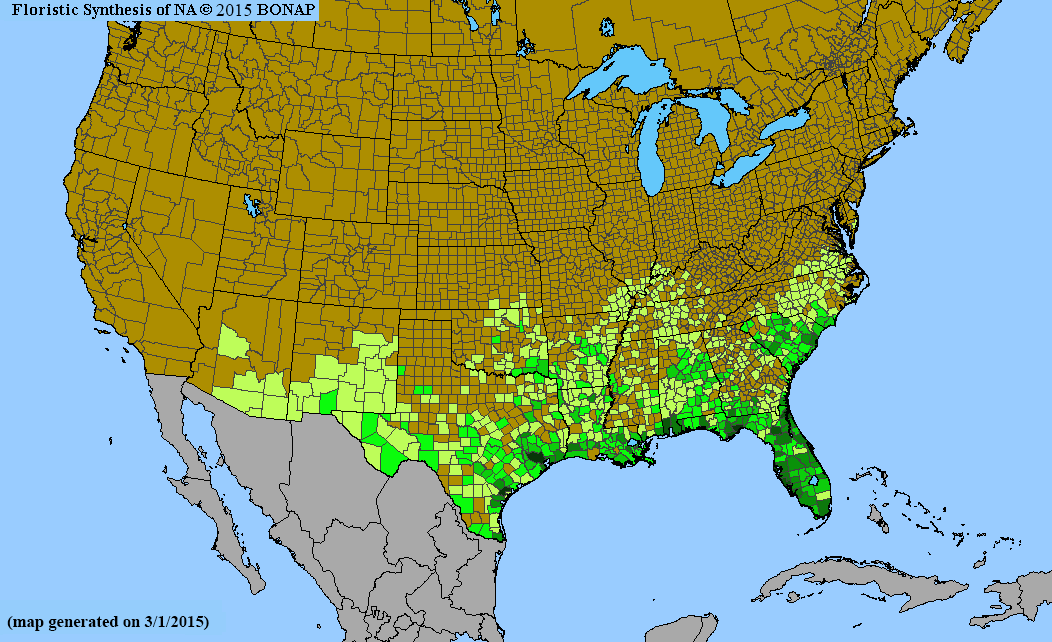
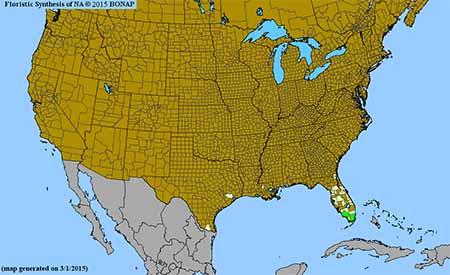
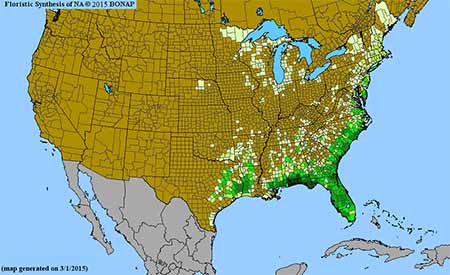
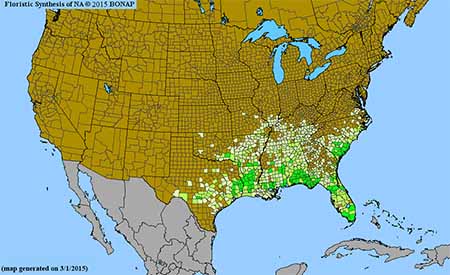
 Density gradient of native species for ORCHIDACEAE. Darkest green (59 spp. Miami-Dade County, FL) indicates the highest species concentration. BONAP©2015 |
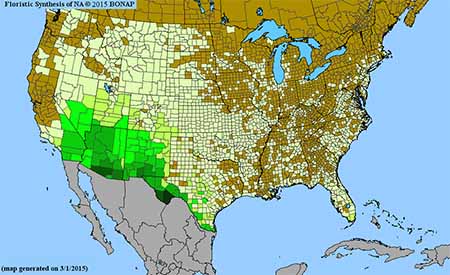
 Density gradient of native species for EUPHORBIACEAE. Darkest green (65 spp. Pima County, AZ) indicates the highest species concentration. BONAP©2015 |
Density gradient of native species for OROBANCHACEAE. Darkest green (37 spp. Fresno County, CA; Humboldt County, CA; Shasta County, CA) indicates the highest species concentration. BONAP©2015 |
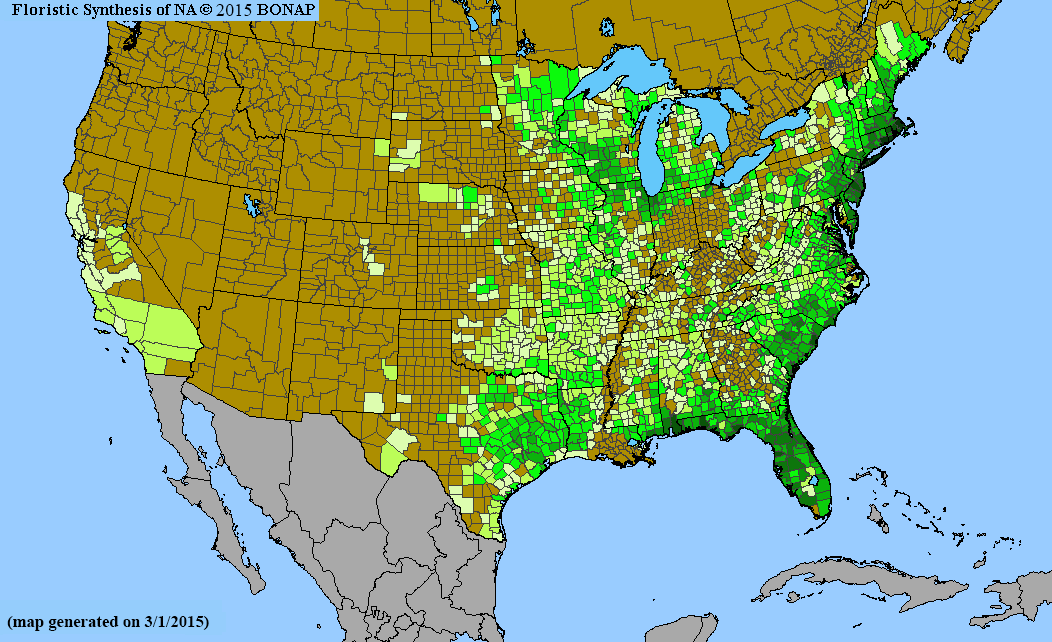
 Density gradient of native species for RANUNCULACEAE. Darkest green (54 spp. Park County, WY) indicates the highest species concentration. BONAP©2015 |
 Density gradient of native species for MALVACEAE. Darkest green (48 spp. Pima County, AZ) indicates the highest species concentration. BONAP©2015 |
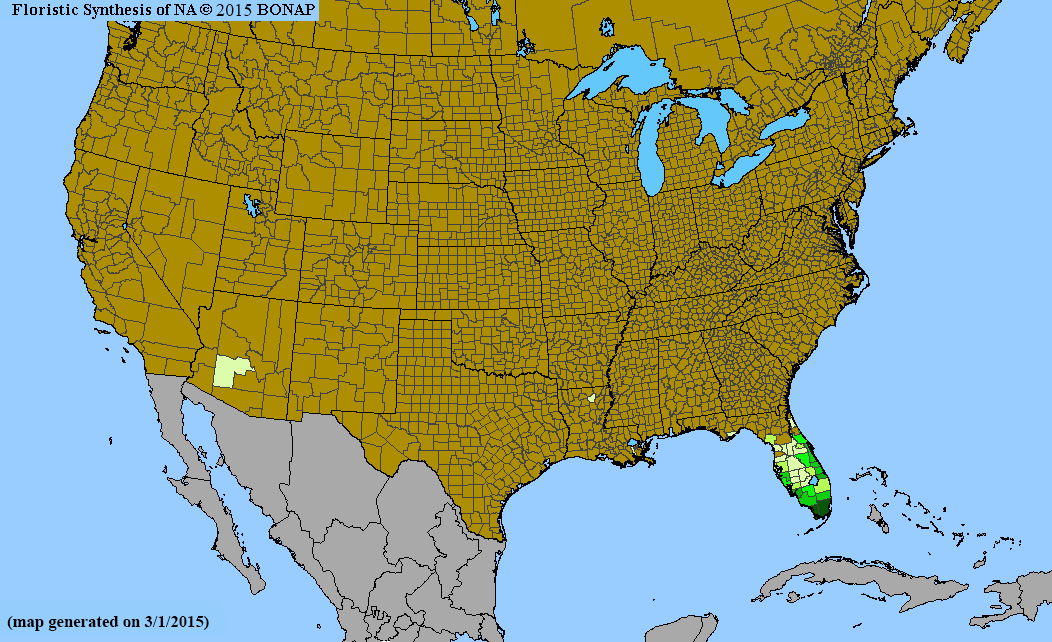
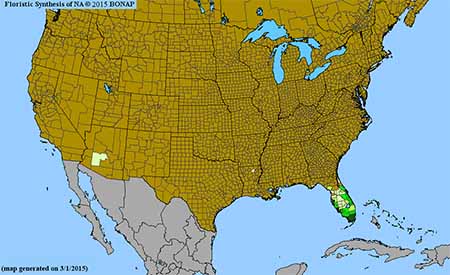
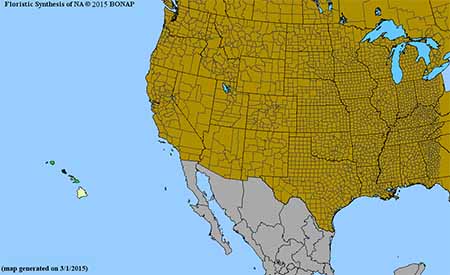
 Density gradient of native species for RUBIACEAE. Darkest green (40 spp. Honolulu County, HI) indicates the highest species concentration. BONAP©2015 |
 Density gradient of native species for ONAGRACEAE. Darkest green (78 spp. San Bernardino County, CA) indicates the highest species concentration. BONAP©2015 |
 Density gradient of native species for CARYOPHYLLACEAE. Darkest green (37 spp. Cordova Census Area, AK; Shasta County, CA) indicates the highest species concentration. BONAP©2015 |
 Density gradient of native species for CAMPANULACEAE. Darkest green (55 spp. Maui County, HI) indicates the highest species concentration. BONAP©2015 |
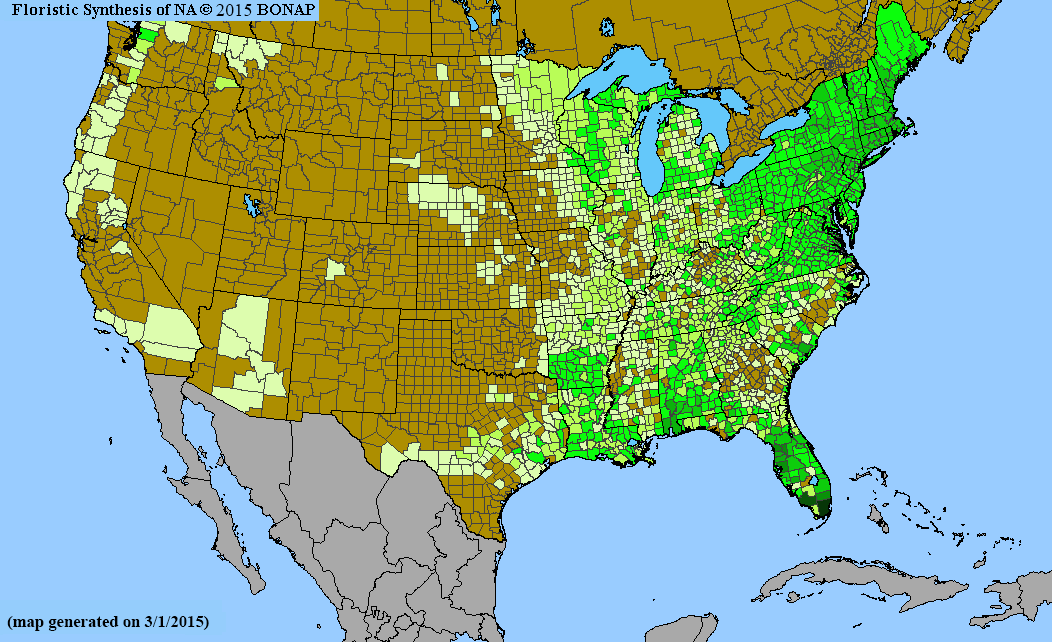
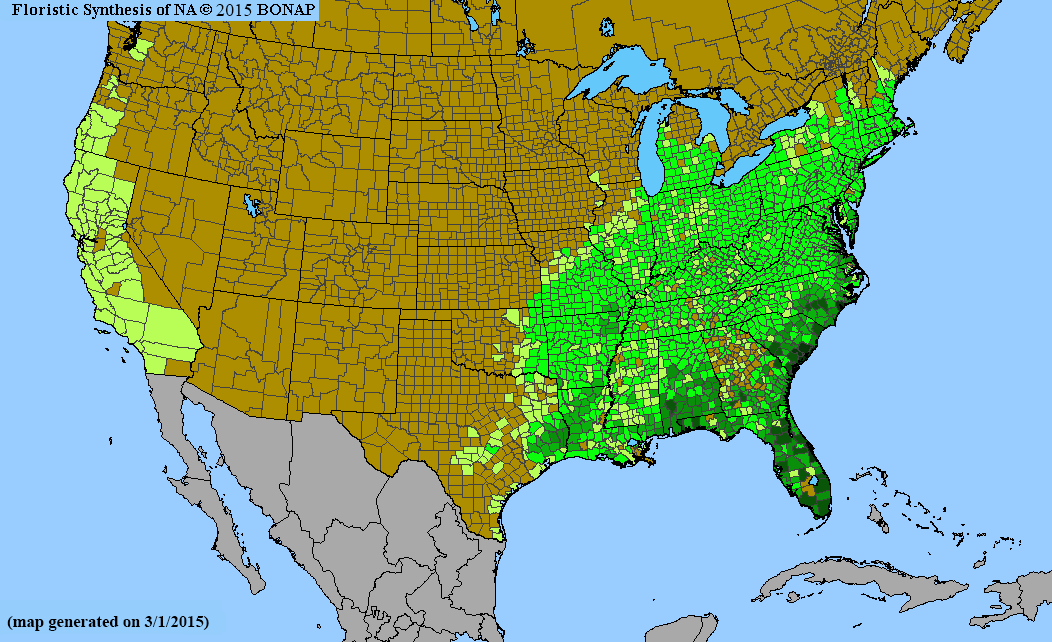
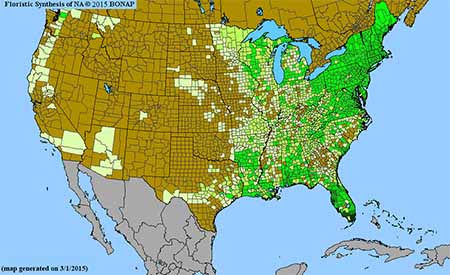
 Density gradient of native species for ERICACEAE. Darkest green (45 spp. Essex County, NY) indicates the highest species concentration. BONAP©2015 |
 Density gradient of native species for AMARANTHACEAE. Darkest green (61 spp. Los Angeles County, CA) indicates the highest species concentration. BONAP©2015 |
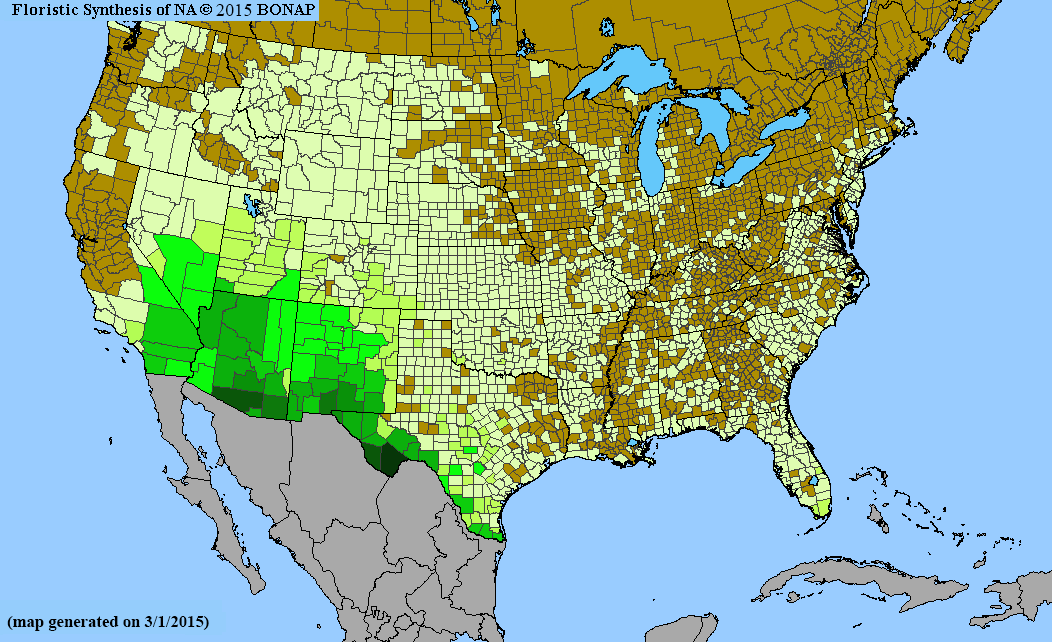
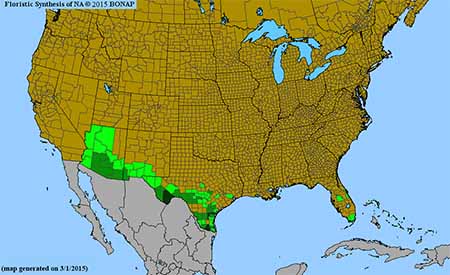
 Density gradient of native species for CACTACEAE. Darkest green (64 spp. Brewster County, TX) indicates the highest species concentration. BONAP©2015 |
 Density gradient of native species for APOCYNACEAE. Darkest green (35 spp. Pima County, AZ) indicates the highest species concentration. BONAP©2015 |
 Density gradient of native species for CONVOLVULACEAE. Darkest green (33 spp. Miami-Dade County, FL; Dona Ana County, NM) indicates the highest species concentration. BONAP©2015 |
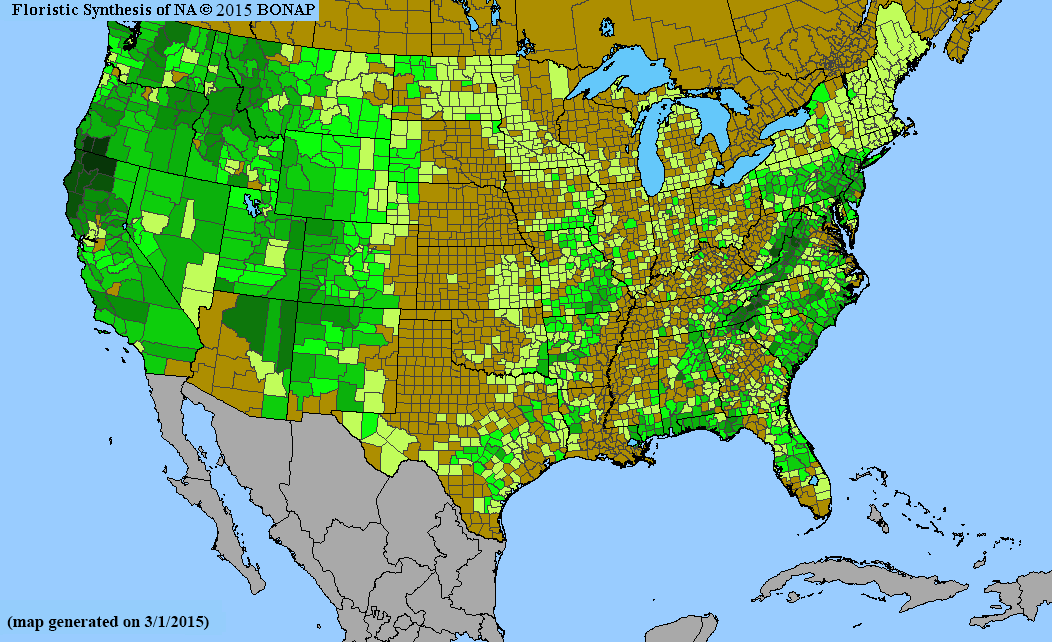
 Density gradient of native species for SAXIFRAGACEAE. Darkest green (38 spp. Siskiyou County, CA; Lane County, OR) indicates the highest species concentration. BONAP©2015 |
 Density gradient of native species for PTERIDACEAE. Darkest green (34 spp. Cochise County, AZ; Brewster County, TX) indicates the highest species concentration. BONAP©2015 |
 Density gradient of native species for LILIACEAE. Darkest green (35 spp. Jackson County, OR) indicates the highest species concentration. BONAP©2015 |
Density gradient of native species for SOLANACEAE. Darkest green (42 spp. Pima County, AZ) indicates the highest species concentration. BONAP©2015 |
 Density gradient of native species for JUNCACEAE. Darkest green (38 spp. Plumas County, CA) indicates the highest species concentration. BONAP©2015 |
 Density gradient of native species for PRIMULACEAE. Darkest green (25 spp. Kauai County, HI) indicates the highest species concentration. BONAP©2015 |
 Density gradient of native species for SALICACEAE. Darkest green (33 spp. Park County, WY) indicates the highest species concentration. BONAP©2015 |
 Density gradient of native species for GENTIANACEAE. Darkest green (17 spp. Baldwin County, AL; Mobile County, AL) indicates the highest species concentration. BONAP©2015 |
 Density gradient of native species for RHAMNACEAE. Darkest green (26 spp. Riverside County, CA) indicates the highest species concentration. BONAP©2015 |
 Density gradient of native species for FAGACEAE. Darkest green (29 spp. Tuscaloosa County, AL; Berkeley County, SC) indicates the highest species concentration. BONAP©2015 |
 Density gradient of native species for NYCTAGINACEAE. Darkest green (30 spp. Brewster County, TX) indicates the highest species concentration. BONAP©2015 |
 Density gradient of native species for DRYOPTERIDACEAE. Darkest green (25 spp. Maui County, HI) indicates the highest species concentration. BONAP©2015 |
 Density gradient of native species for LOASACEAE. Darkest green (28 spp. San Bernardino County, CA) indicates the highest species concentration. BONAP©2015 |
 Density gradient of native species for PHRYMACEAE. Darkest green (35 spp. Fresno County, CA; Tulare County, CA) indicates the highest species concentration. BONAP©2015 |
 Density gradient of native species for ALLIACEAE. Darkest green (18 spp. Shasta County, CA) indicates the highest species concentration. BONAP©2015 |
 Density gradient of native species for RUTACEAE. Darkest green (30 spp. Honolulu County, HI) indicates the highest species concentration. BONAP©2015 |
 Density gradient of native species for AGAVACEAE. Darkest green (14 spp. Maricopa County, AZ; Pima County, AZ; Yavapai County, AZ) indicates the highest species concentration. BONAP©2015 |
 Density gradient of native species for VERBENACEAE. Darkest green (26 spp. Hidalgo County, TX) indicates the highest species concentration. BONAP©2015 |
 Density gradient of native species for MONTIACEAE. Darkest green (27 spp. Trinity County, CA) indicates the highest species concentration. BONAP©2015 |
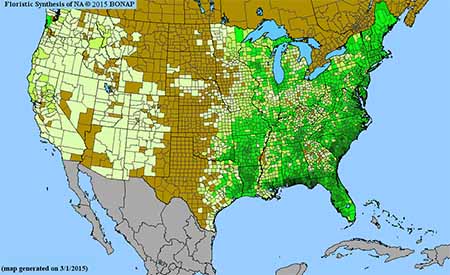
 Density gradient of native species for VIOLACEAE. Darkest green (24 spp. Blount County, TN) indicates the highest species concentration. BONAP©2015 |
 Density gradient of native species for ACANTHACEAE. Darkest green (19 spp. Brewster County, TX) indicates the highest species concentration. BONAP©2015 |
 Density gradient of native species for IRIDACEAE. Darkest green (14 spp. Natchitoches Parish, LA) indicates the highest species concentration. BONAP©2015 |
 Density gradient of native species for POLYPODIACEAE. Darkest green (17 spp. Kauai County, HI) indicates the highest species concentration. BONAP©2015 |
 Density gradient of native species for CRASSULACEAE. Darkest green (18 spp. San Diego County, CA) indicates the highest species concentration. BONAP©2015 |
 Density gradient of native species for ASPLENIACEAE. Darkest green (22 spp. Hawaii County, HI; Maui County, HI) indicates the highest species concentration. BONAP©2015 |
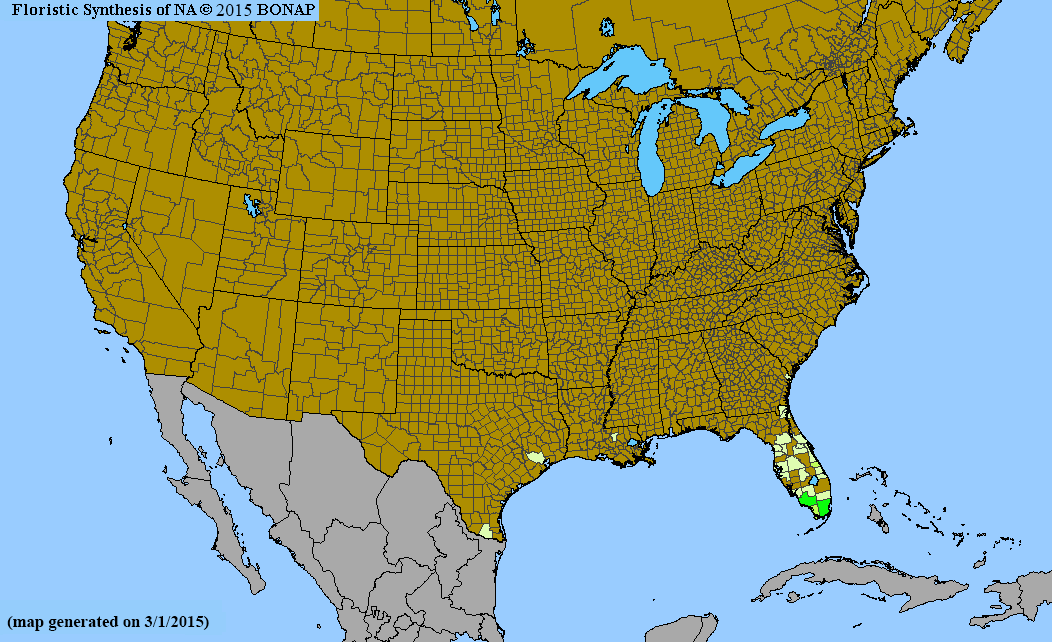
 Density gradient of native species for MYRTACEAE. Darkest green (11 spp. Honolulu County, HI) indicates the highest species concentration. BONAP©2015 |
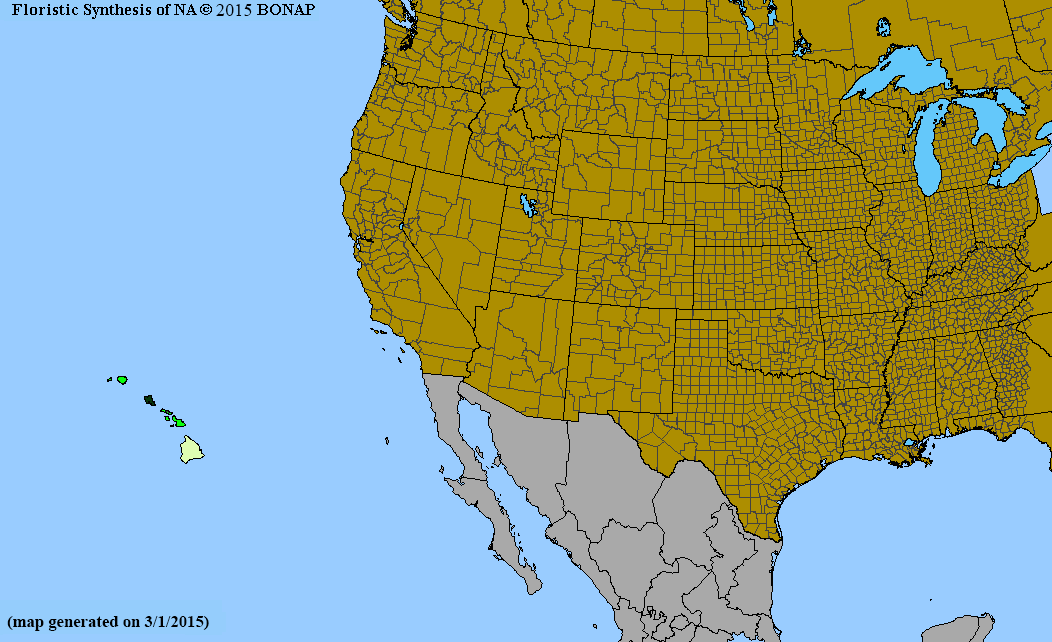
 Density gradient of native species for GESNERIACEAE. Darkest green (33 spp. Honolulu County, HI) indicates the highest species concentration. BONAP©2015 |
 Density gradient of native species for PINACEAE. Darkest green (20 spp. Jackson County, OR) indicates the highest species concentration. BONAP©2015 |
 Density gradient of native species for POLYGALACEAE. Darkest green (17 spp. Mobile County, AL; St. Tammany Parish, LA) indicates the highest species concentration. BONAP©2015 |
 Density gradient of native species for MELASTOMATACEAE. Darkest green (10 spp. Bay County, FL; Wakulla County, FL; Walton County, FL) indicates the highest species concentration. BONAP©2015 |
 Density gradient of native species for SANTALACEAE. Darkest green (14 spp. Siskiyou County, CA) indicates the highest species concentration. BONAP©2015 |
 Density gradient of native species for PIPERACEAE. Darkest green (21 spp. Maui County, HI) indicates the highest species concentration. BONAP©2015 |
 Density gradient of native species for THELYPTERIDACEAE. Darkest green (12 spp. Miami-Dade County, FL) indicates the highest species concentration. BONAP©2015 |
 Density gradient of native species for PAPAVERACEAE. Darkest green (16 spp. Kern County, CA; Los Angeles County, CA) indicates the highest species concentration. BONAP©2015 |
 Density gradient of native species for HYPERICACEAE. Darkest green (24 spp. Franklin County, FL) indicates the highest species concentration. BONAP©2015 |
 Density gradient of native species for HYMENOPHYLLACEAE. Darkest green (8 spp. Hawaii County, HI; Honolulu County, HI; Kauai County, HI; Maui County, HI) indicates the highest species concentration. BONAP©2015 |
 Density gradient of native species for URTICACEAE. Darkest green (11 spp. Honolulu County, HI) indicates the highest species concentration. BONAP©2015 |
 Density gradient of native species for CUCURBITACEAE. Darkest green (11 spp. Pima County, AZ) indicates the highest species concentration. BONAP©2015 |
 Density gradient of native species for GROSSULARIACEAE. Darkest green (17 spp. Los Angeles County, CA) indicates the highest species concentration. BONAP©2015 |
 Density gradient of native species for LYCOPODIACEAE. Darkest green (16 spp. Franklin County, ME; Oxford County, ME; Somerset County, ME; Lamoille County, VT) indicates the highest species concentration. BONAP©2015 |
 Density gradient of native species for OPHIOGLOSSACEAE. Darkest green (18 spp. Flathead County, MT) indicates the highest species concentration. BONAP©2015 |
 Density gradient of native species for THEMIDACEAE. Darkest green (16 spp. Butte County, CA; Shasta County, CA; Tehama County, CA; Jackson County, OR) indicates the highest species concentration. BONAP©2015 |
 Density gradient of native species for LINACEAE. Darkest green (12 spp. Eddy County, NM) indicates the highest species concentration. BONAP©2015 |
 Density gradient of native species for SAPINDACEAE. Darkest green (12 spp. Blount County, TN) indicates the highest species concentration. BONAP©2015 |
 Density gradient of native species for SELAGINELLACEAE. Darkest green (10 spp. Brewster County, TX) indicates the highest species concentration. BONAP©2015 |
 Density gradient of native species for ARACEAE. Darkest green (16 spp. Cook County, IL) indicates the highest species concentration. BONAP©2015 |
 Density gradient of native species for ARECACEAE. Darkest green (9 spp. Miami-Dade County, FL; Kauai County, HI) indicates the highest species concentration. BONAP©2015 |
 Density gradient of native species for OLEACEAE. Darkest green (10 spp. Hernando County, FL; Liberty County, FL) indicates the highest species concentration. BONAP©2015 |
 Density gradient of native species for BROMELIACEAE. Darkest green (14 spp. Collier County, FL) indicates the highest species concentration. BONAP©2015 |
 Density gradient of native species for COMMELINACEAE. Darkest green (11 spp. Travis County, TX) indicates the highest species concentration. BONAP©2015 |
 Density gradient of native species for TRILLIACEAE. Darkest green (11 spp. Jackson County, AL; Oconee County, SC; Polk County, TN) indicates the highest species concentration. BONAP©2015 |
 Density gradient of native species for ALISMATACEAE. Darkest green (12 spp. Mobile County, AL; Leon County, FL) indicates the highest species concentration. BONAP©2015 |
 Density gradient of native species for CUPRESSACEAE. Darkest green (9 spp. Coconino County, AZ; Gila County, AZ; Yavapai County, AZ; Los Angeles County, CA) indicates the highest species concentration. BONAP©2015 |
 Density gradient of native species for POTAMOGETONACEAE. Darkest green (26 spp. Essex County, NY; St. Lawrence County, NY) indicates the highest species concentration. BONAP©2015 |
 Density gradient of native species for ISOETACEAE. Darkest green (7 spp. Pender County, NC) indicates the highest species concentration. BONAP©2015 | |
 Density gradient of native species for ARALIACEAE. Darkest green (13 spp. Kauai County, HI) indicates the highest species concentration. BONAP©2015 |
 Density gradient of native species for AMARYLLIDACEAE. Darkest green (7 spp. Wakulla County, FL; Harris County, TX; Refugio County, TX) indicates the highest species concentration. BONAP©2015 |
 Density gradient of native species for CISTACEAE. Darkest green (13 spp. Nassau County, NY; Suffolk County, NY) indicates the highest species concentration. BONAP©2015 | |
 Density gradient of native species for LAURACEAE. Darkest green (6 spp. Brevard County, FL; Onslow County, NC; Berkeley County, SC; Charleston County, SC; Dorchester County, SC) indicates the highest species concentration. BONAP©2015 |
 Density gradient of native species for MELANTHIACEAE. Darkest green (8 spp. Siskiyou County, CA; Jackson County, OR; Josephine County, OR) indicates the highest species concentration. BONAP©2015 |
 Density gradient of native species for RUSCACEAE. Darkest green (8 spp. Otero County, NM) indicates the highest species concentration. BONAP©2015 | |
 Density gradient of native species for ARISTOLOCHIACEAE. Darkest green (10 spp. Burke County, NC; Polk County, NC) indicates the highest species concentration. BONAP©2015 |
 Density gradient of native species for LENTIBULARIACEAE. Darkest green (17 spp. Wakulla County, FL) indicates the highest species concentration. BONAP©2015 |
 Density gradient of native species for SAPOTACEAE. Darkest green (7 spp. Collier County, FL; Miami-Dade County, FL) indicates the highest species concentration. BONAP©2015 |
|
 Density gradient of native species for XYRIDACEAE. Darkest green (21 spp. Liberty County, FL) indicates the highest species concentration. BONAP©2015 |
 Density gradient of native species for BETULACEAE. Darkest green (15 spp. Essex County, NY) indicates the highest species concentration. BONAP©2015 |
 Density gradient of native species for MALPIGHIACEAE. Darkest green (3 spp. Brewster County, TX; Hidalgo County, TX; Jim Wells County, TX; San Patricio County, TX) indicates the highest species concentration. BONAP©2015 | |
 Density gradient of native species for VALERIANACEAE. Darkest green (9 spp. Klamath County, OR) indicates the highest species concentration. BONAP©2015 |
 Density gradient of native species for CAPRIFOLIACEAE. Darkest green (10 spp. Keweenaw County, MI; Clearwater County, MN; Chemung County, NY; Cuyahoga County, OH; Milwaukee County, WI; Sheboygan County, WI) indicates the highest species concentration. BONAP©2015 |
 Density gradient of native species for CLEOMACEAE. Darkest green (11 spp. Nye County, NV) indicates the highest species concentration. BONAP©2015 | |
 Density gradient of native species for HYDRANGEACEAE. Darkest green (8 spp. Cochise County, AZ; Pima County, AZ) indicates the highest species concentration. BONAP©2015 |
 Density gradient of native species for OXALIDACEAE. Darkest green (8 spp. Mobile County, AL; Cochise County, AZ; Pima County, AZ) indicates the highest species concentration. BONAP©2015 |
 Density gradient of native species for CELASTRACEAE. Darkest green (6 spp. Miami-Dade County, FL; Monroe County, FL) indicates the highest species concentration. BONAP©2015 | |
 Density gradient of native species for LOGANIACEAE. Darkest green (11 spp. Honolulu County, HI) indicates the highest species concentration. BONAP©2015 |
|
Return to top of Map View Return to Graph View | |
| | | | |
| Graphs and maps generated by Misako Nishino and John Kartesz. | |