|
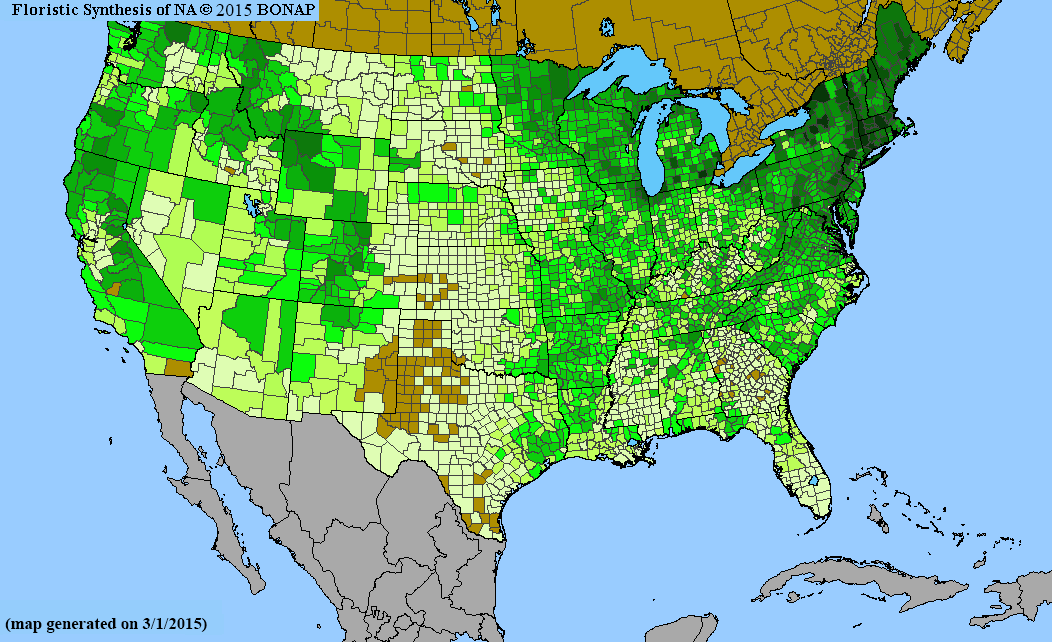
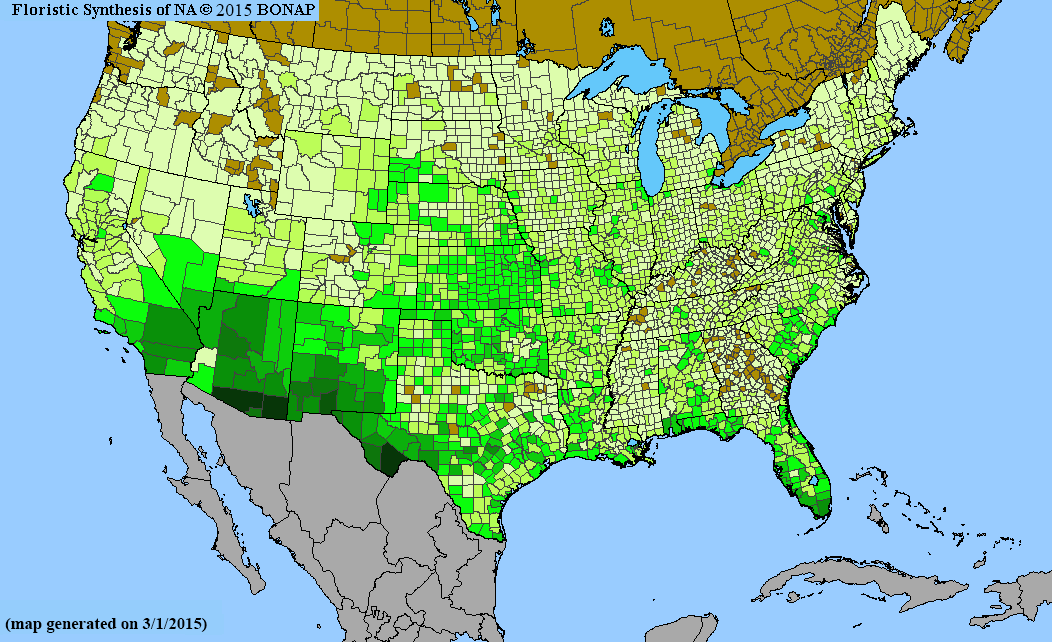
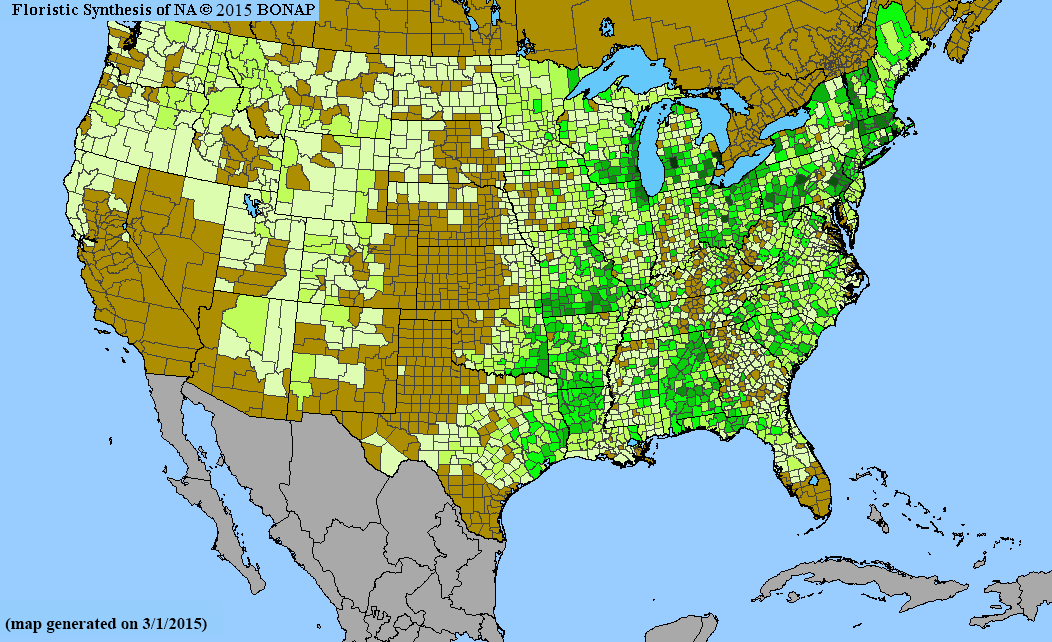
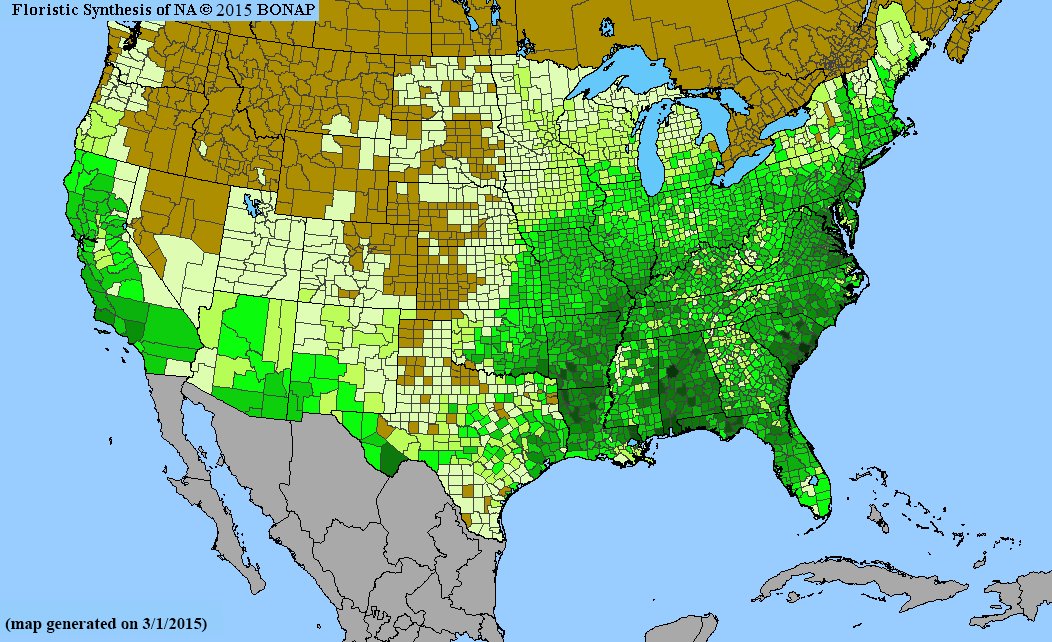
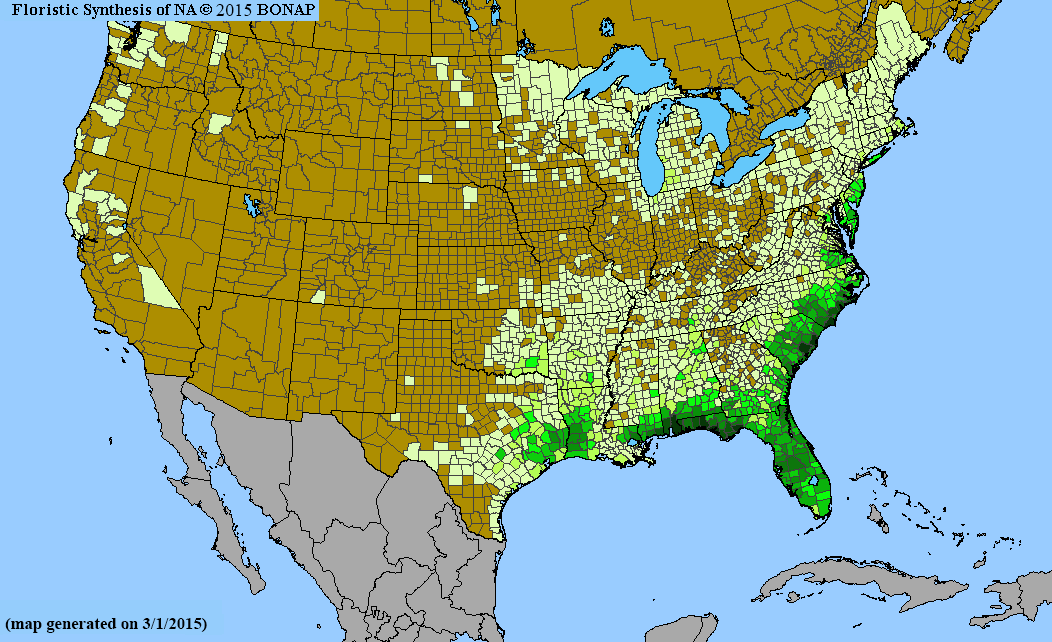
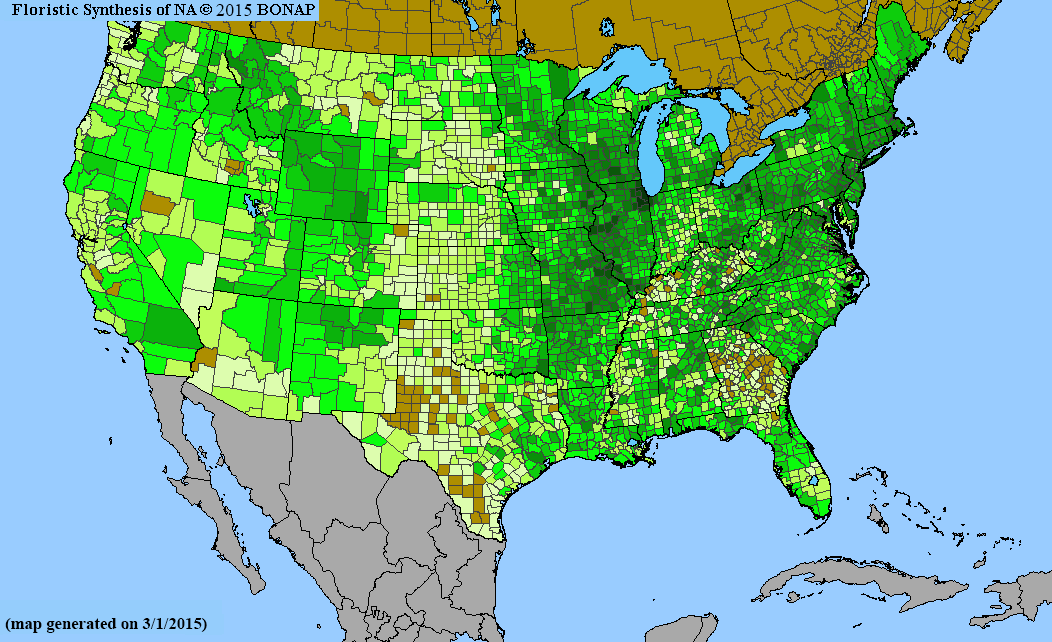
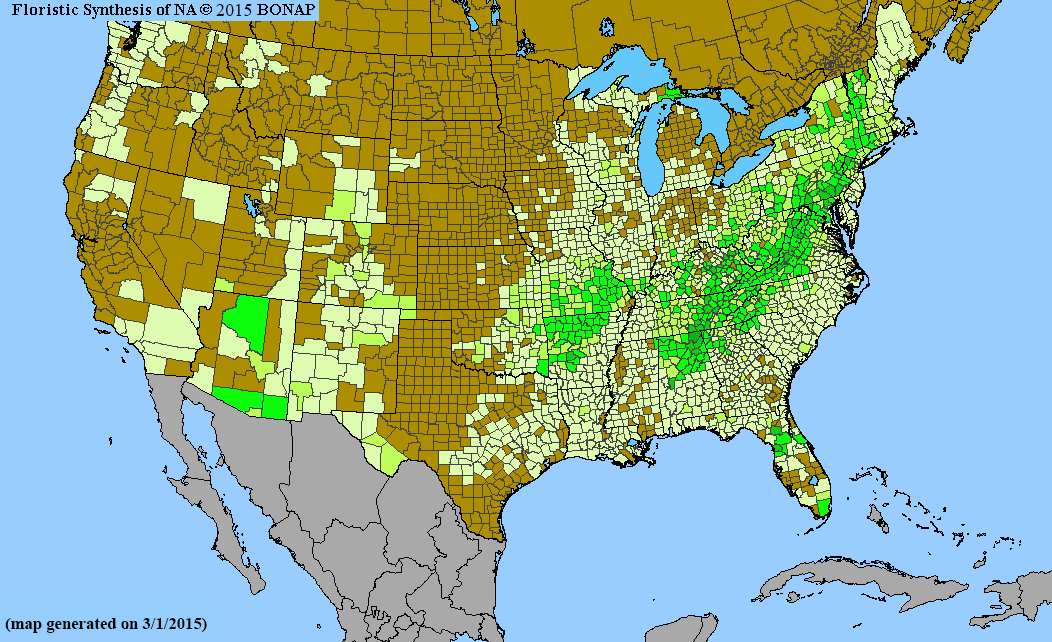
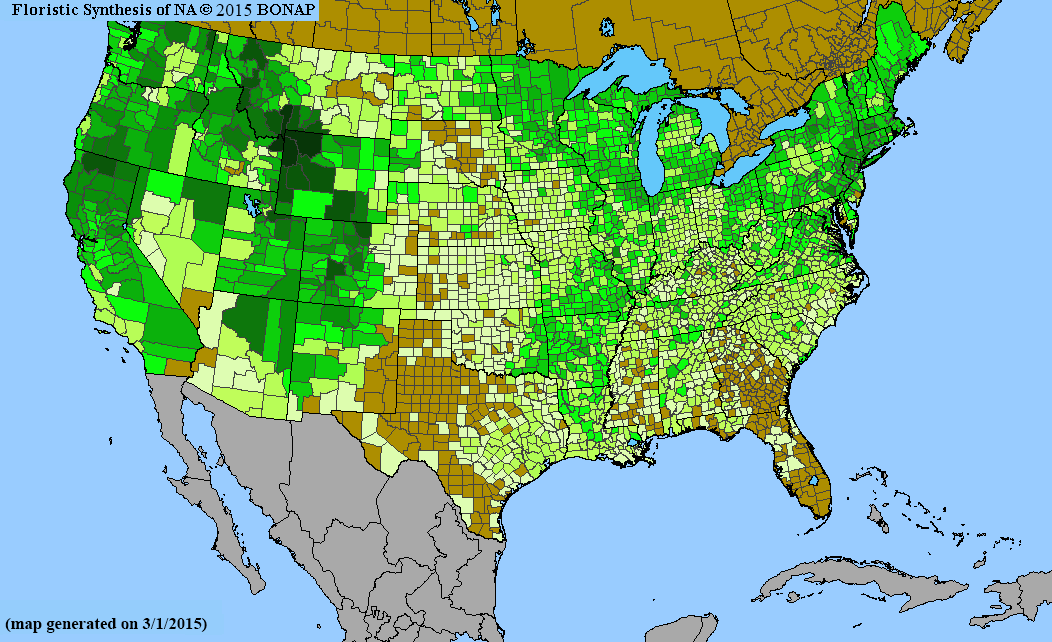
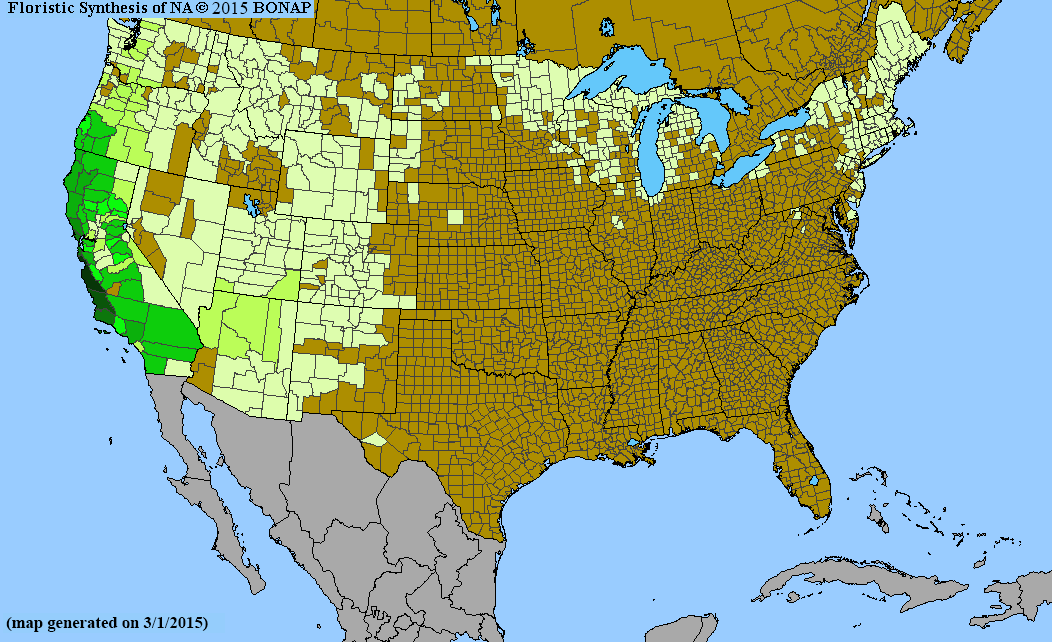
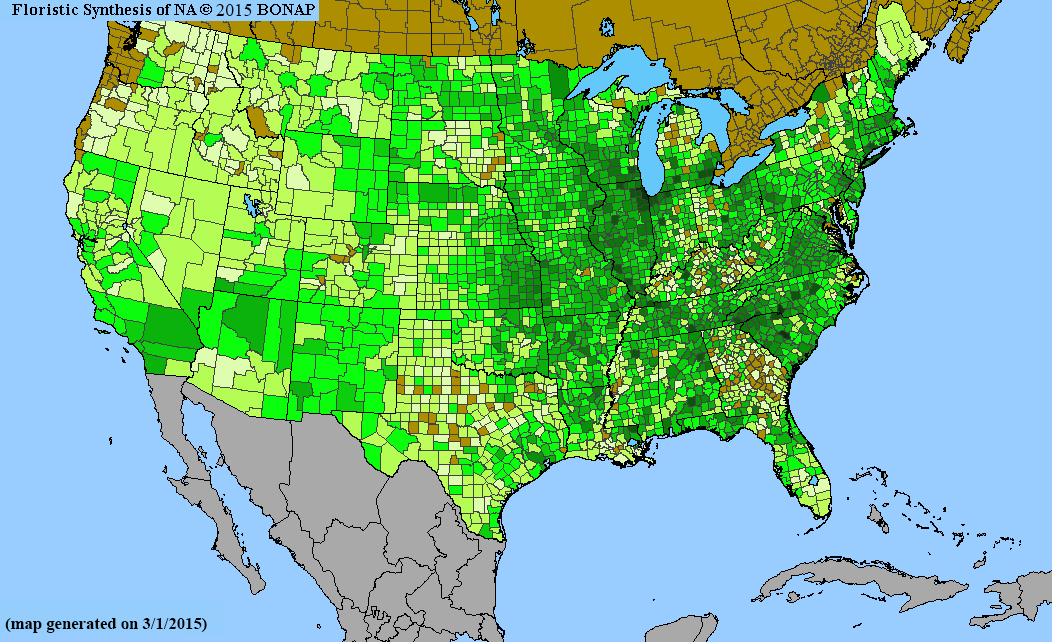
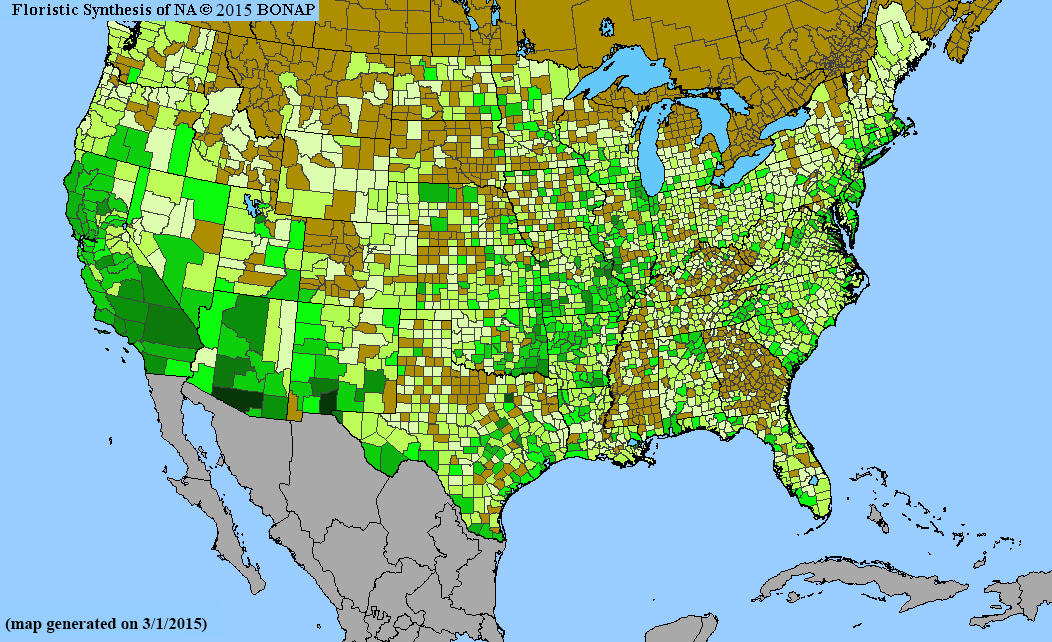
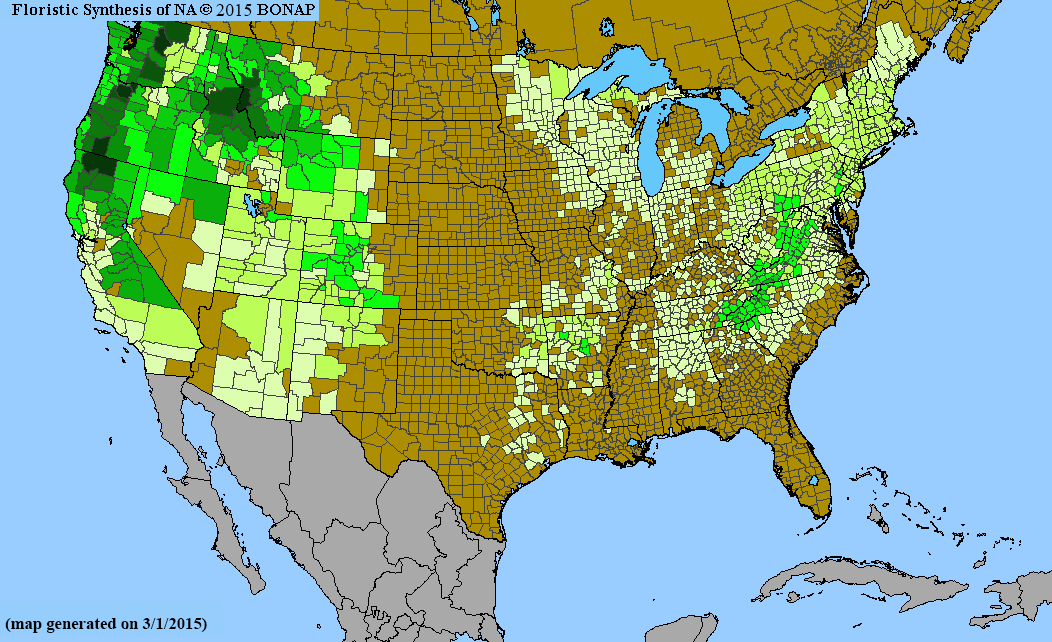
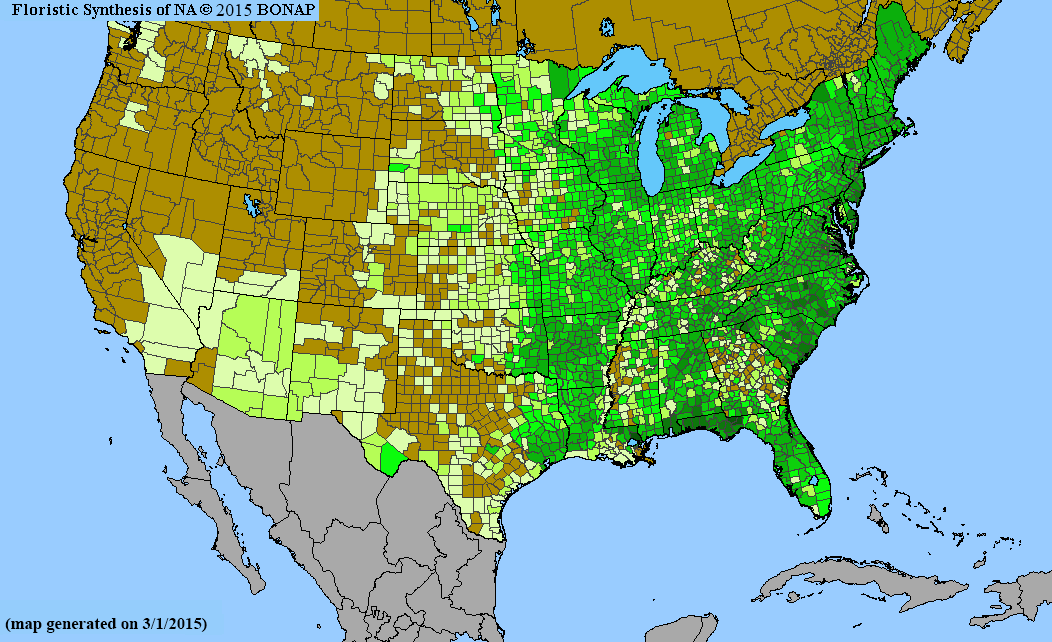
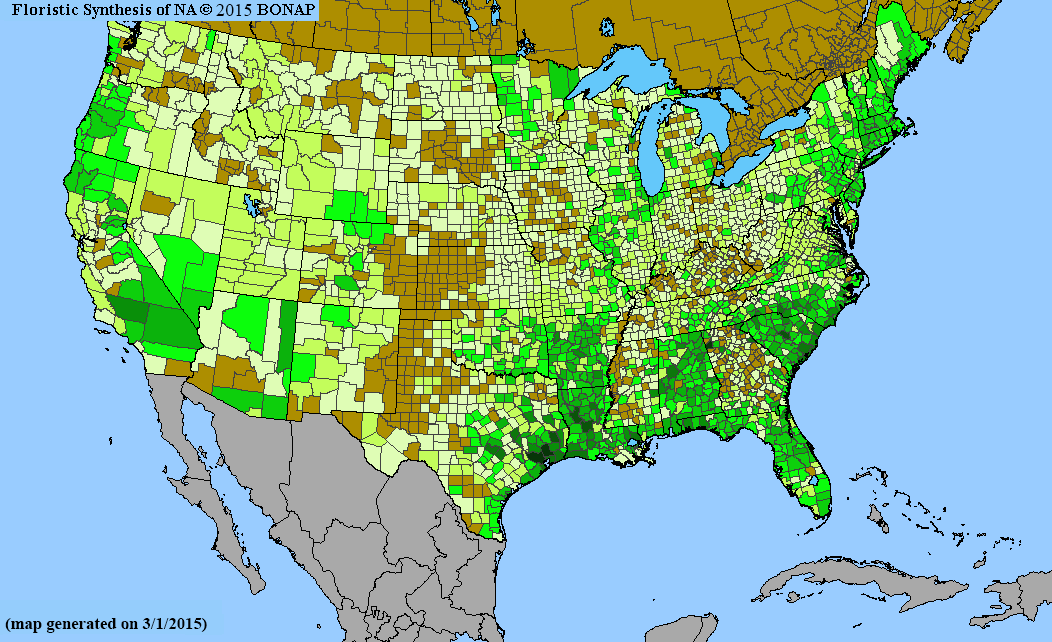
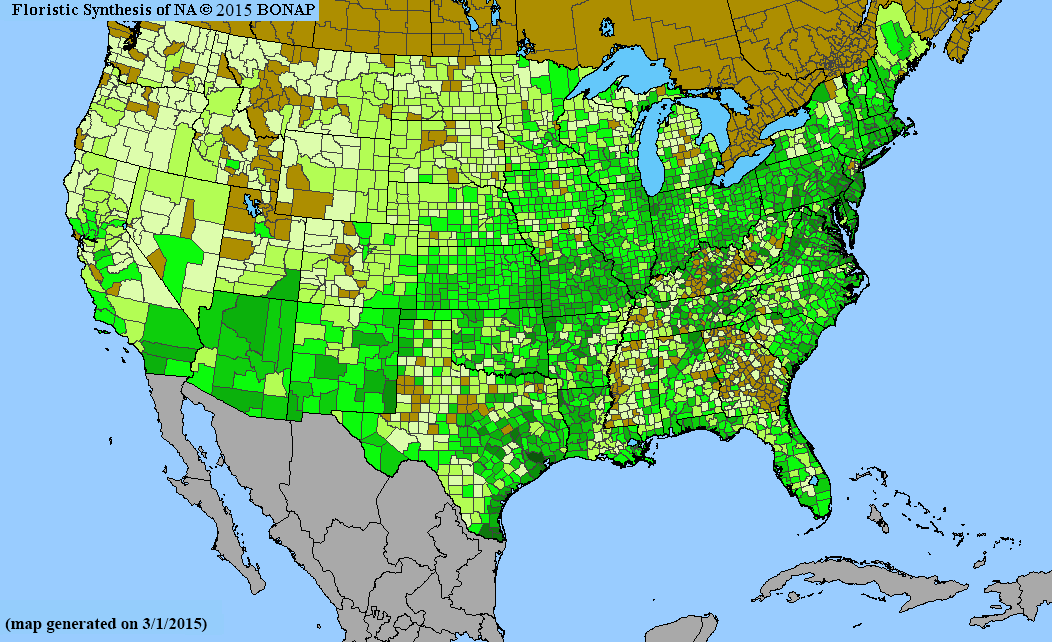
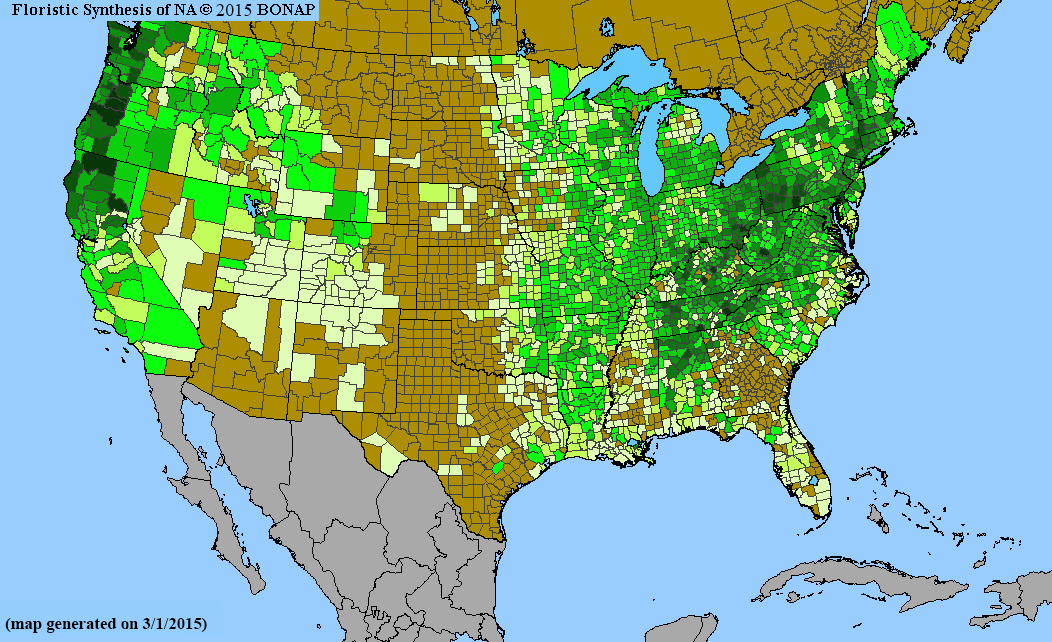
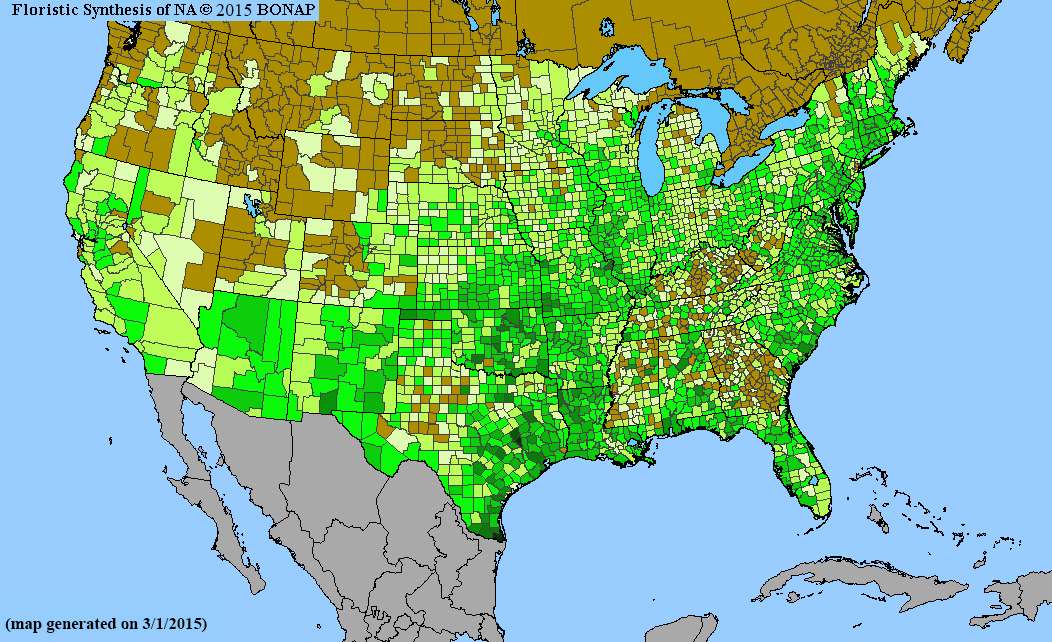
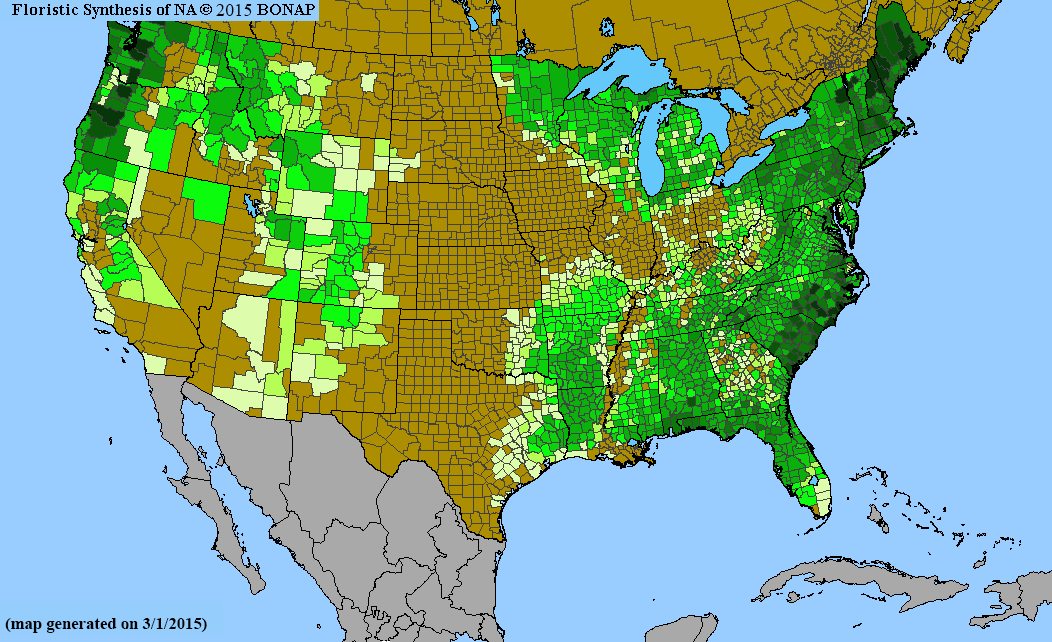
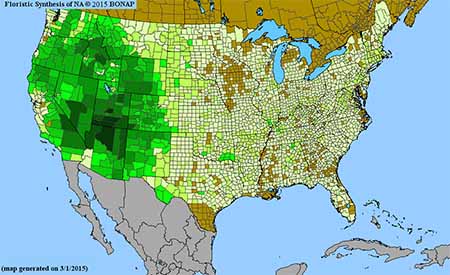
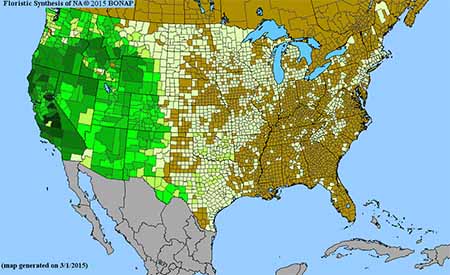
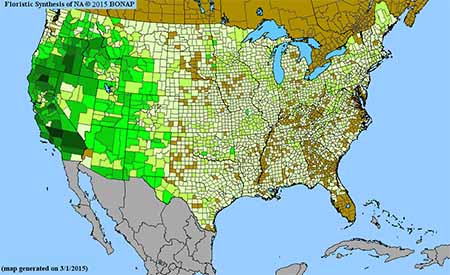
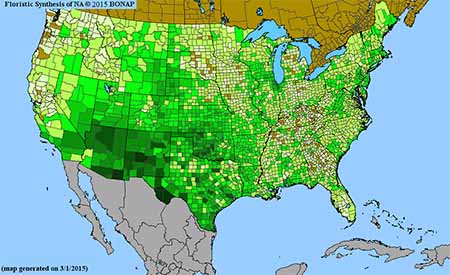
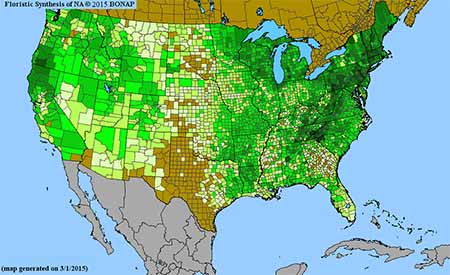
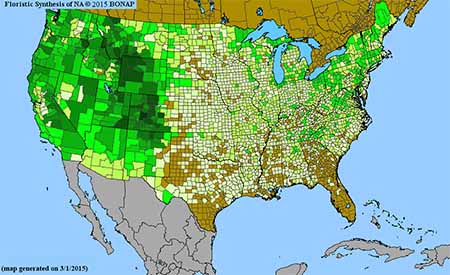
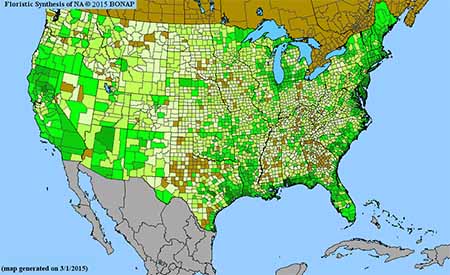
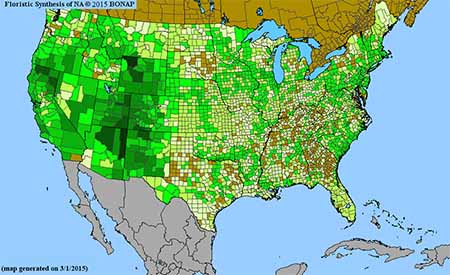
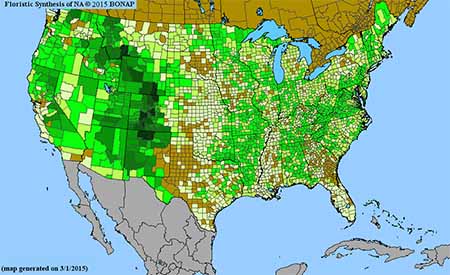
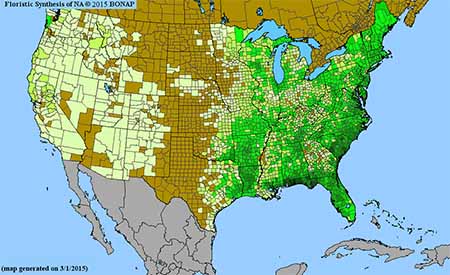
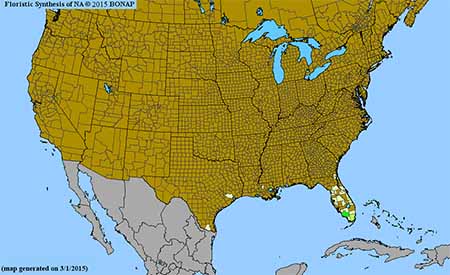
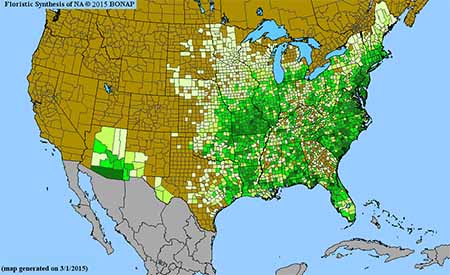
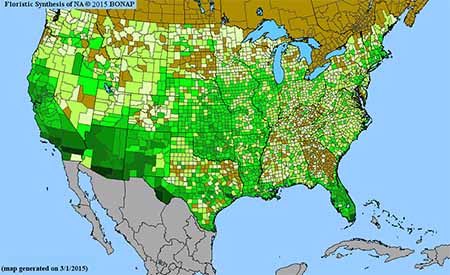
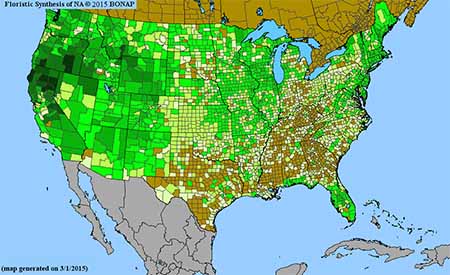
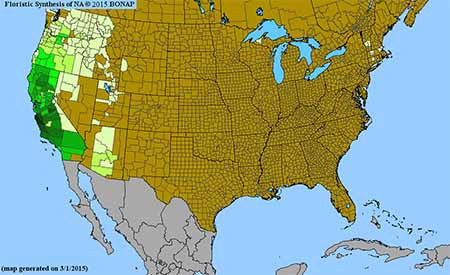
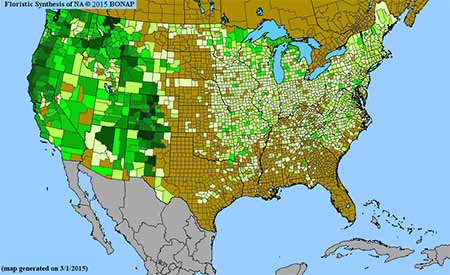
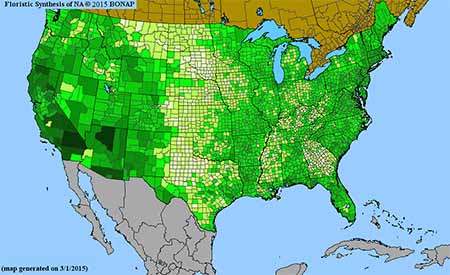
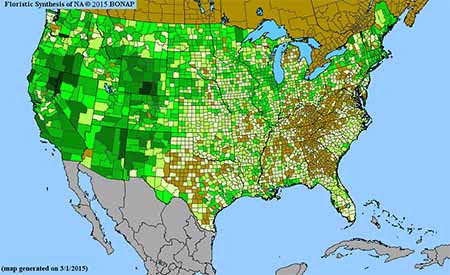
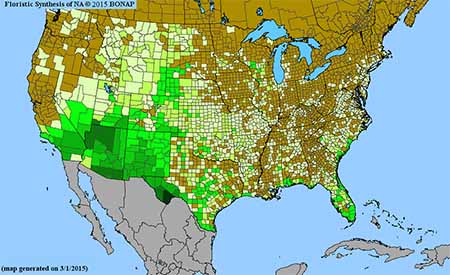
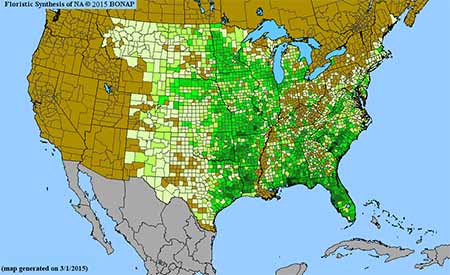
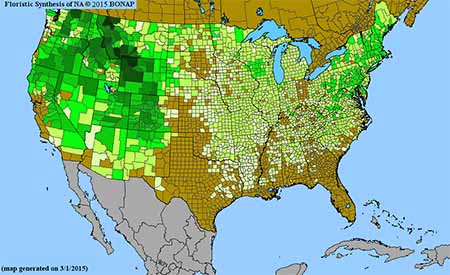
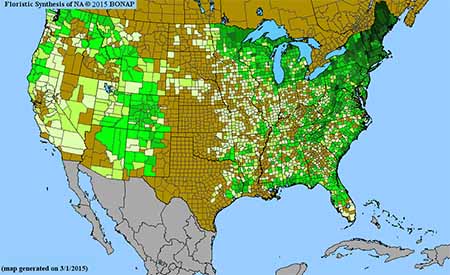
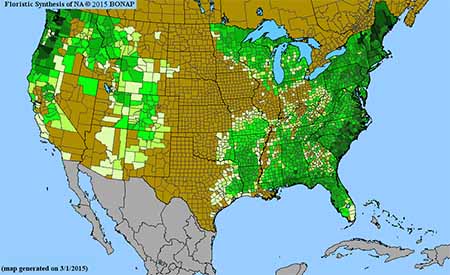
Density gradient of native species for Carex . Darkest green (131 spp. Litchfield County, CT) indicates the highest species concentration. BONAP©2015
|
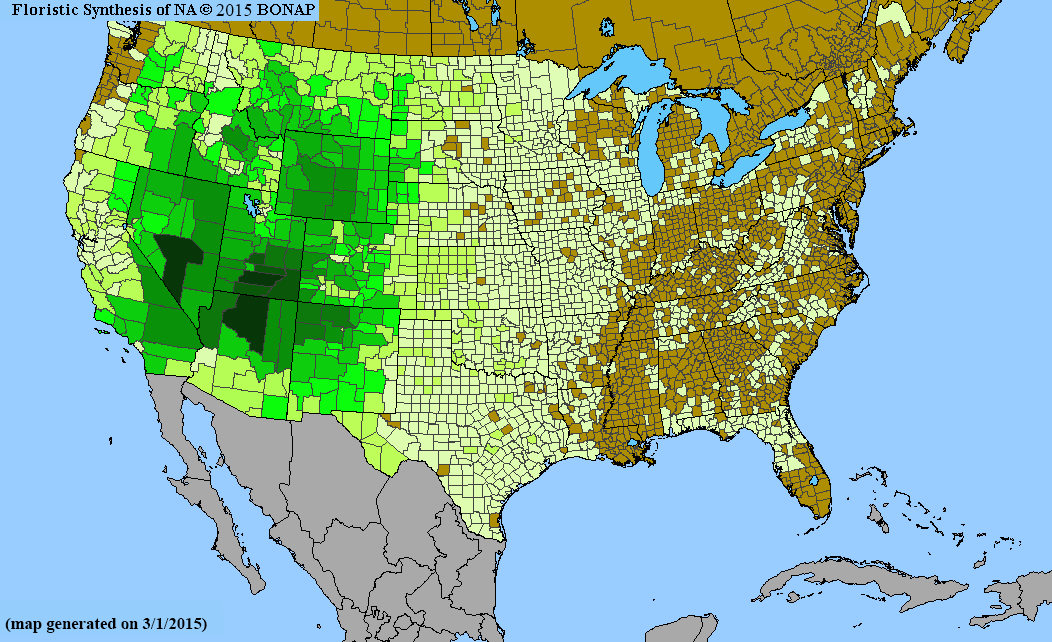
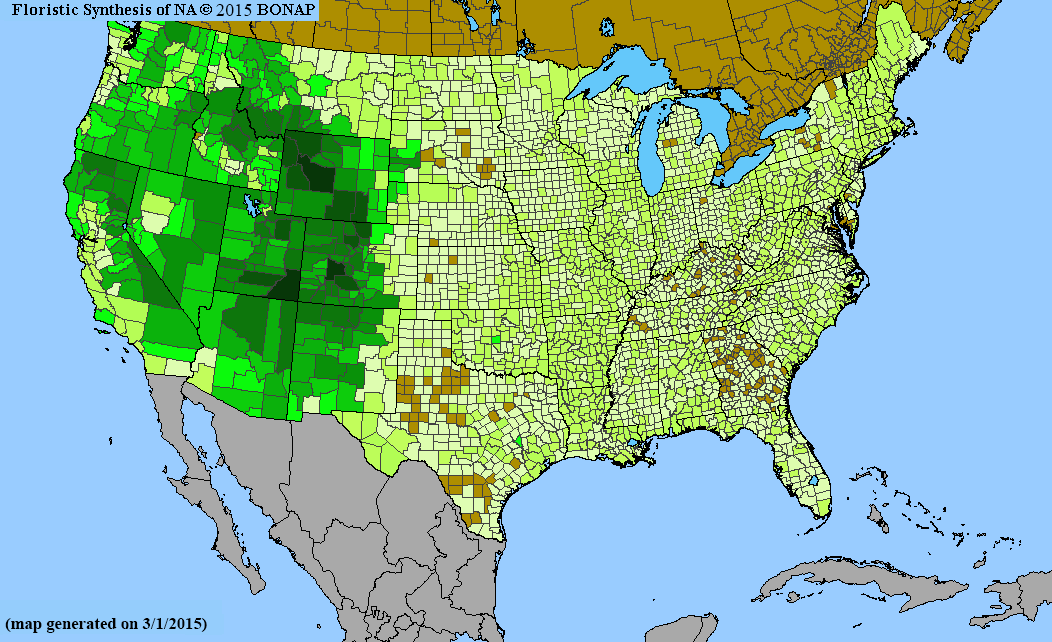
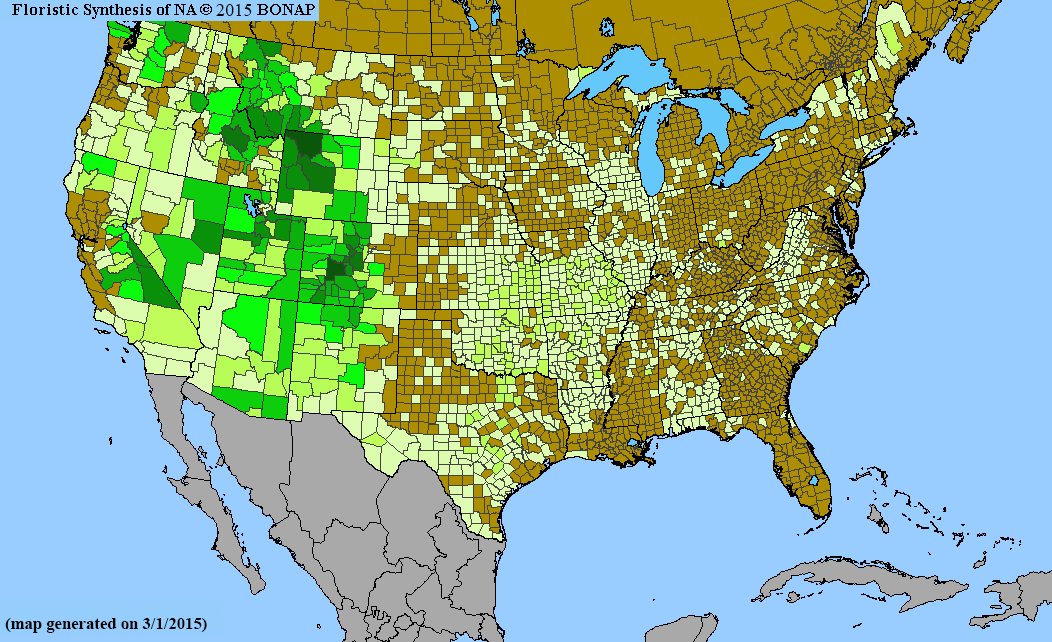
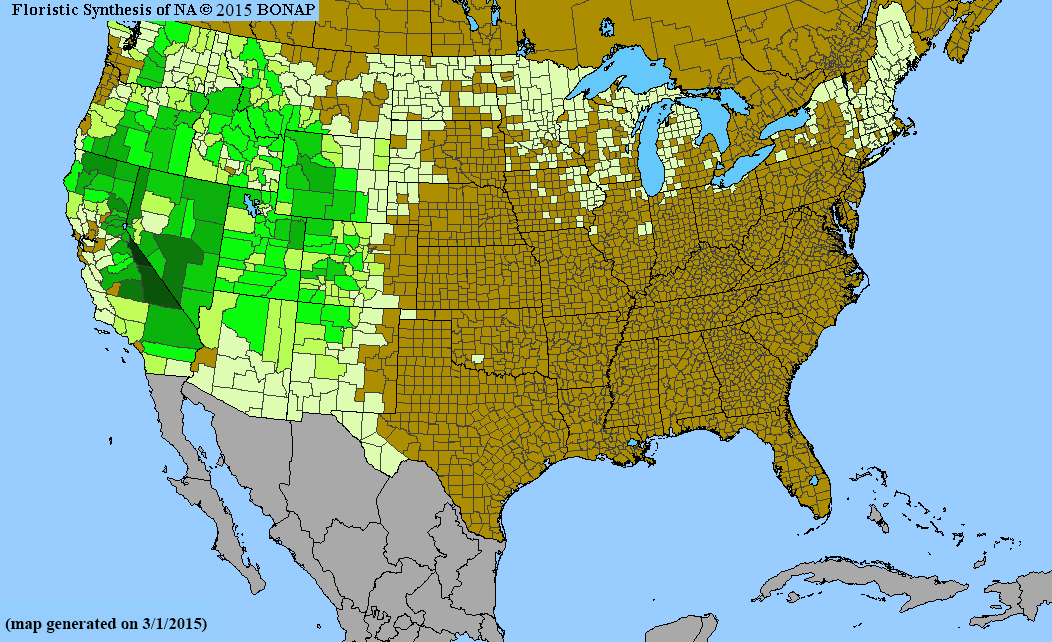
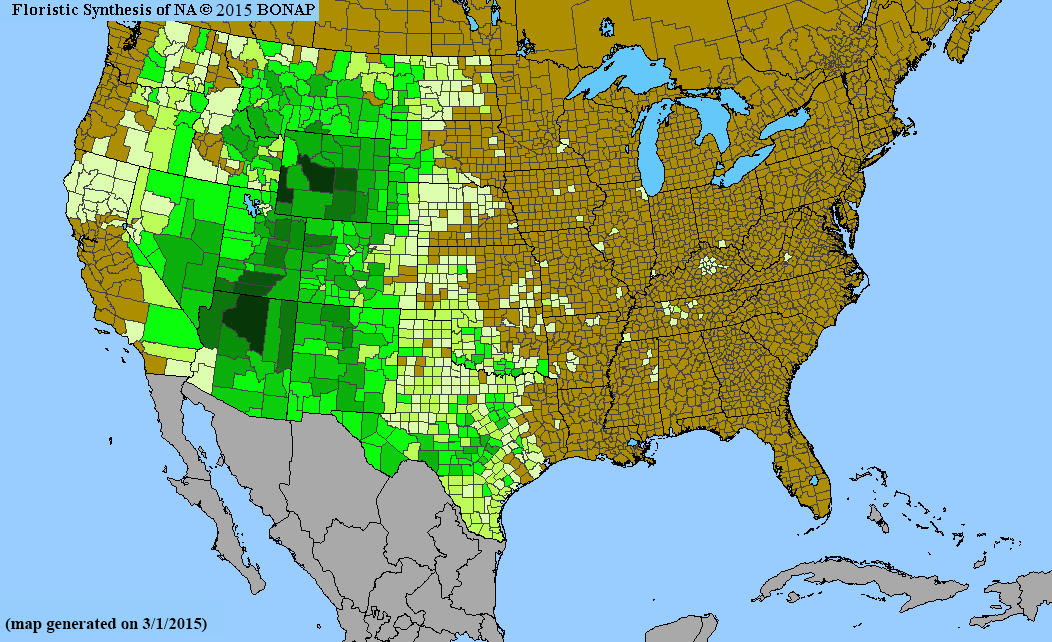
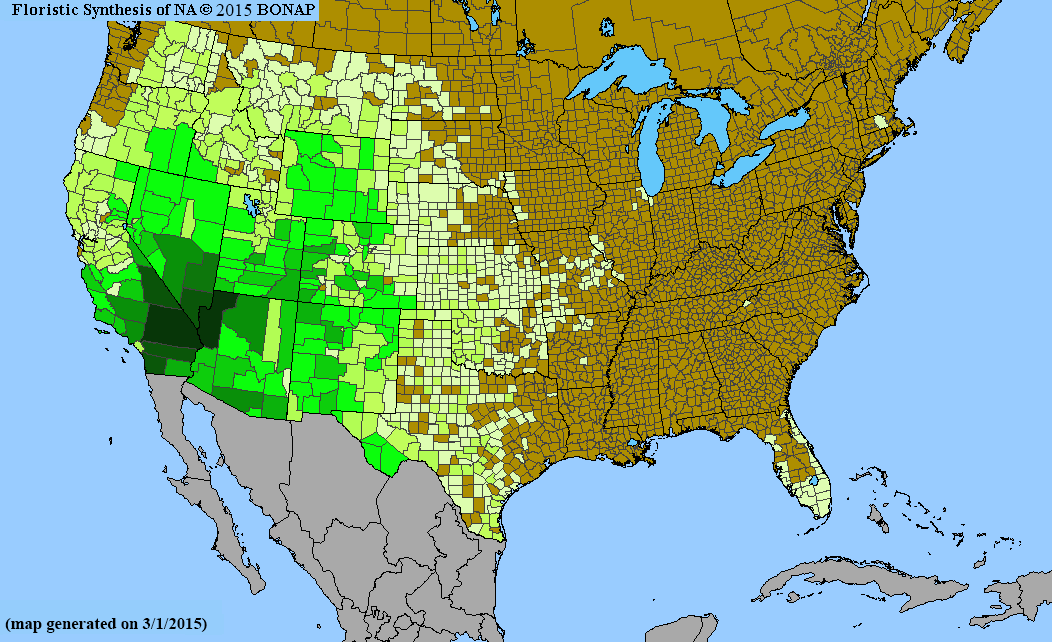
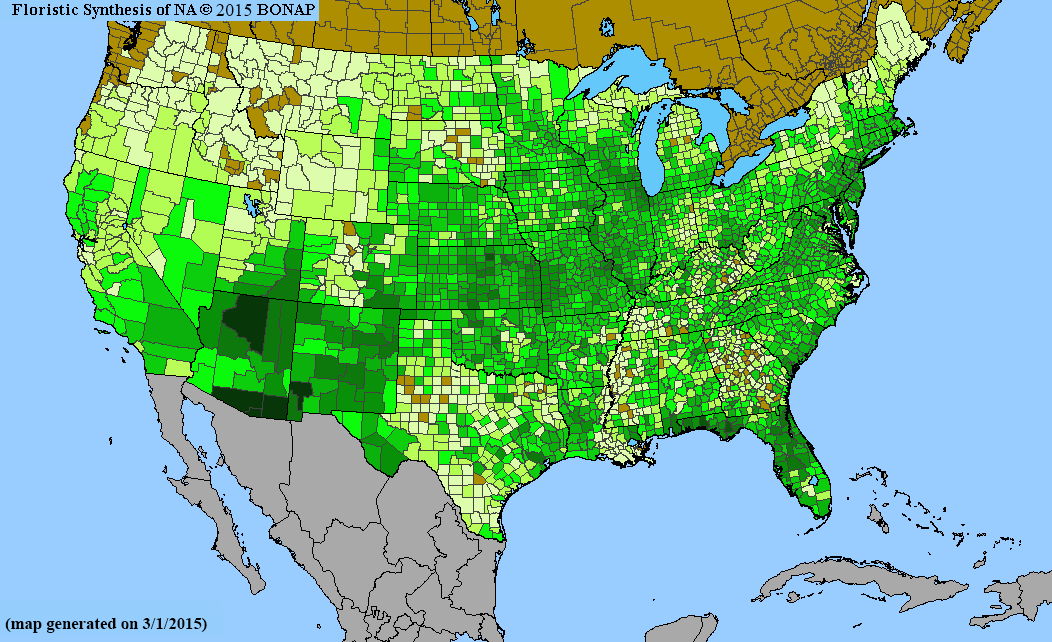
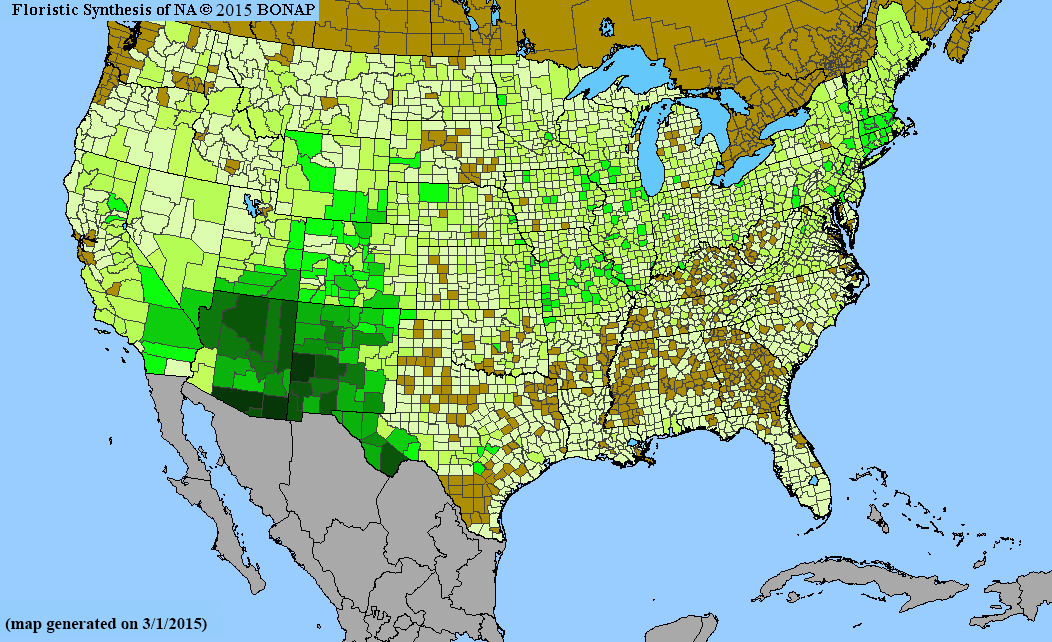
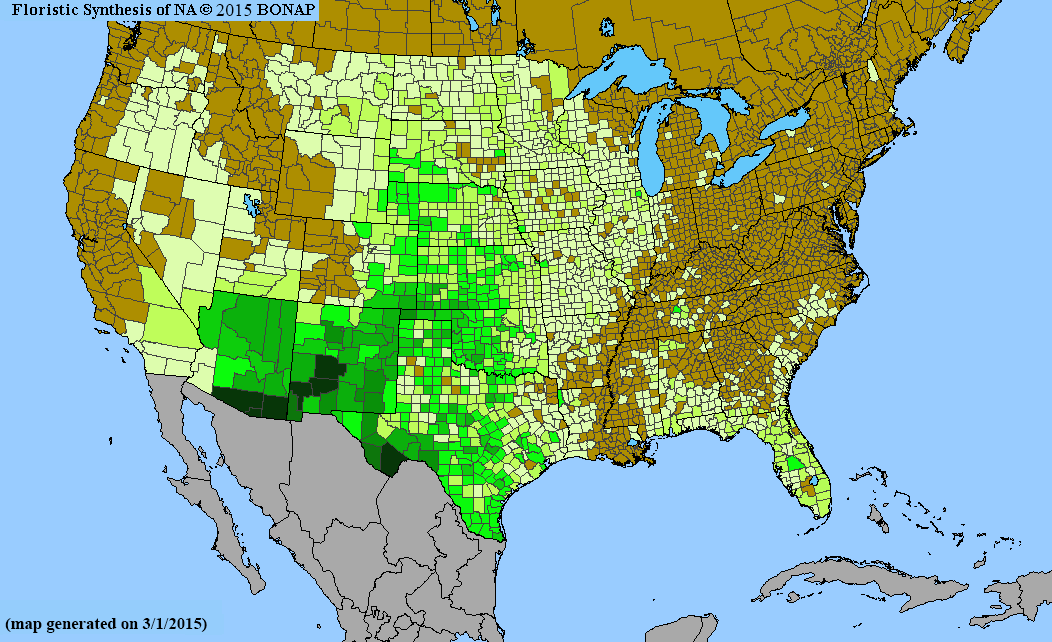
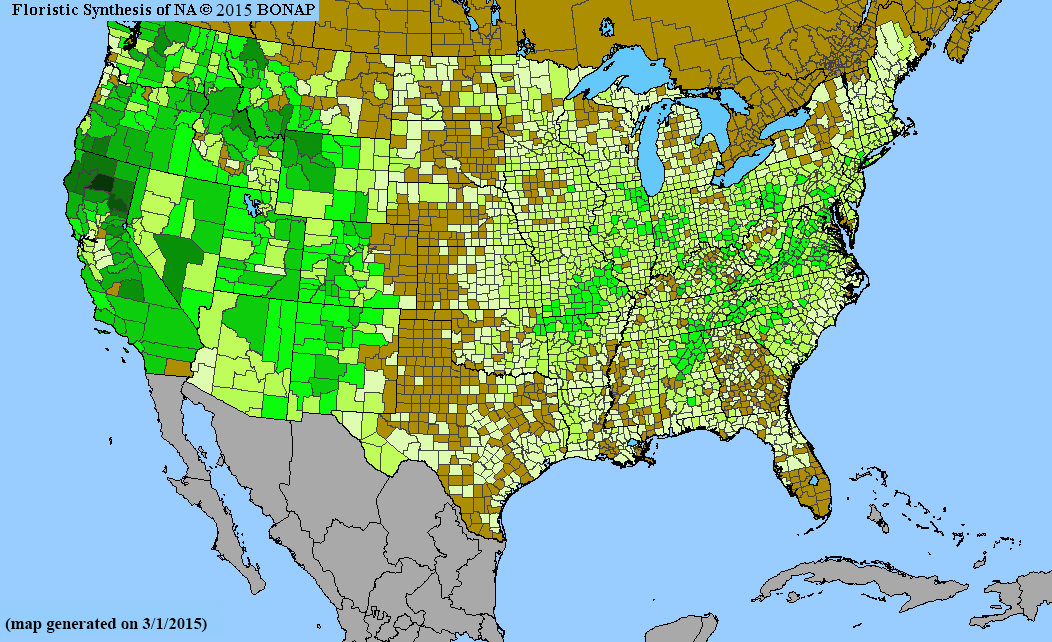
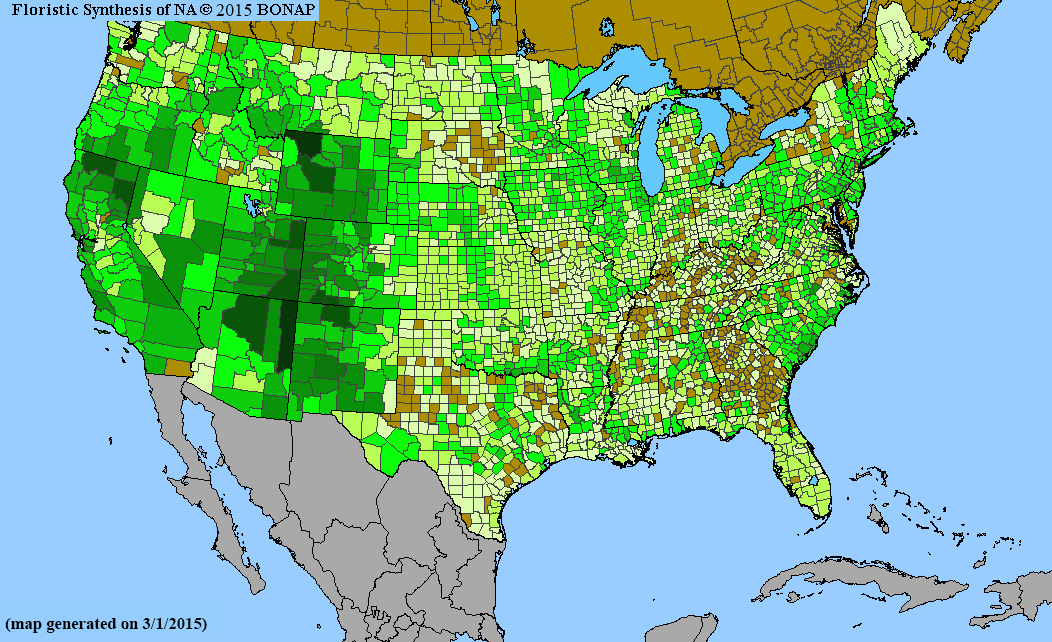
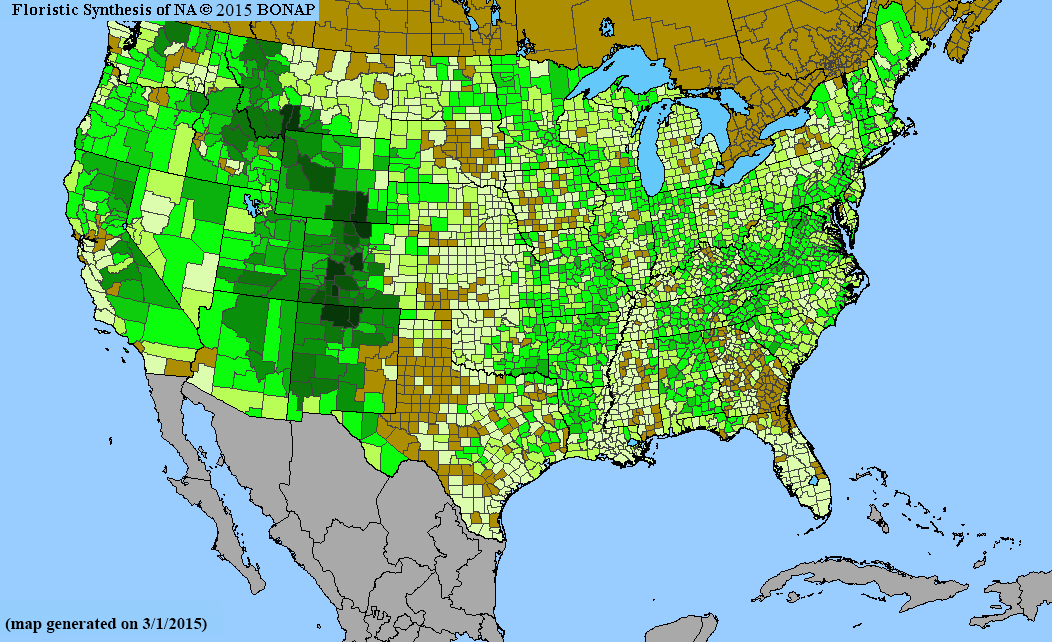
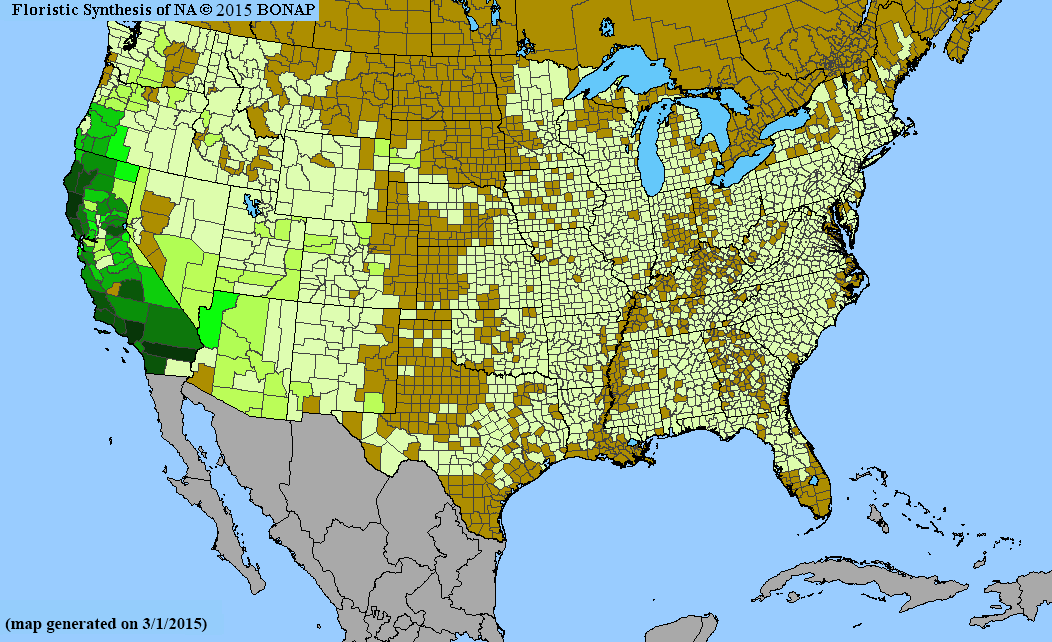
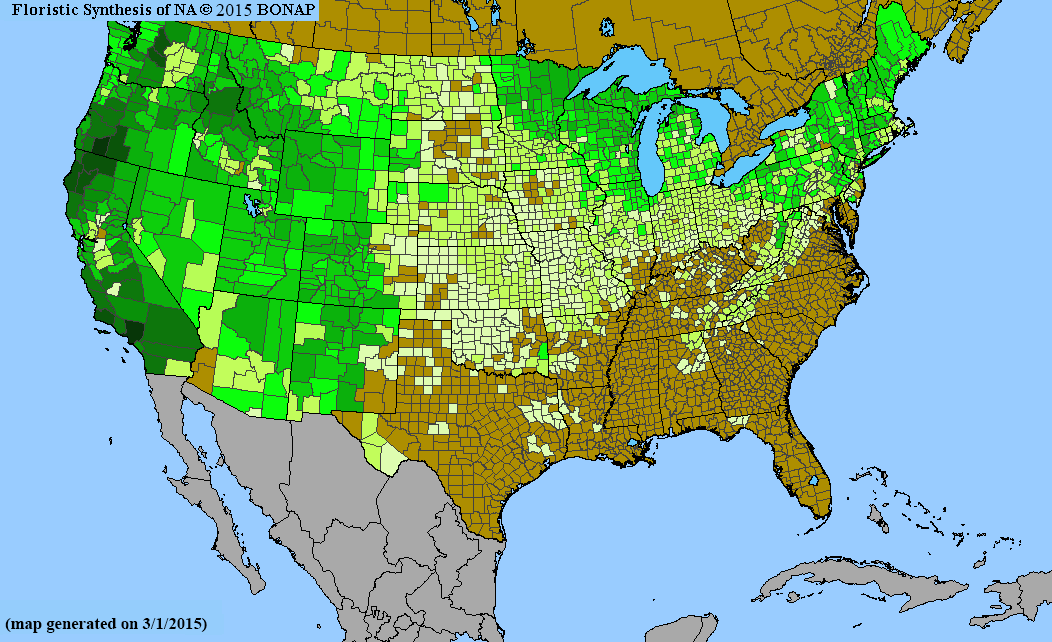
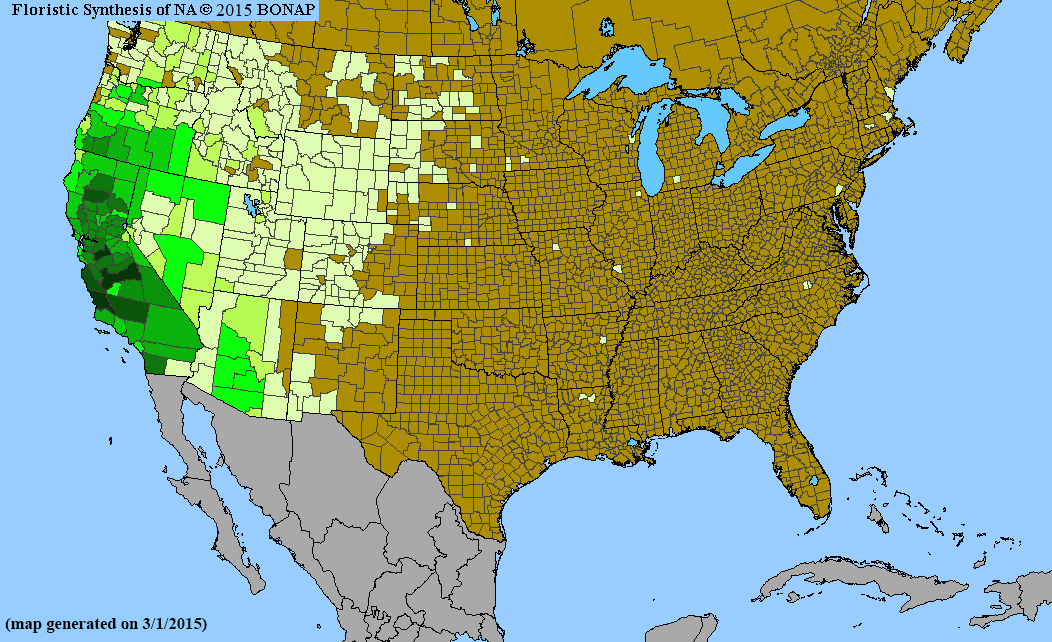
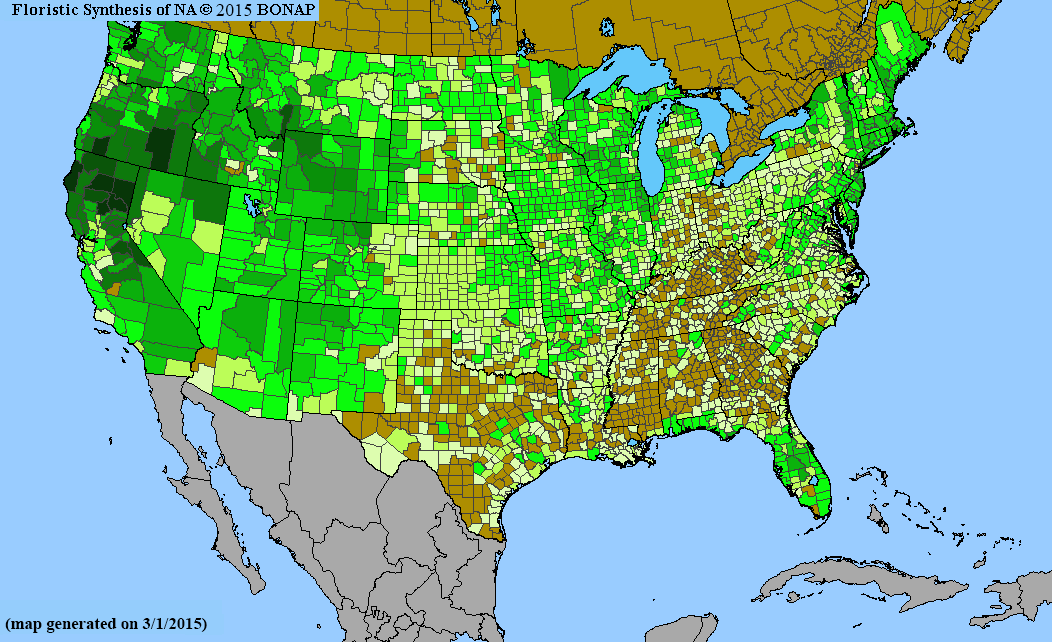
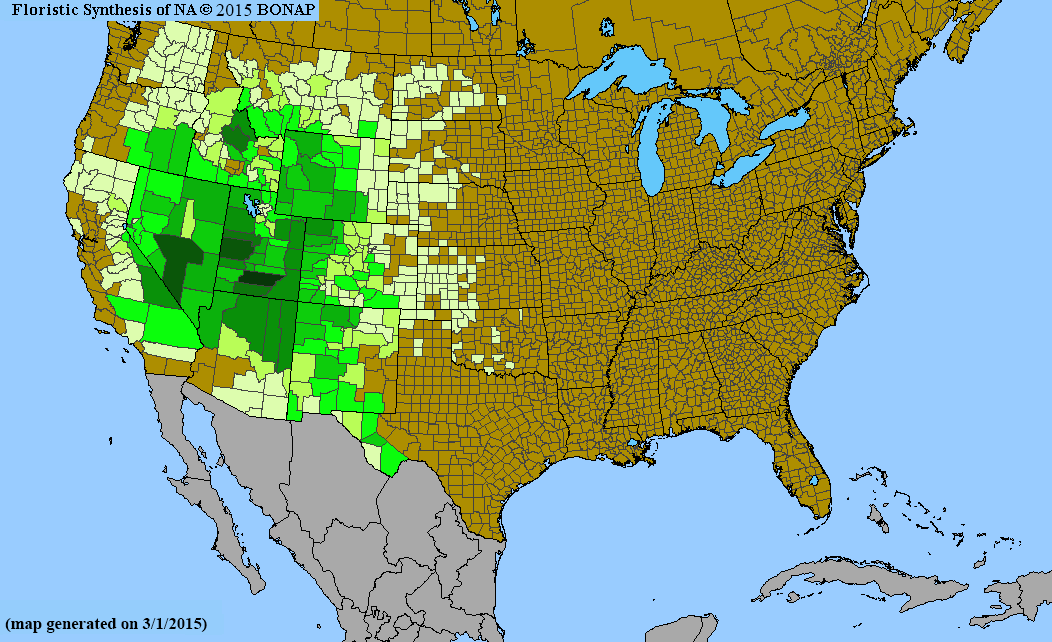
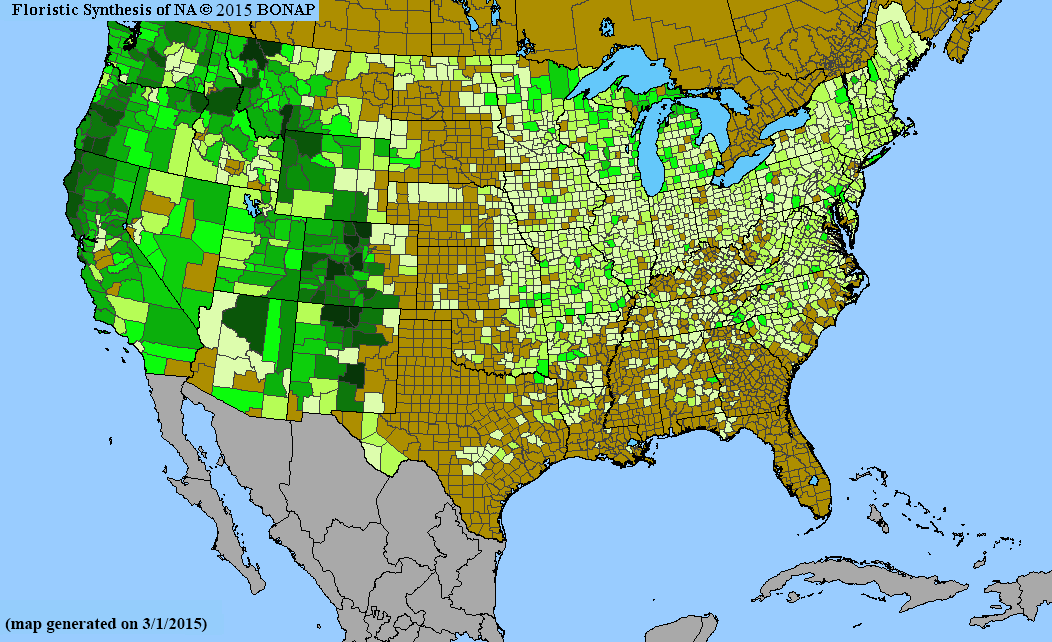
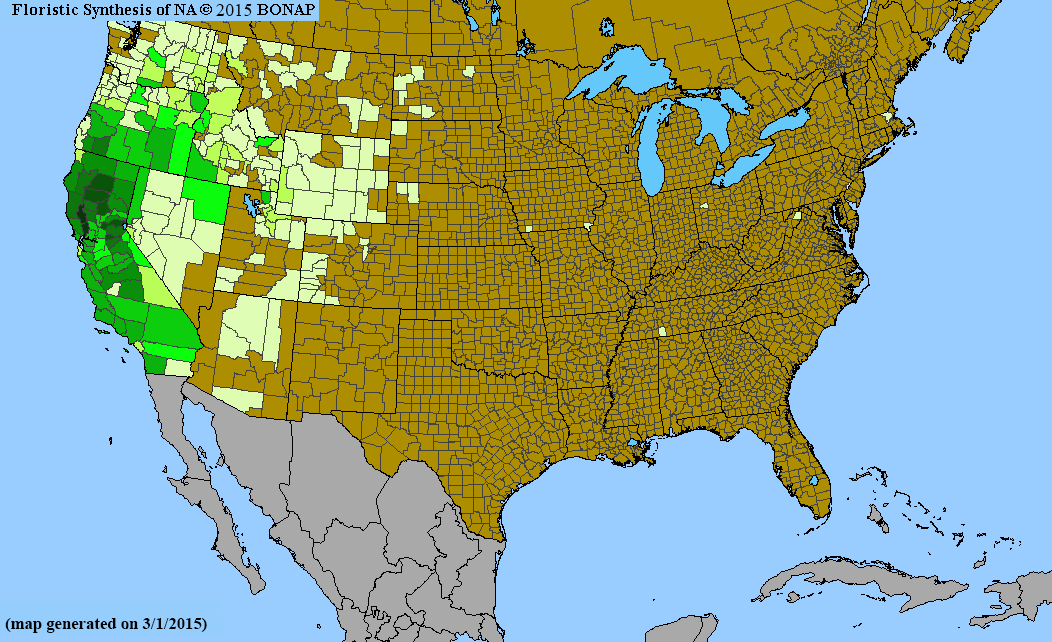
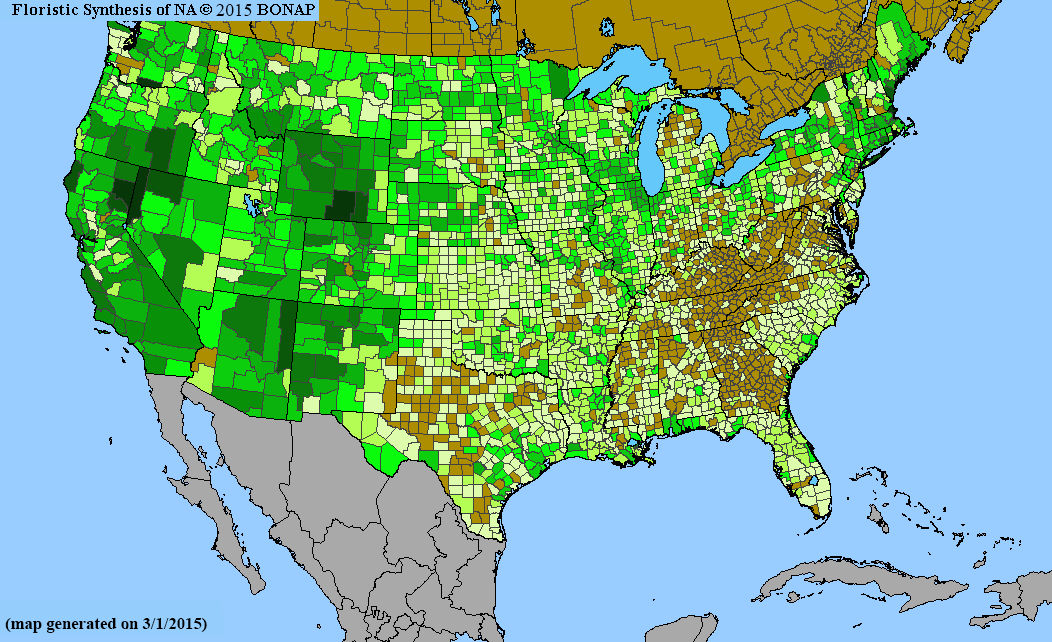
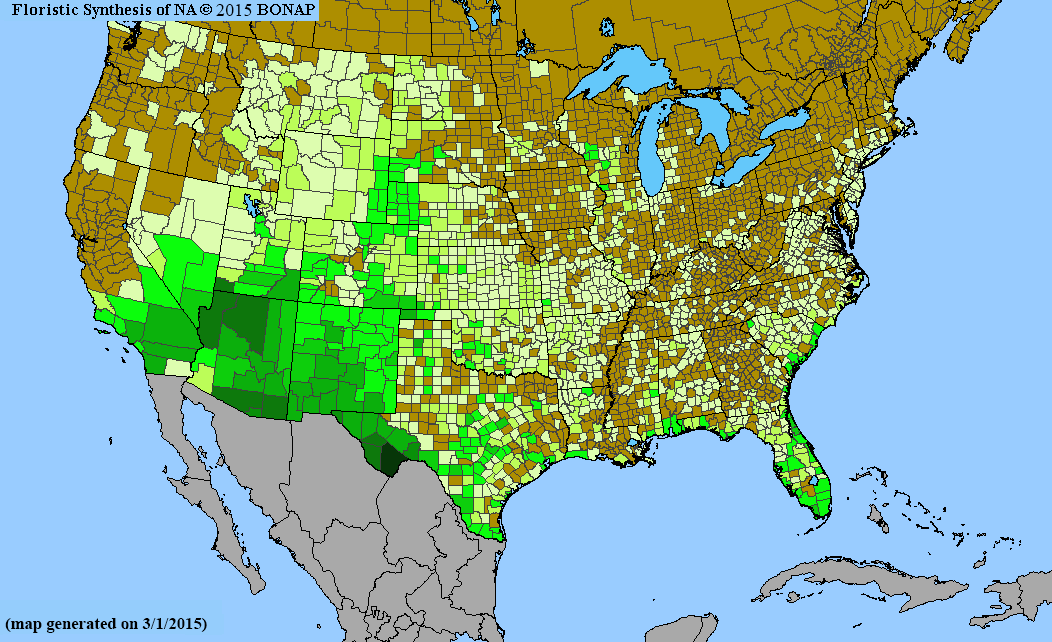
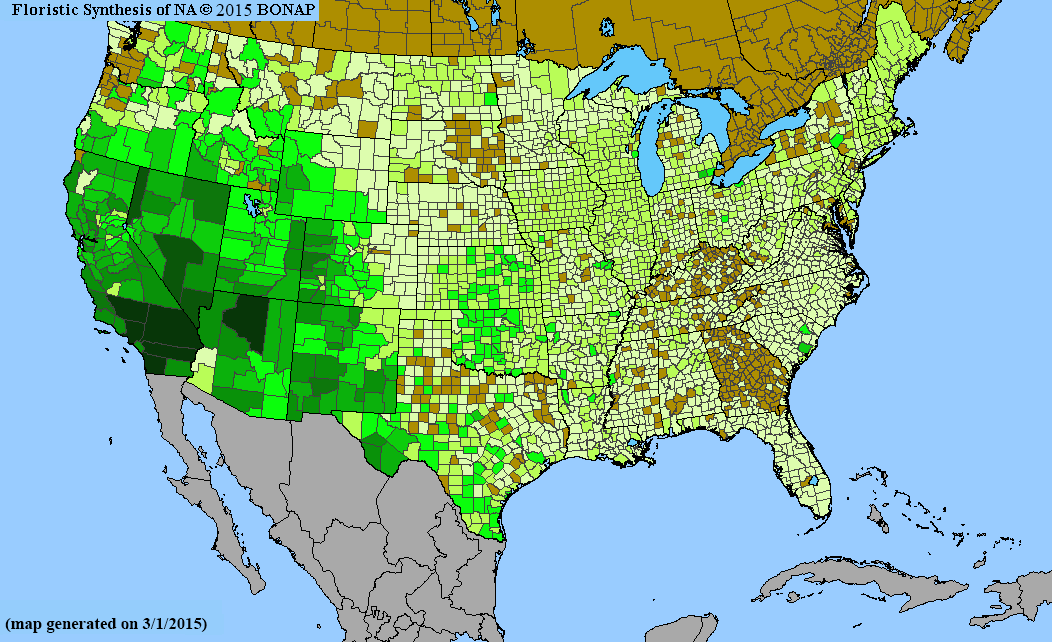
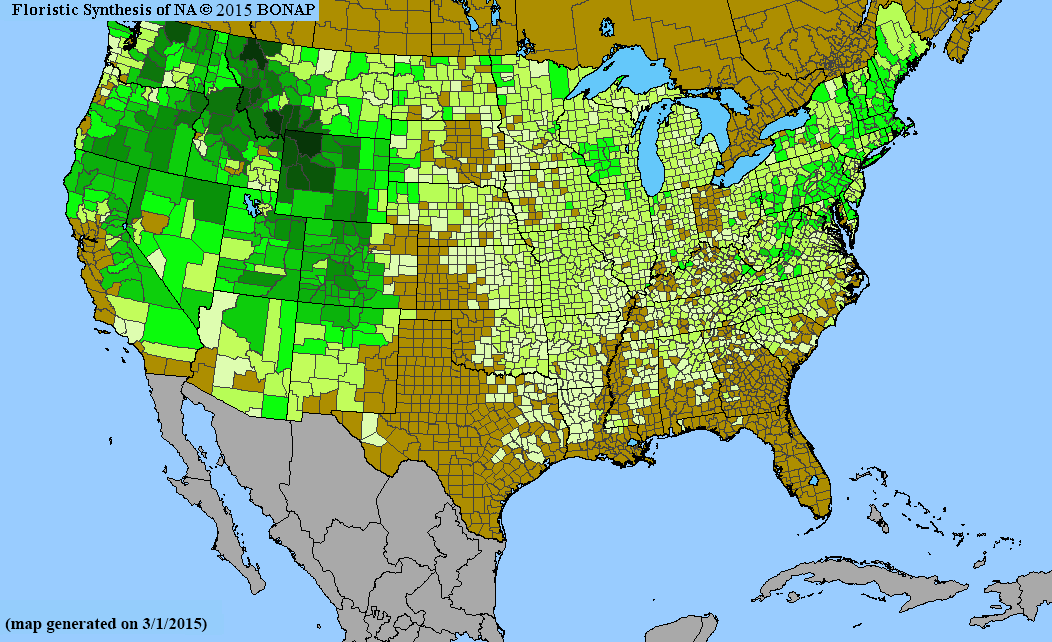
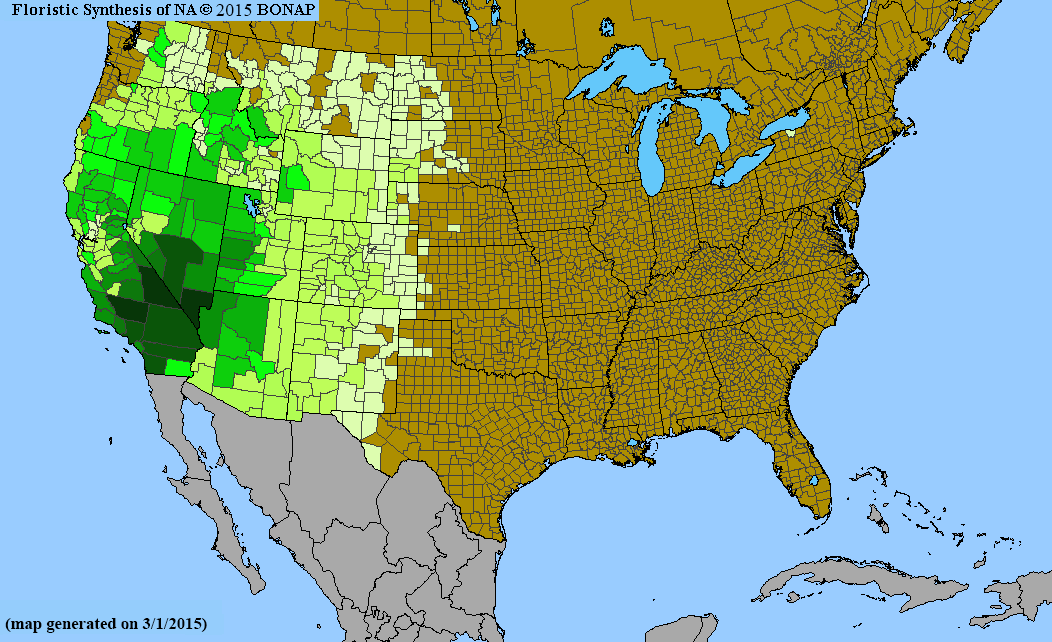
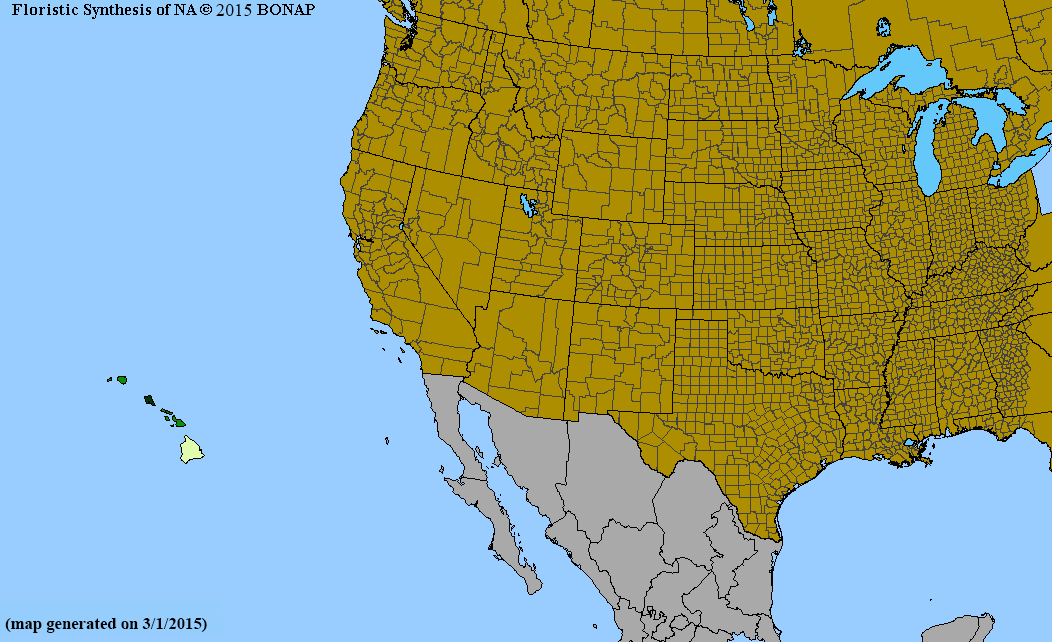
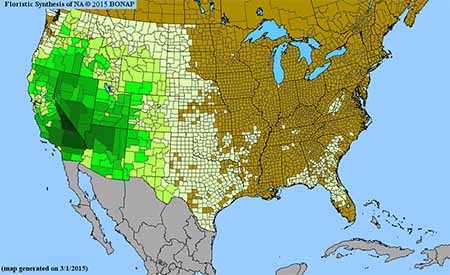
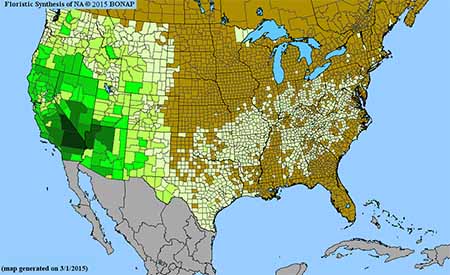
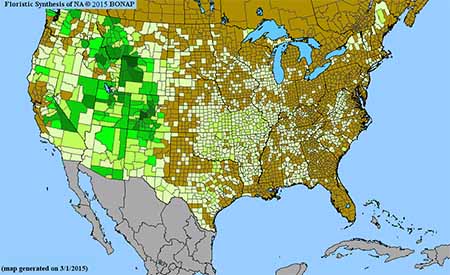
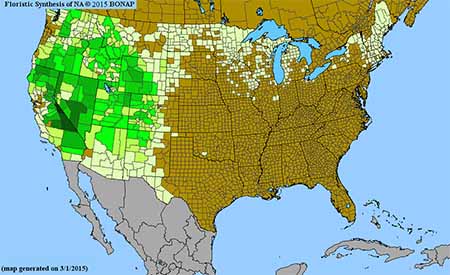
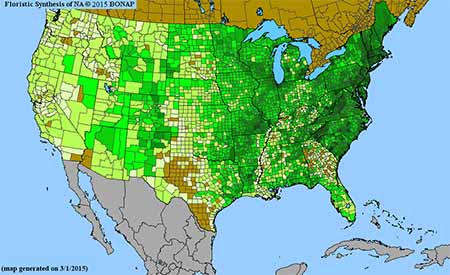
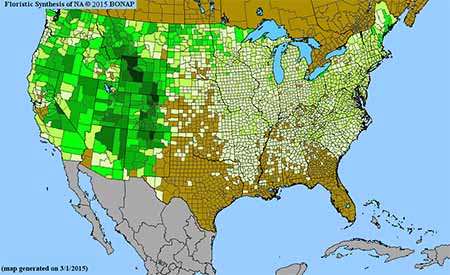
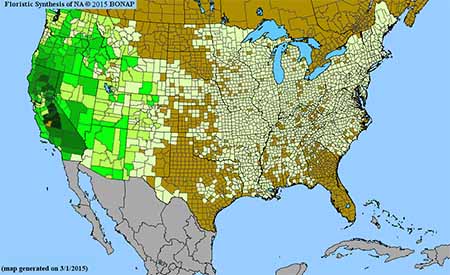
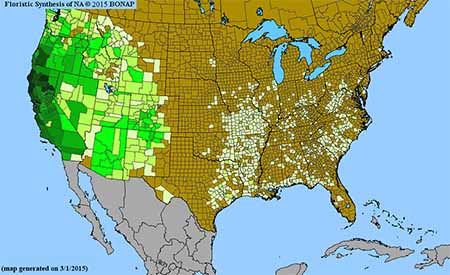
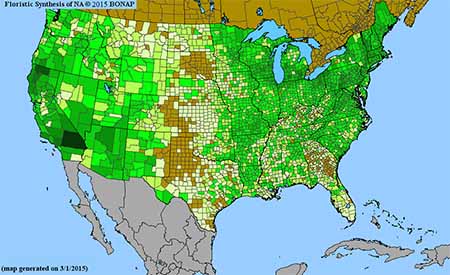
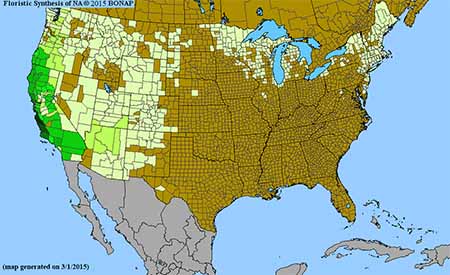
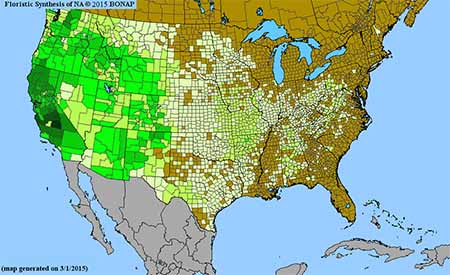
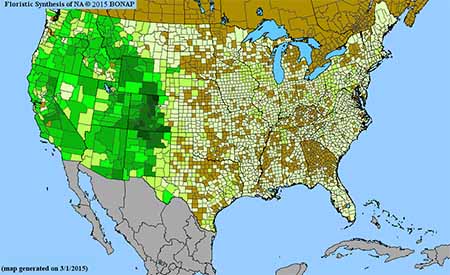
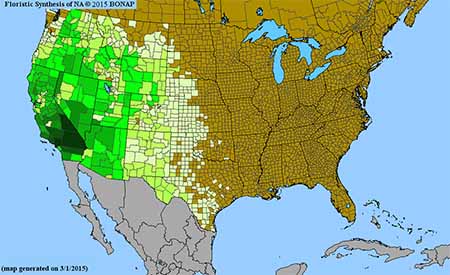
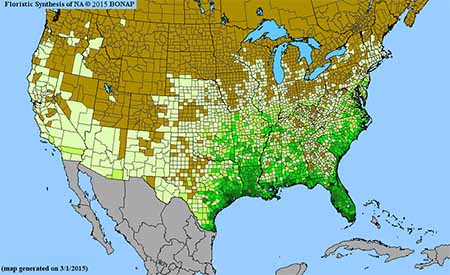
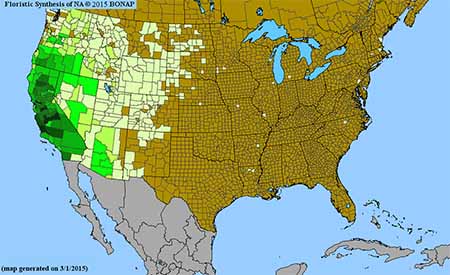
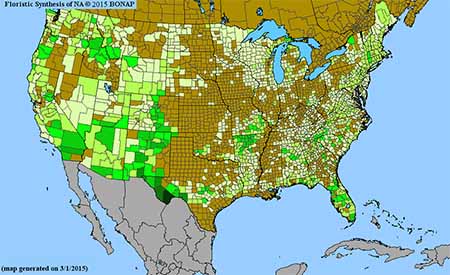
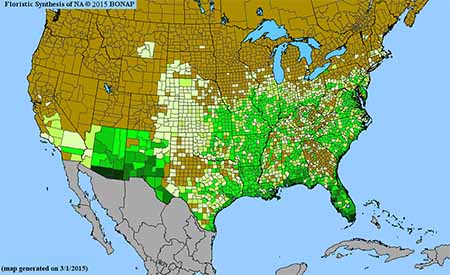
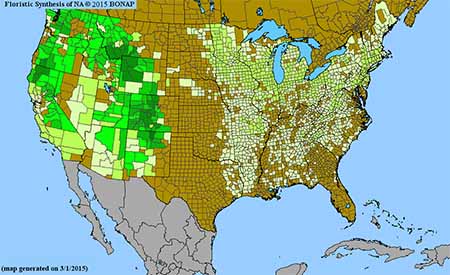
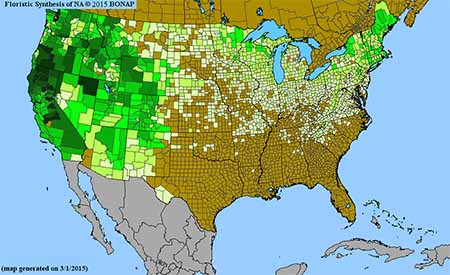
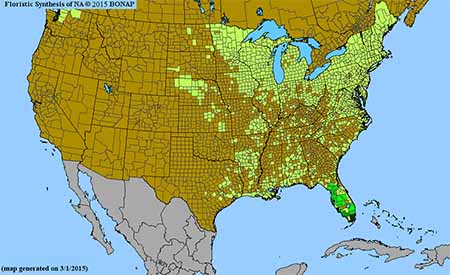
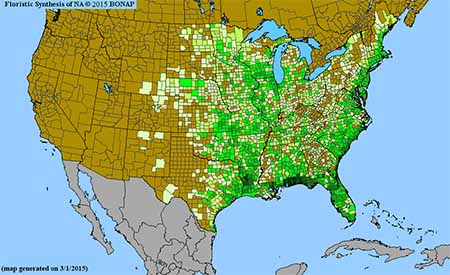
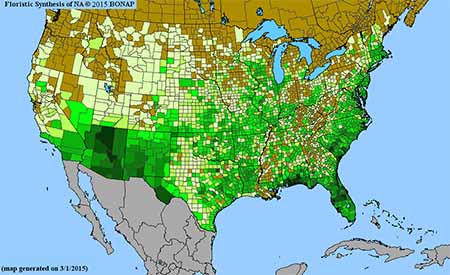
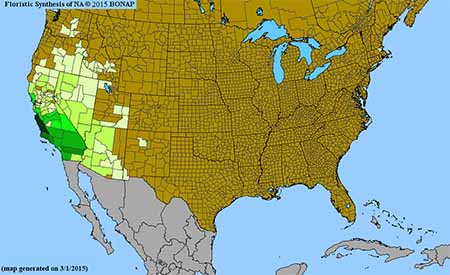
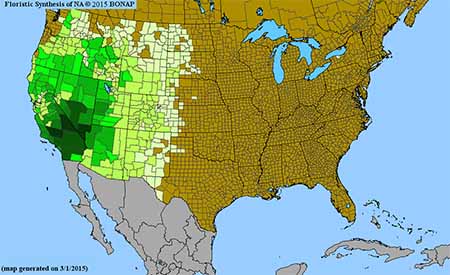
Density gradient of native species for Astragalus . Darkest green (59 spp. Garfield County, UT) indicates the highest species concentration. BONAP©2015
|
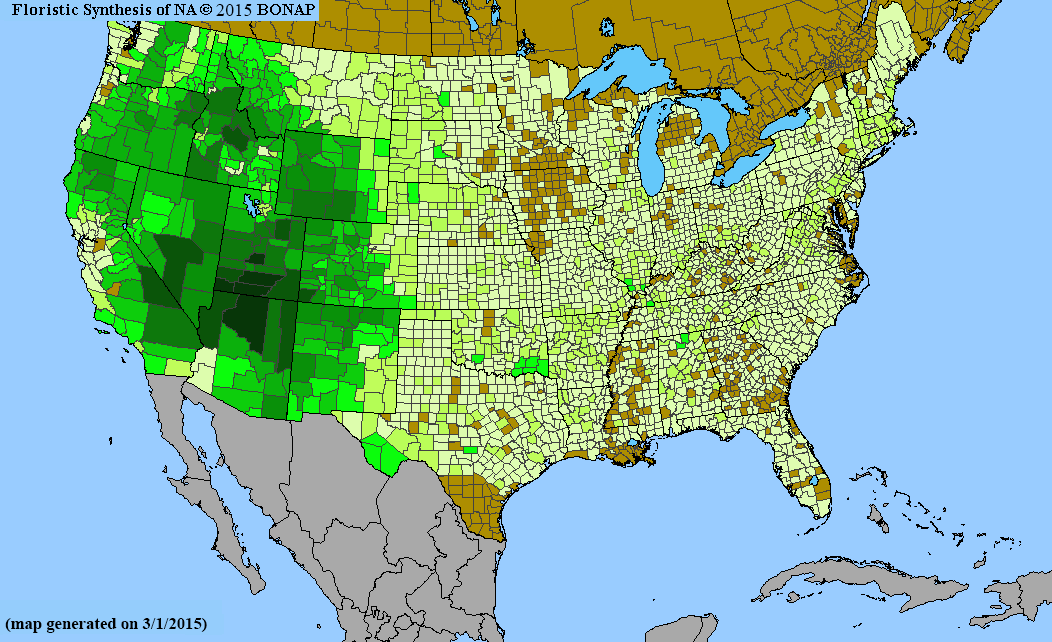
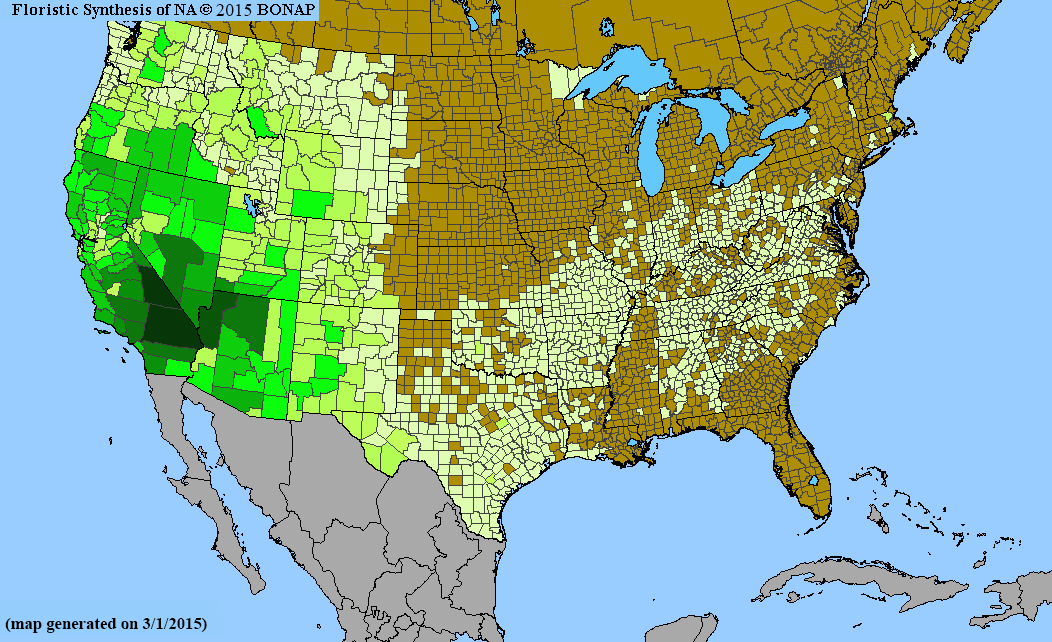
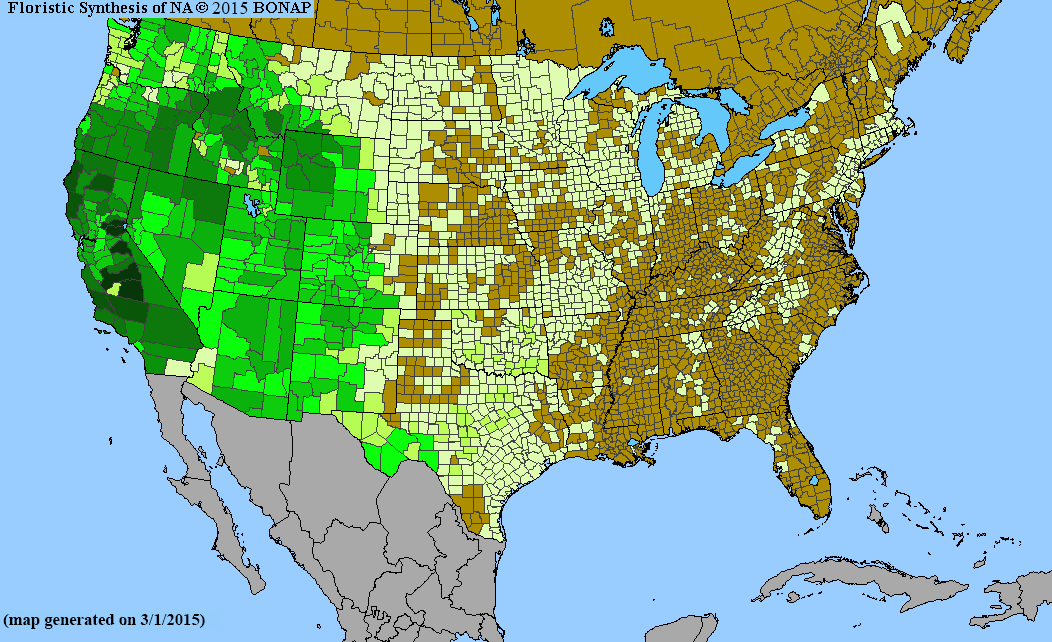
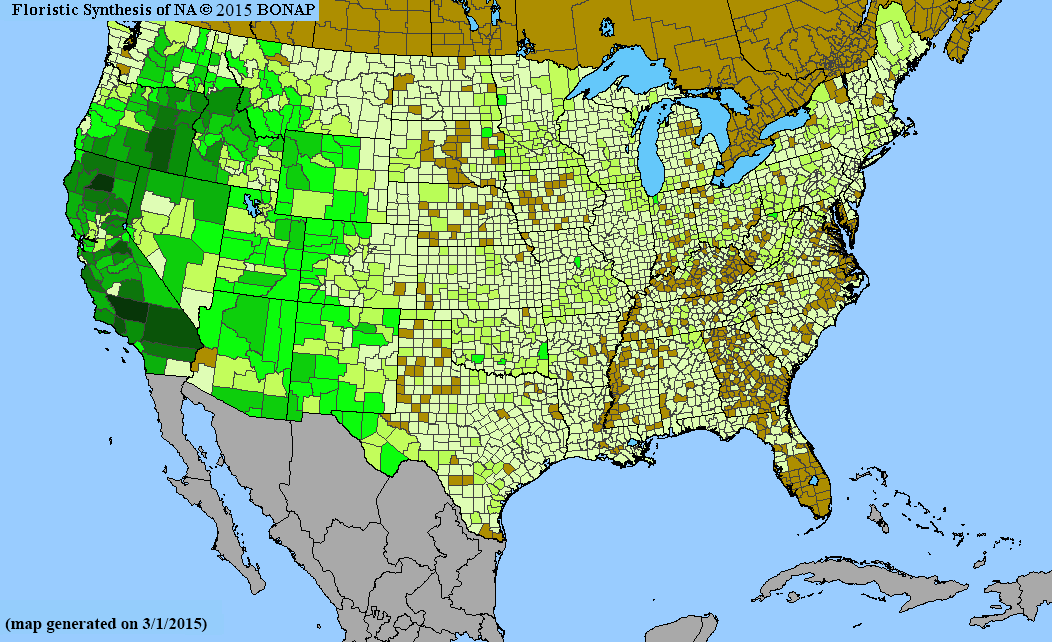
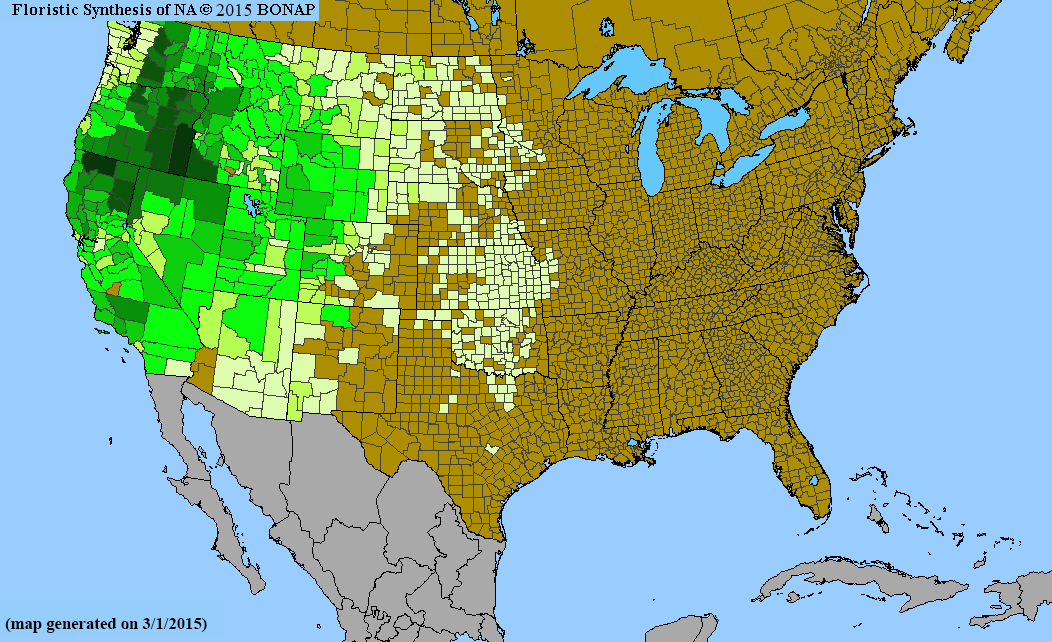
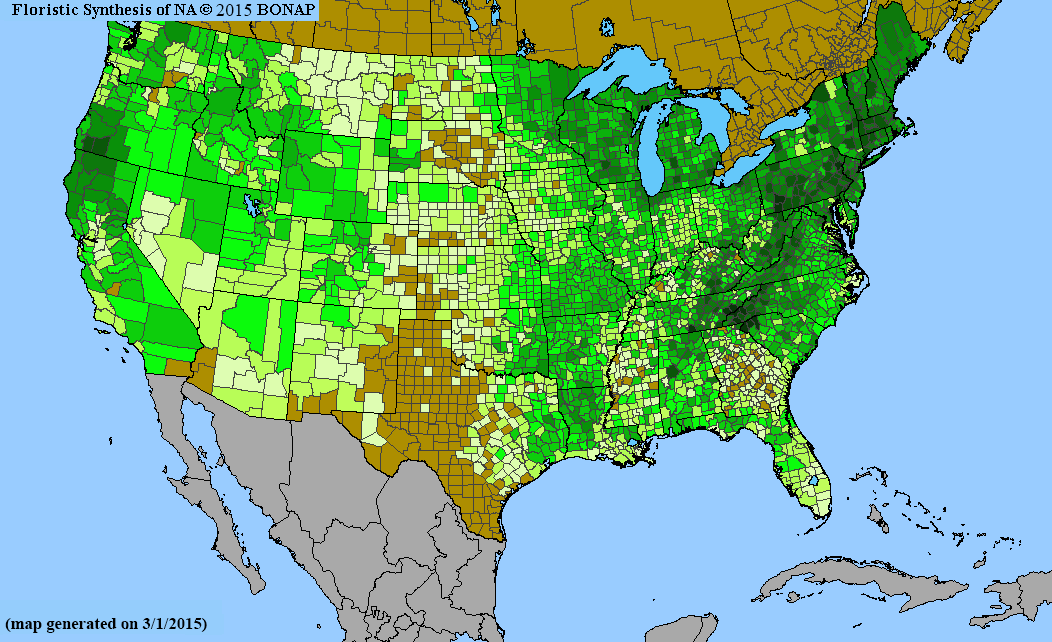
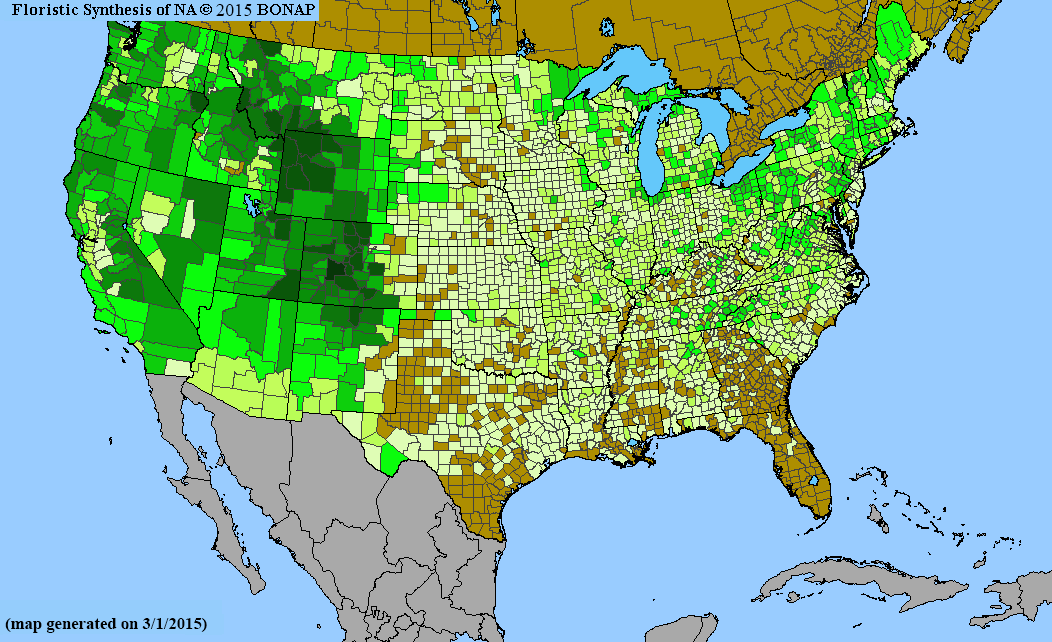
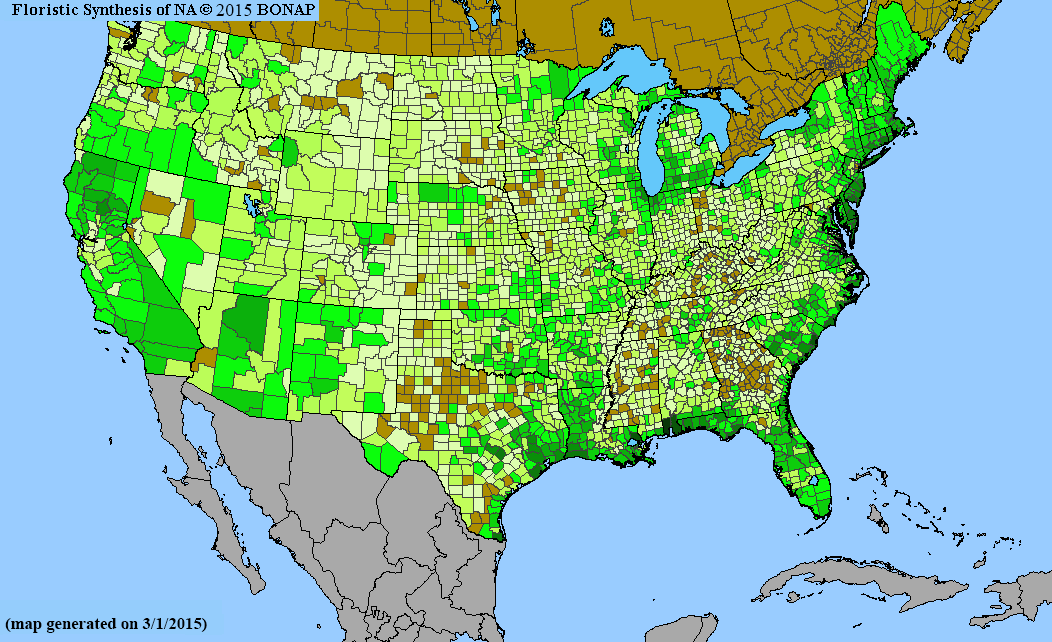
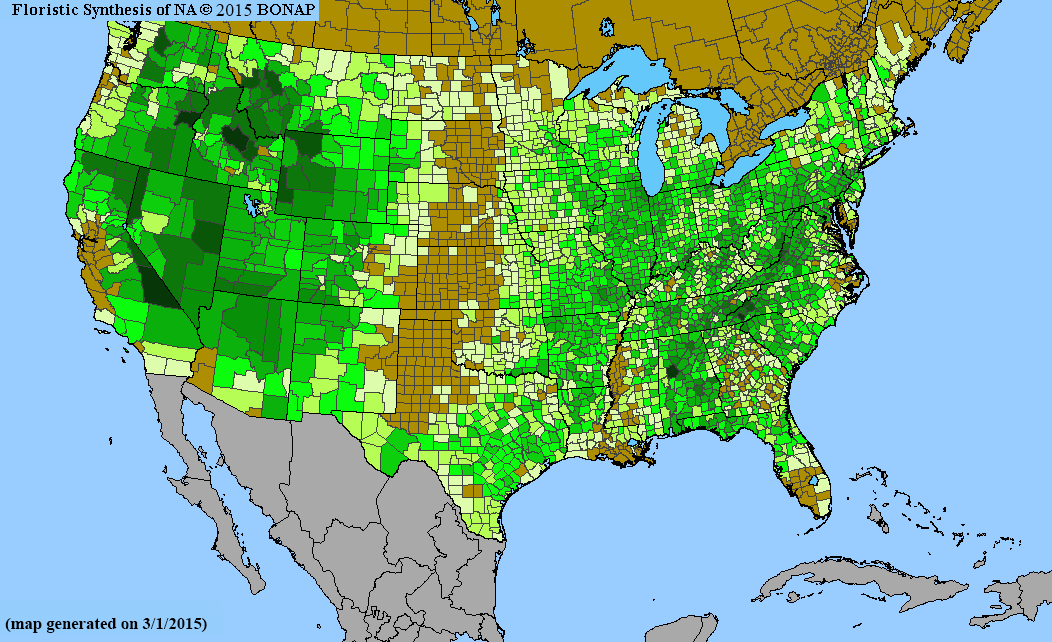
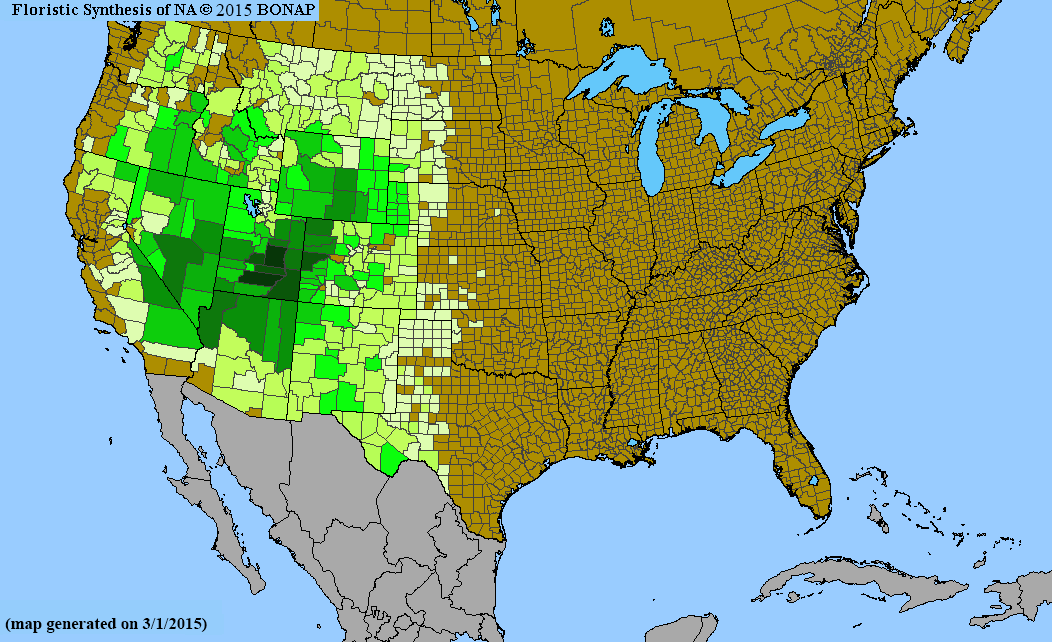
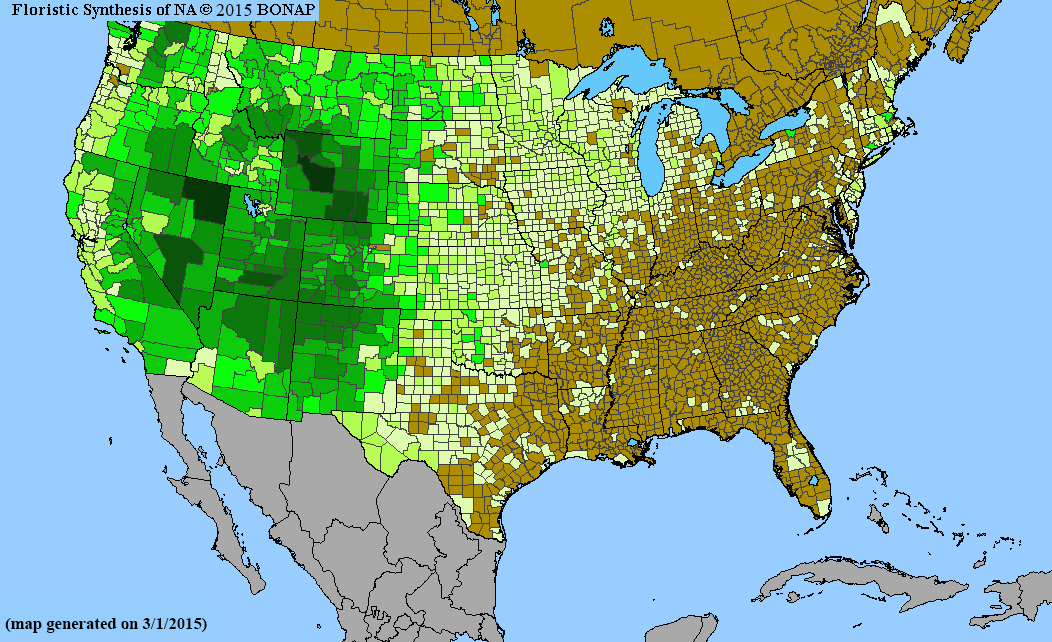
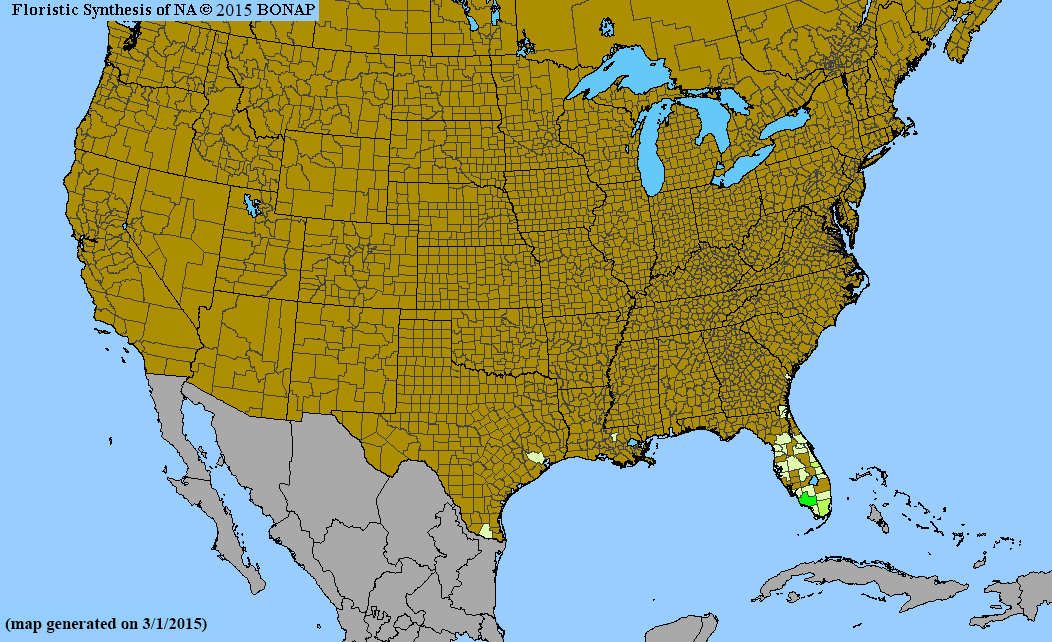
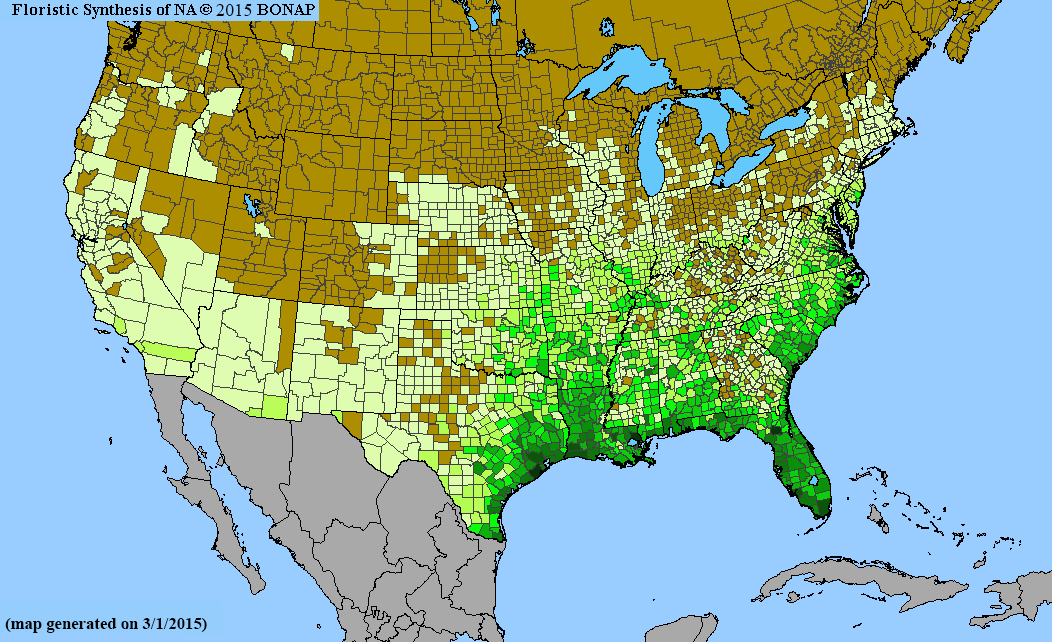
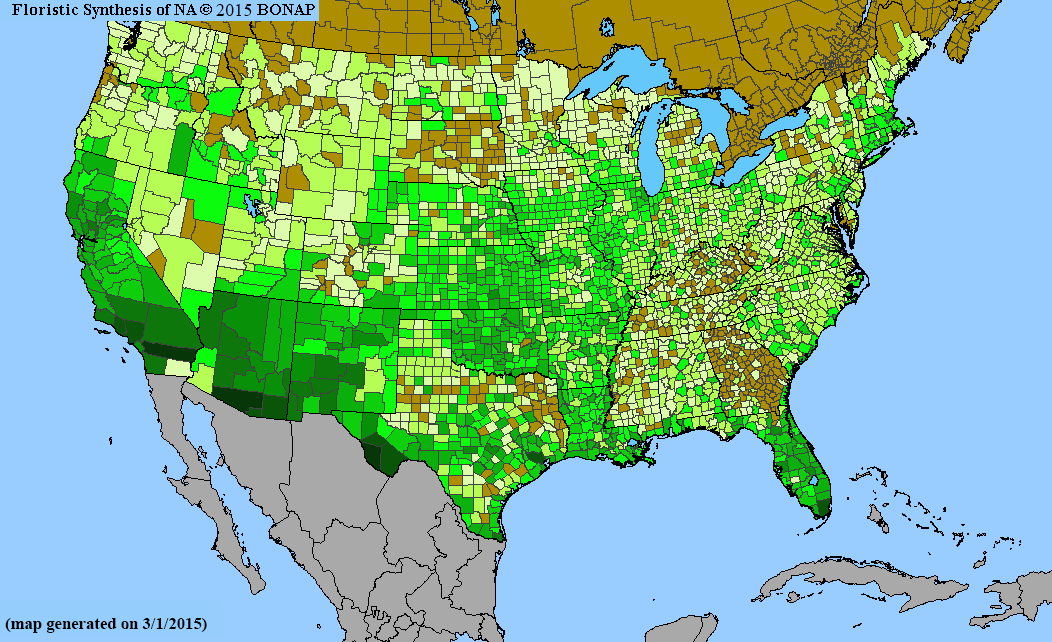
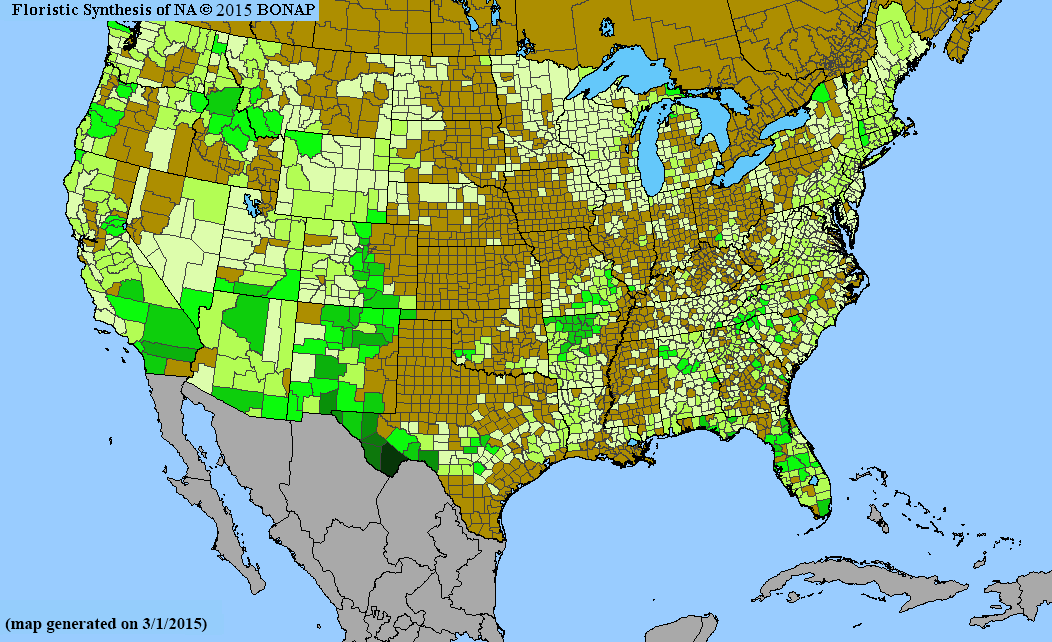
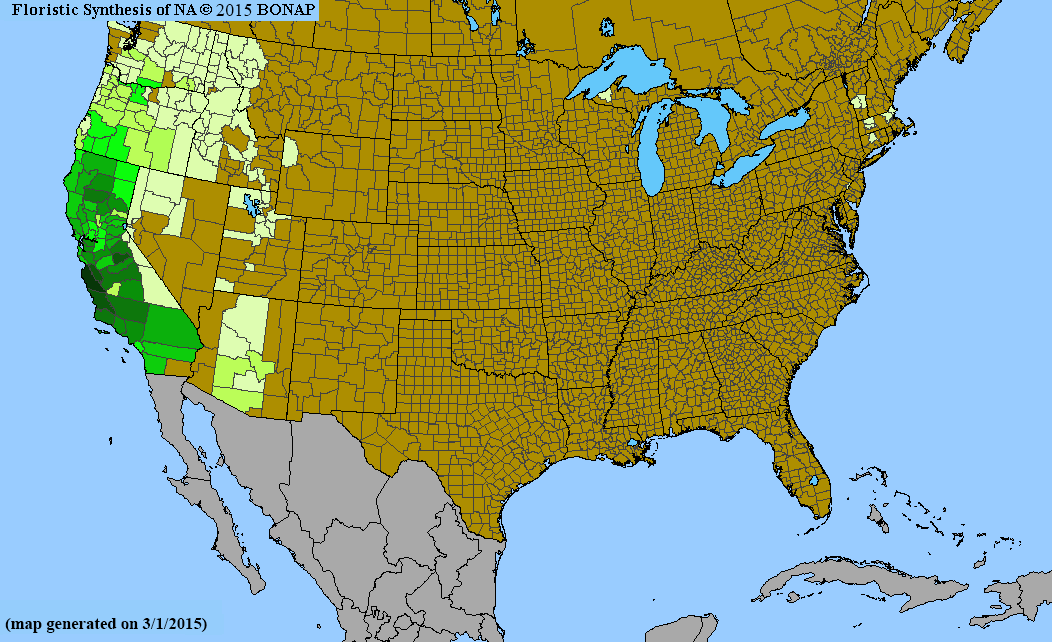
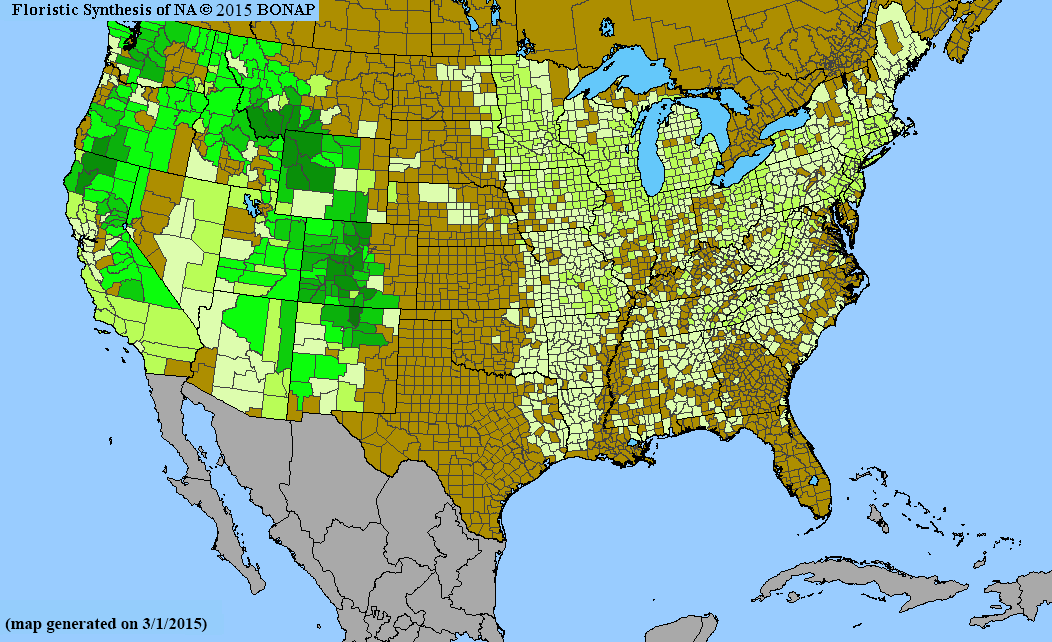
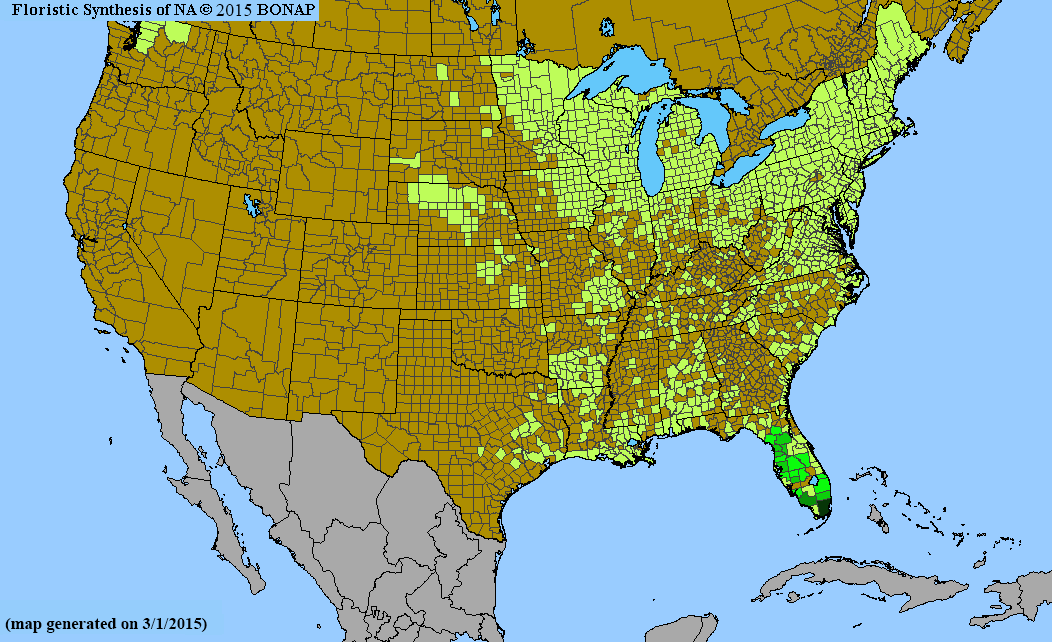
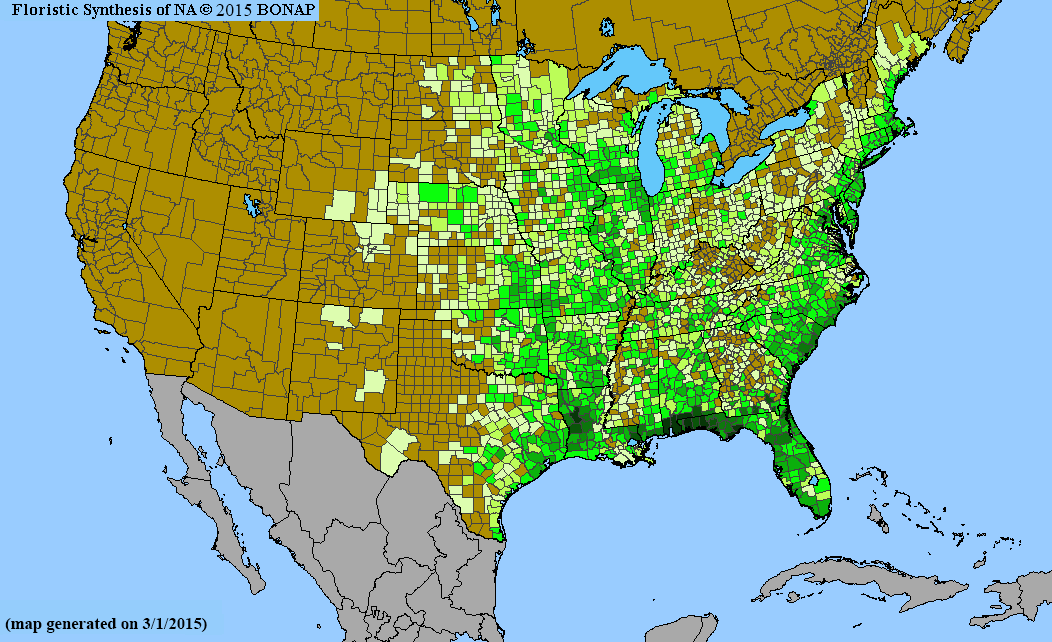
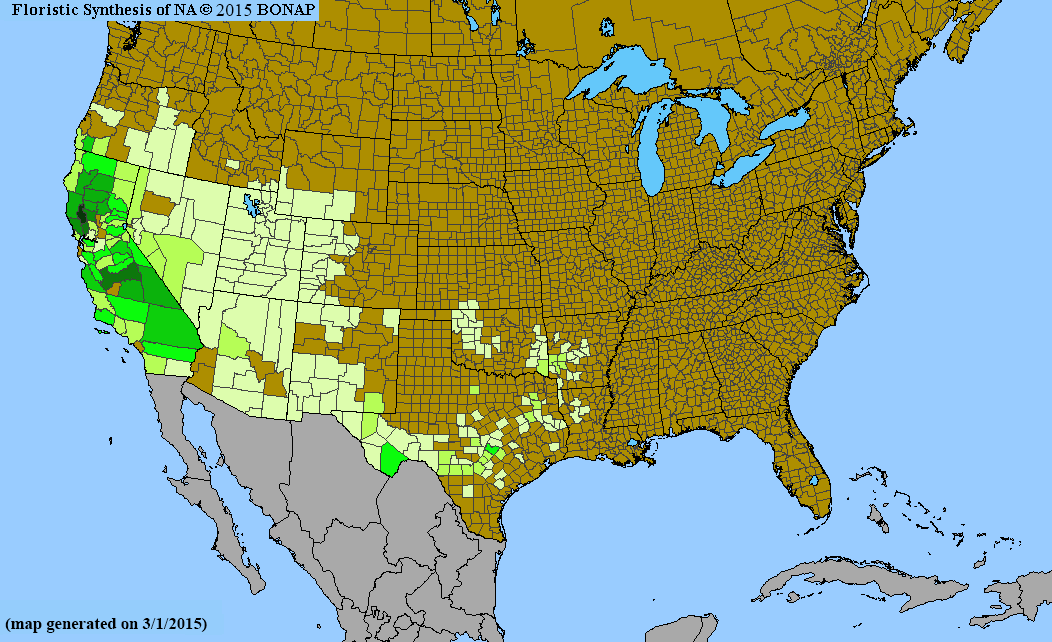
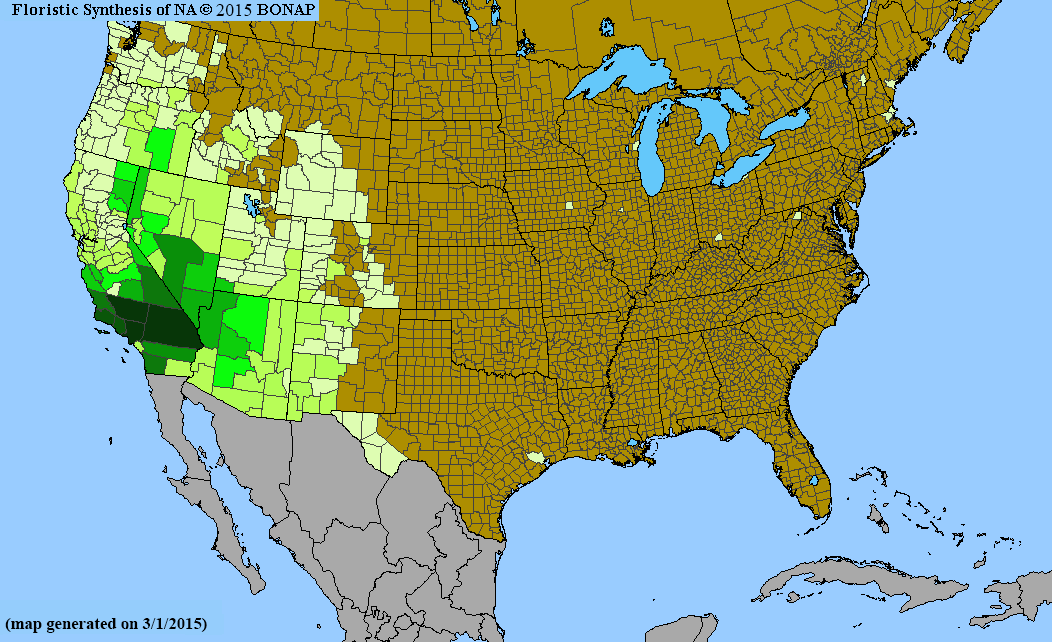
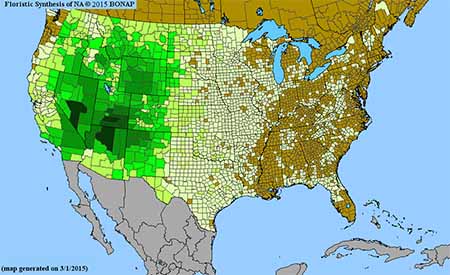
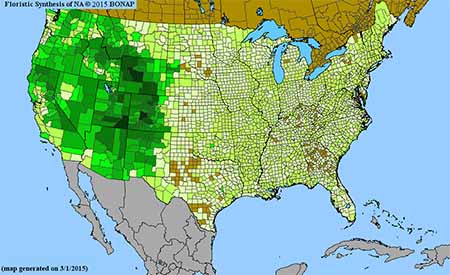
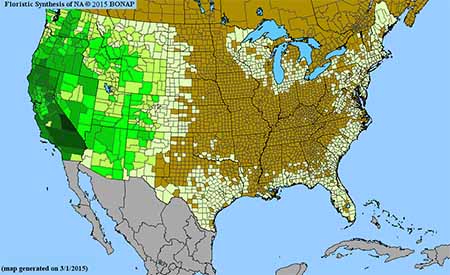
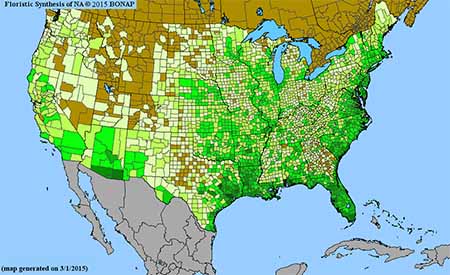
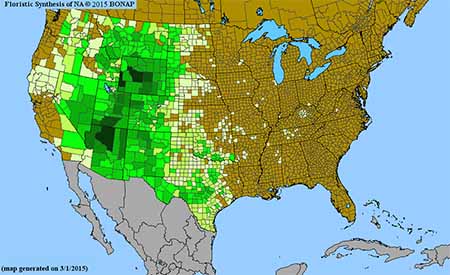
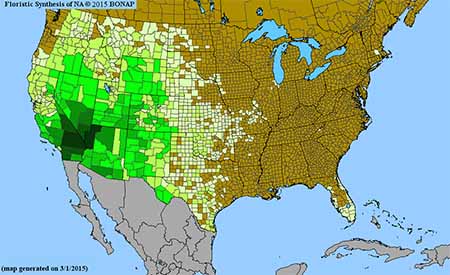
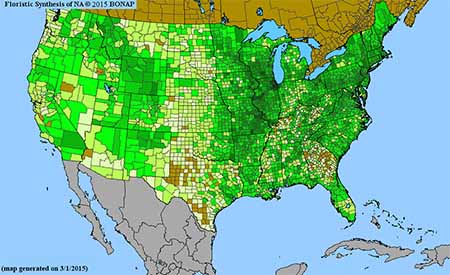
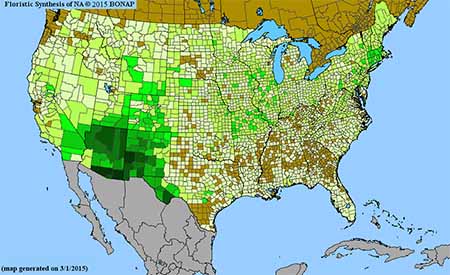
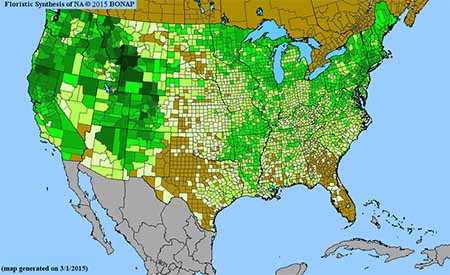
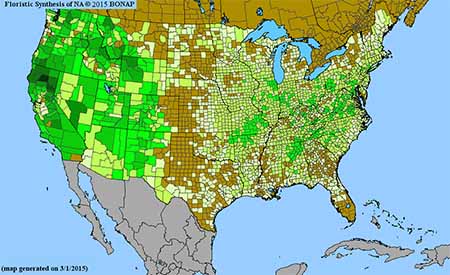
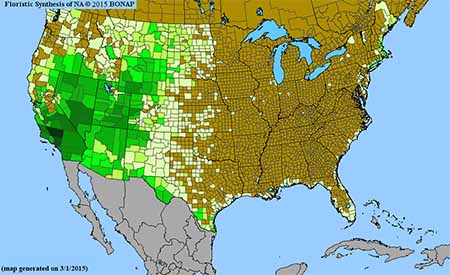
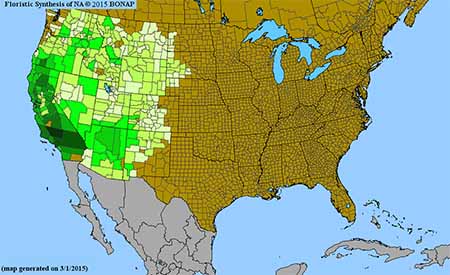
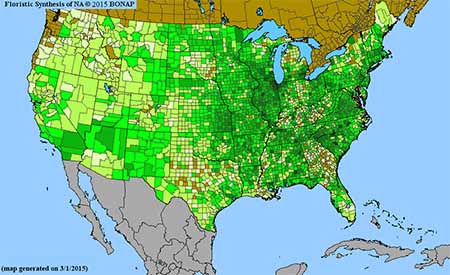
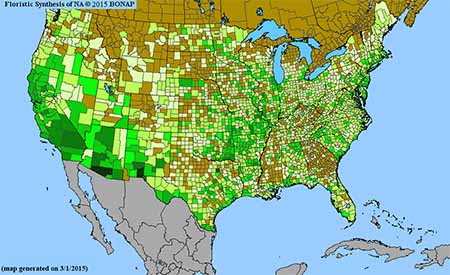
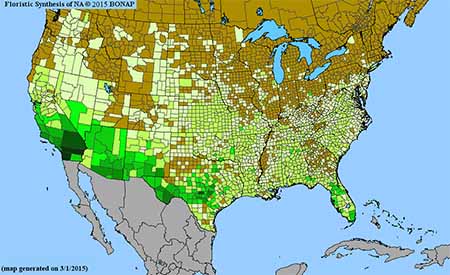
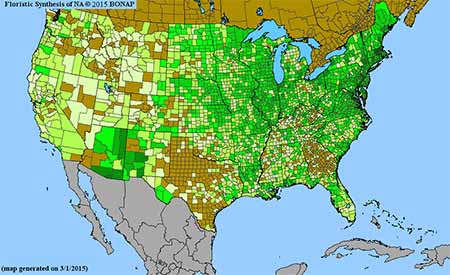
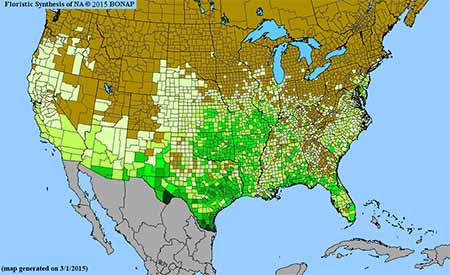
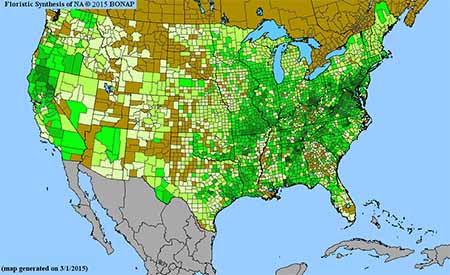
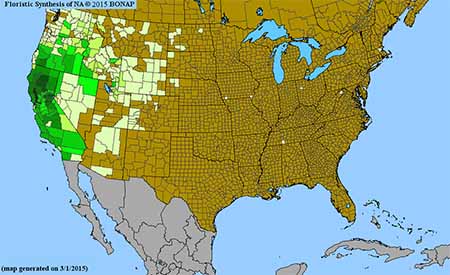
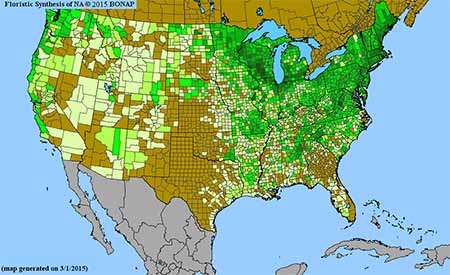
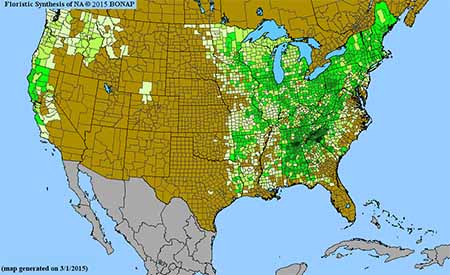
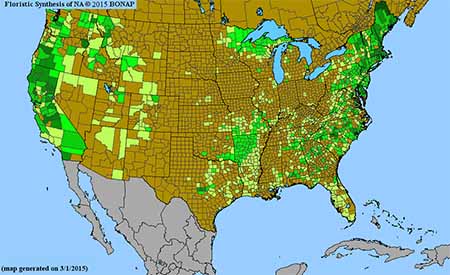
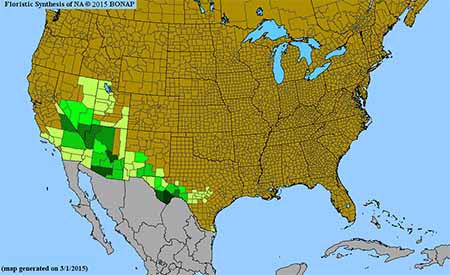
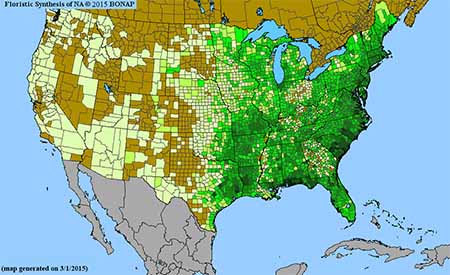
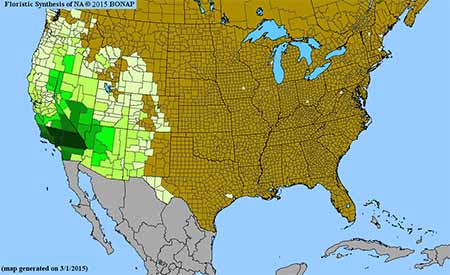
Density gradient of native species for Penstemon. Darkest green (31 spp. Garfield County, UT) indicates the highest species concentration. BONAP©2015
|
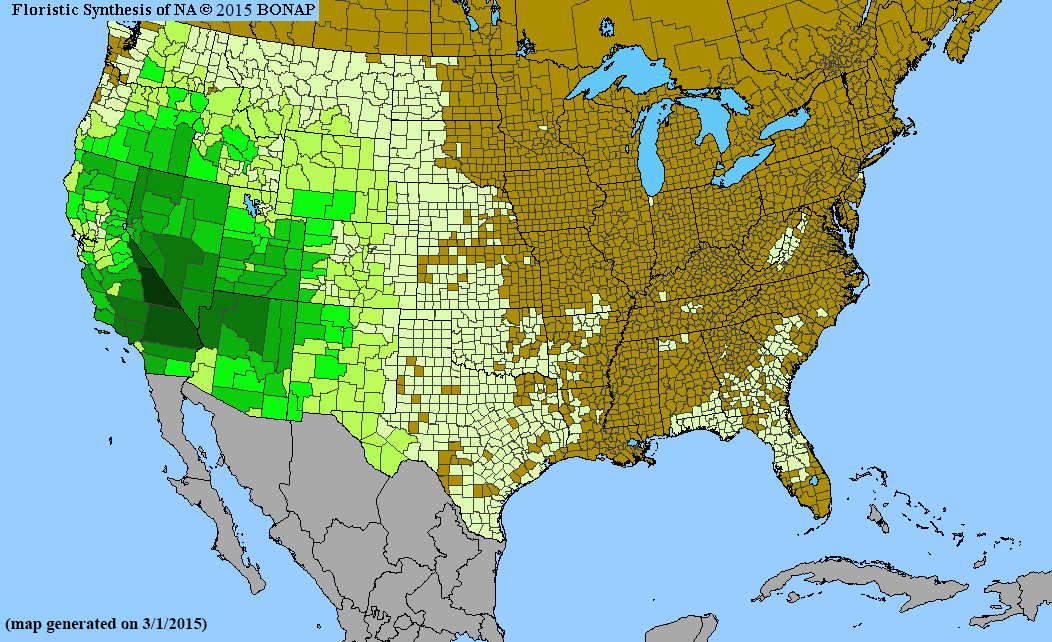
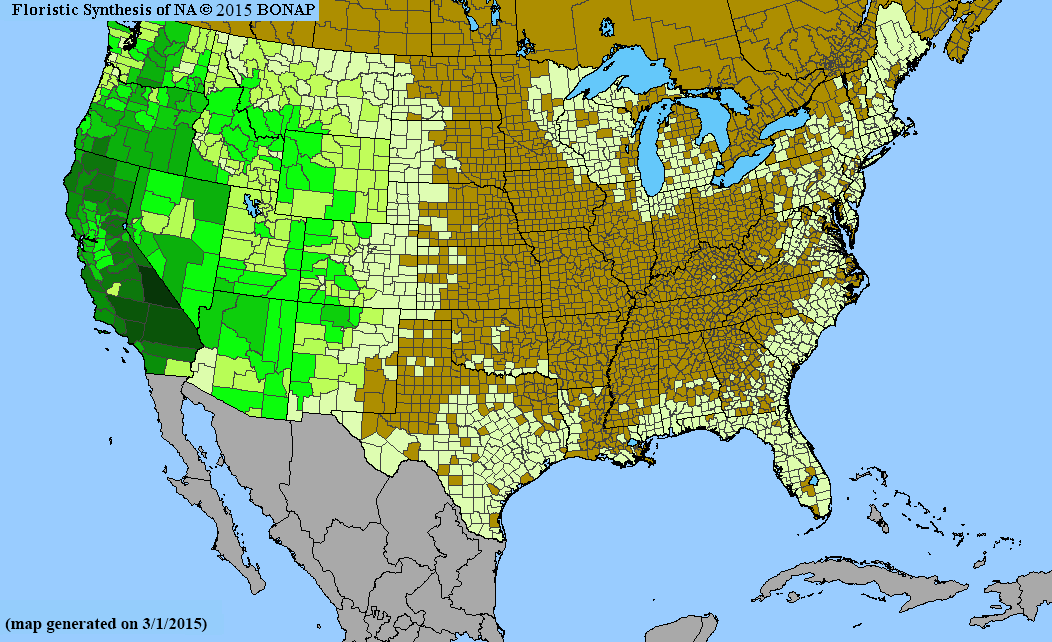
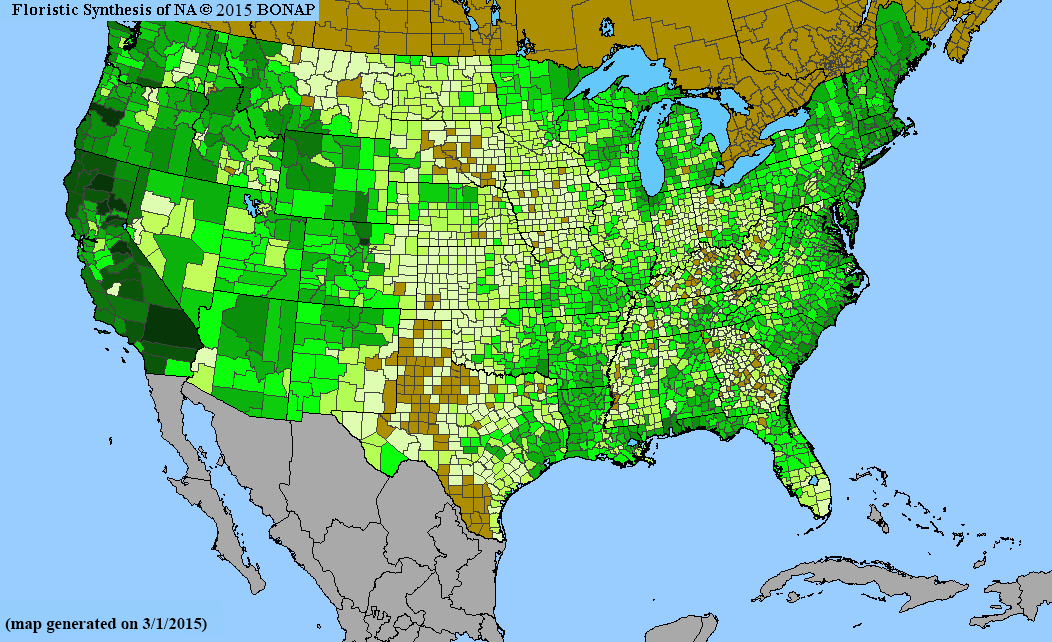
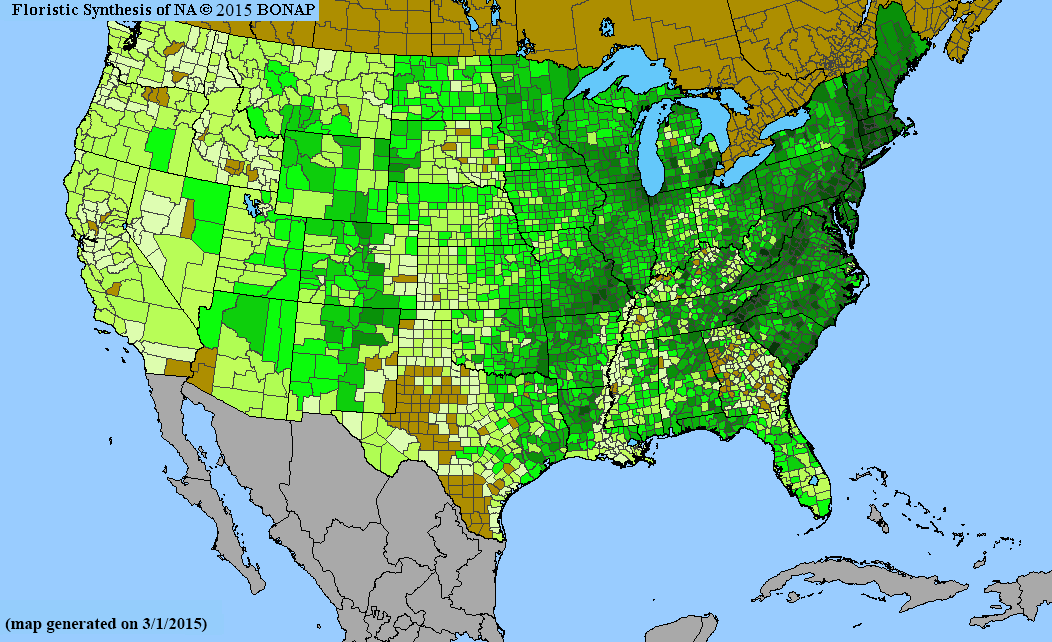
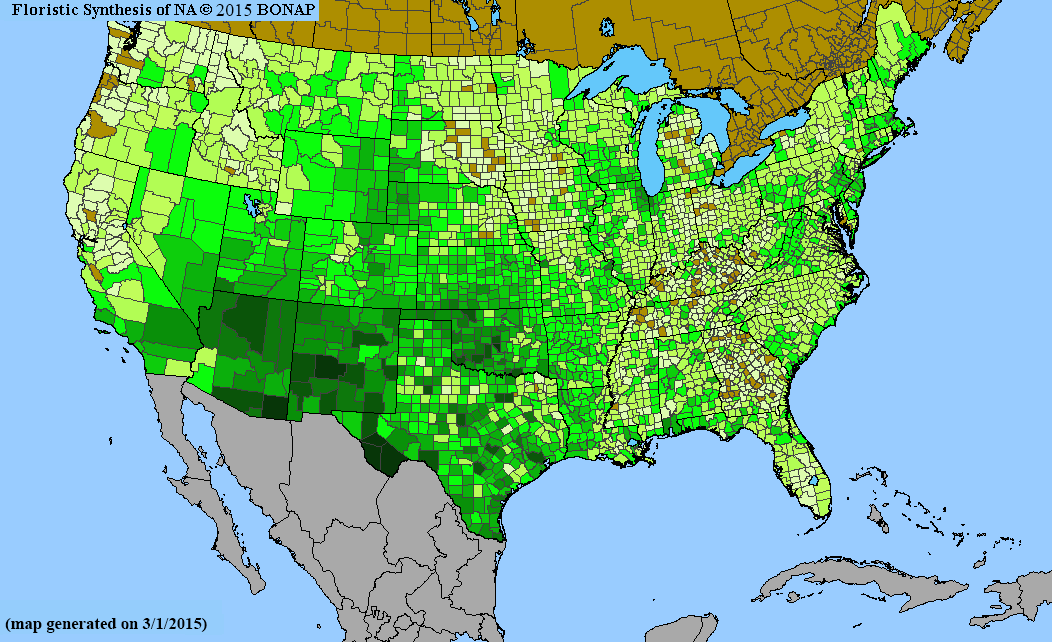
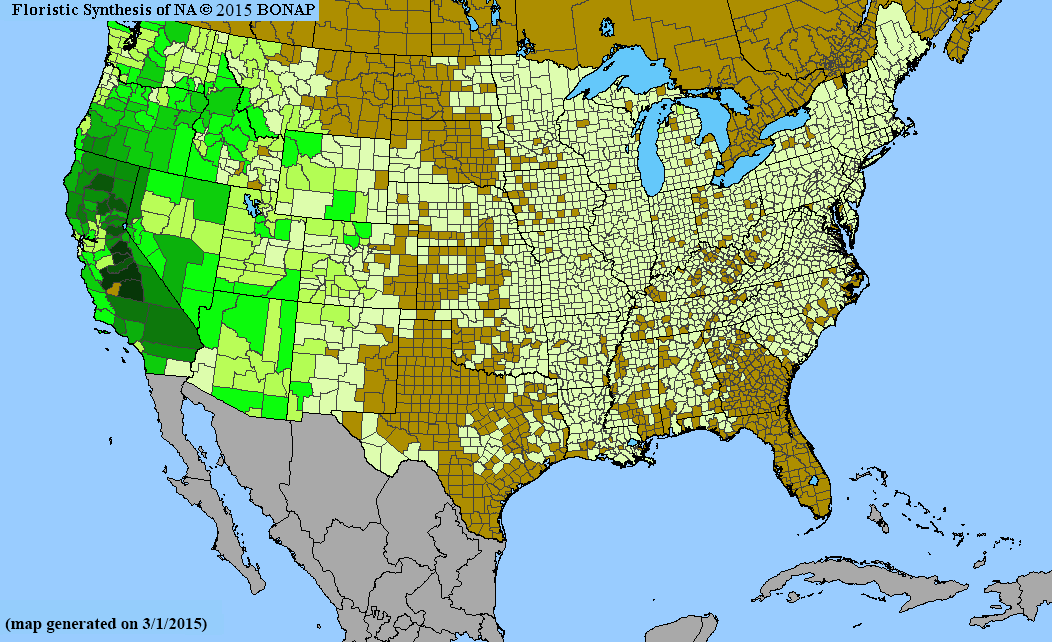
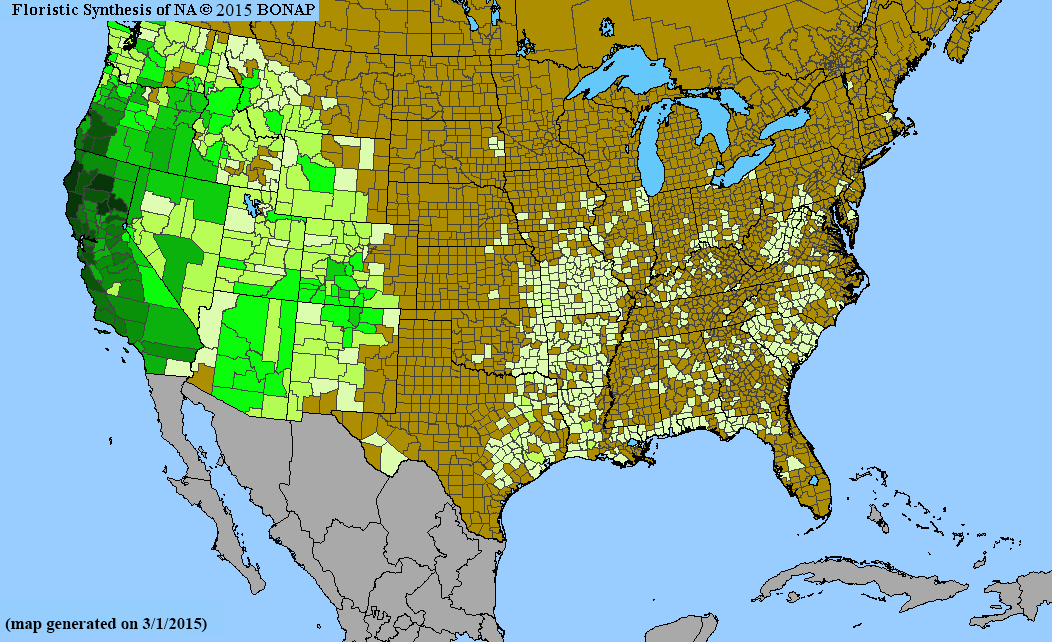
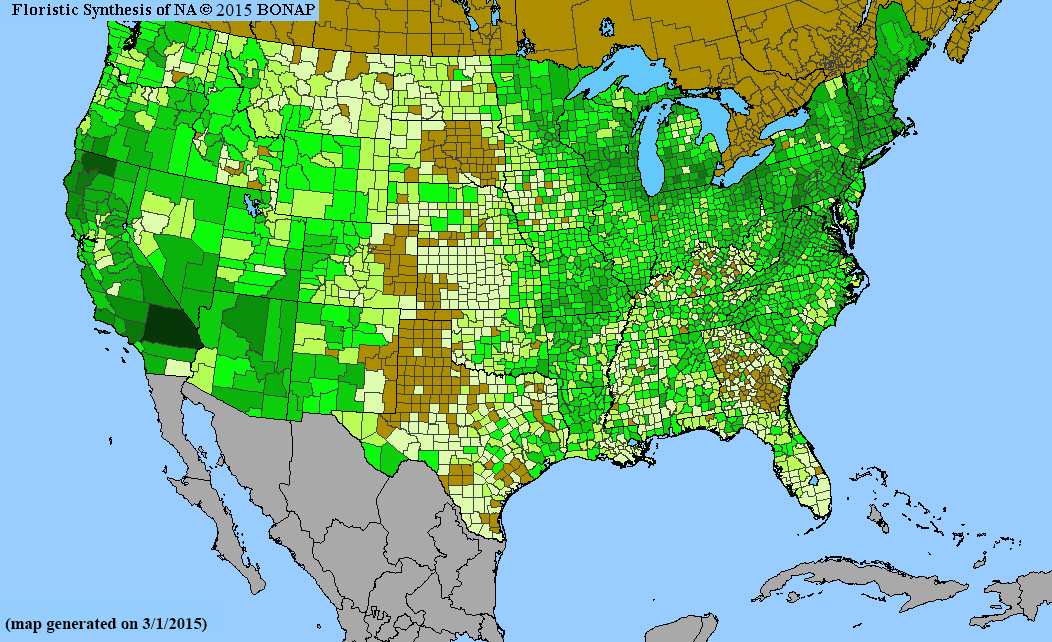
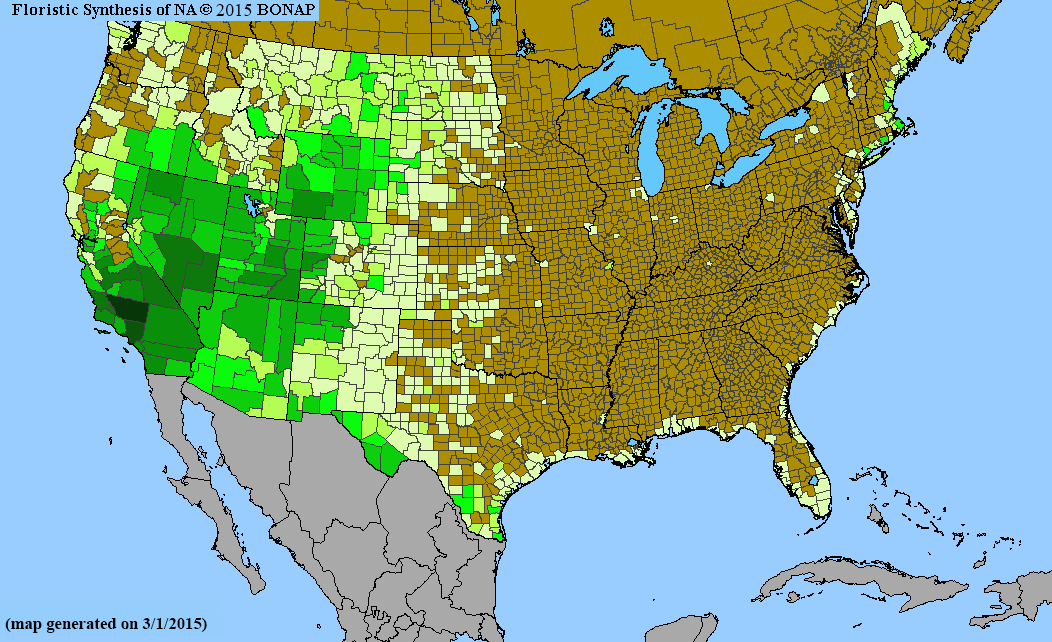
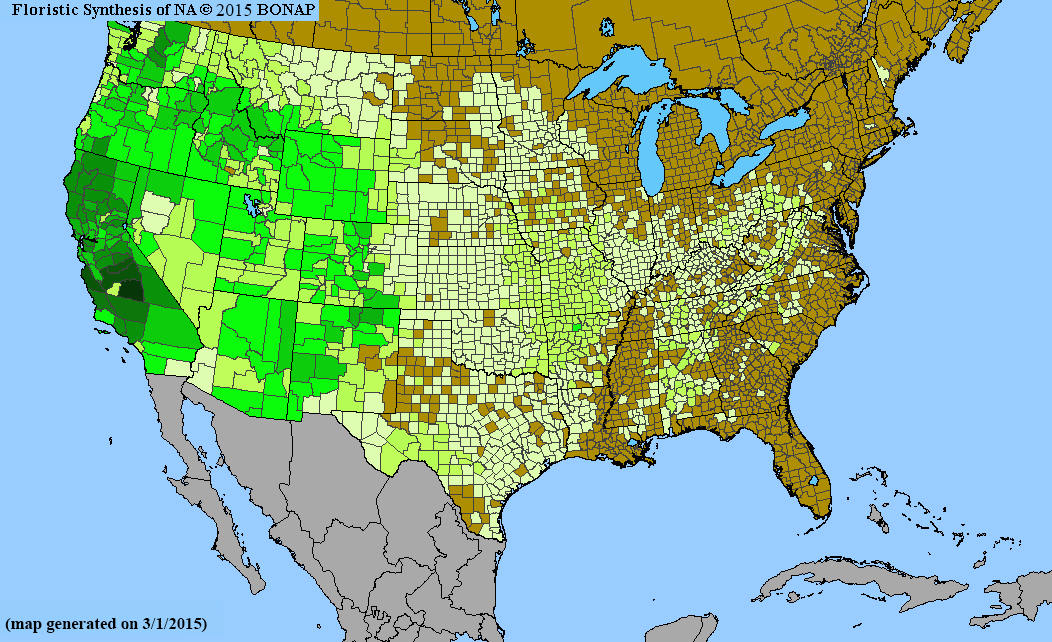
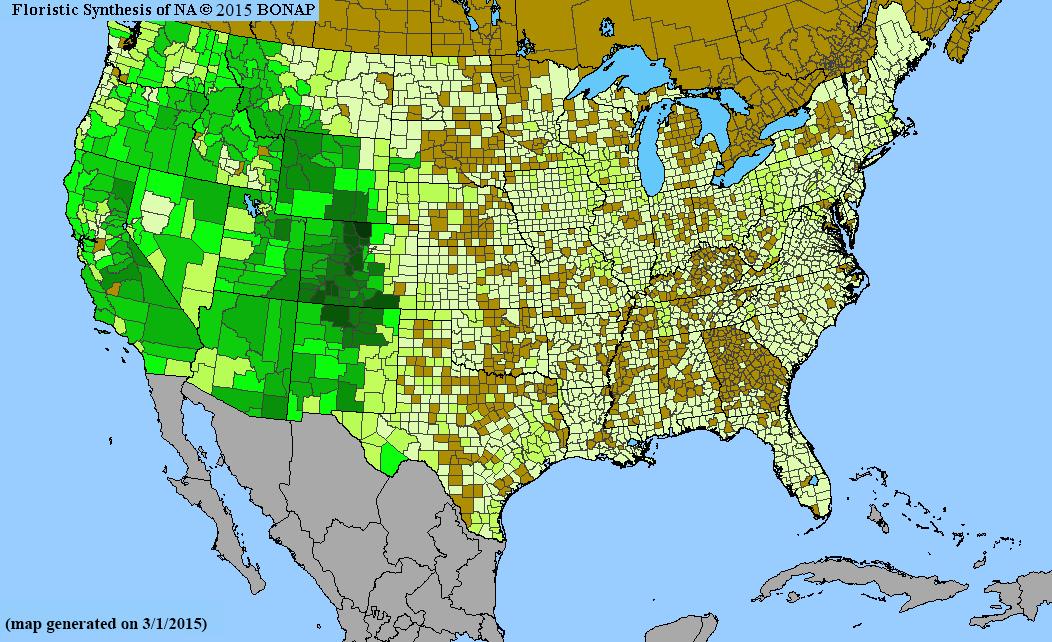
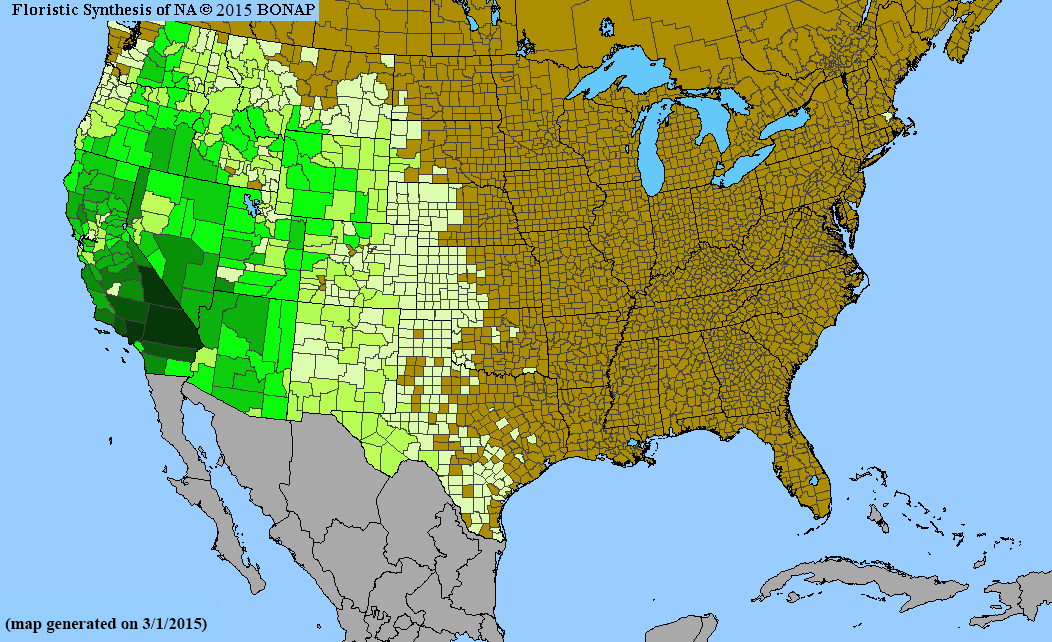
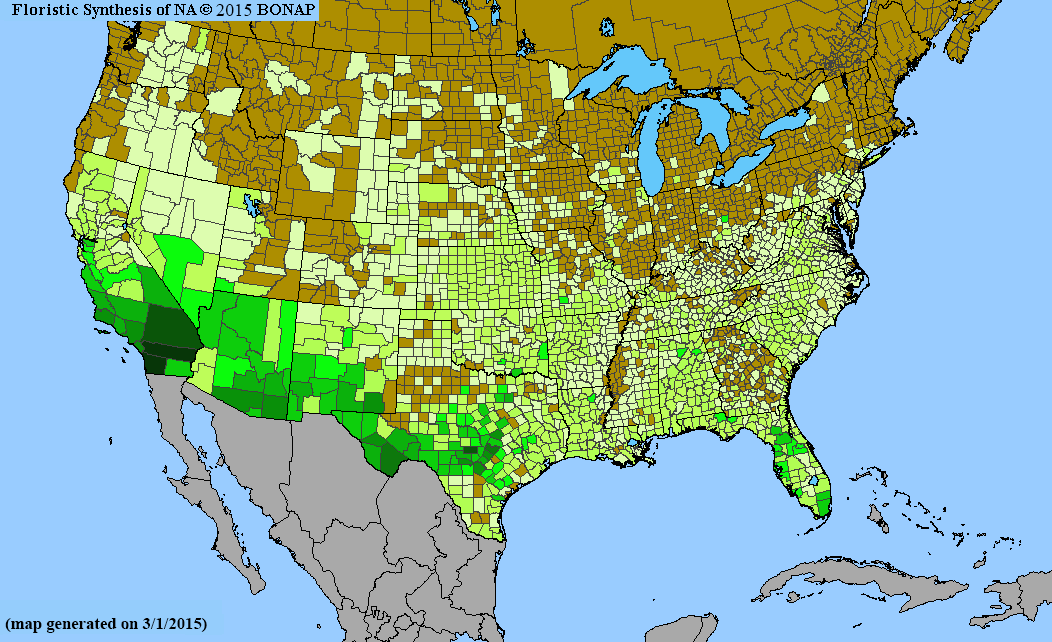
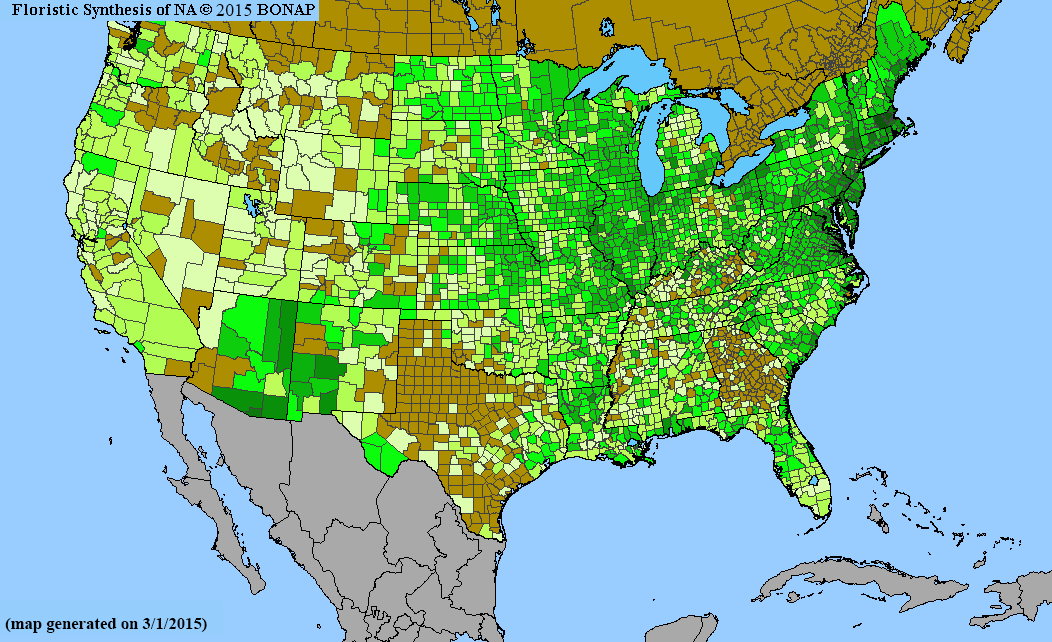
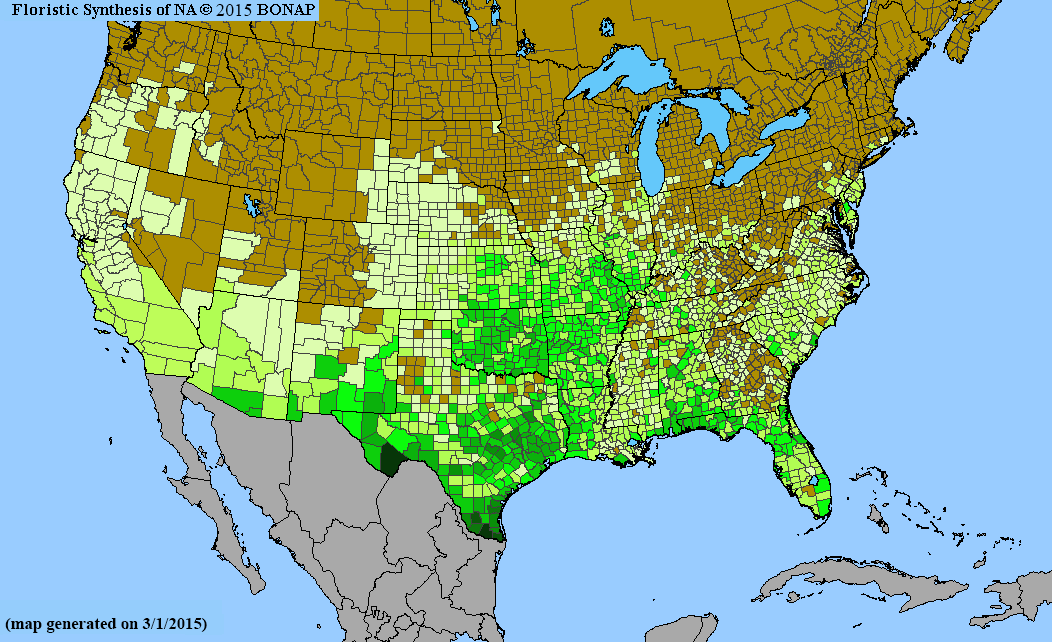
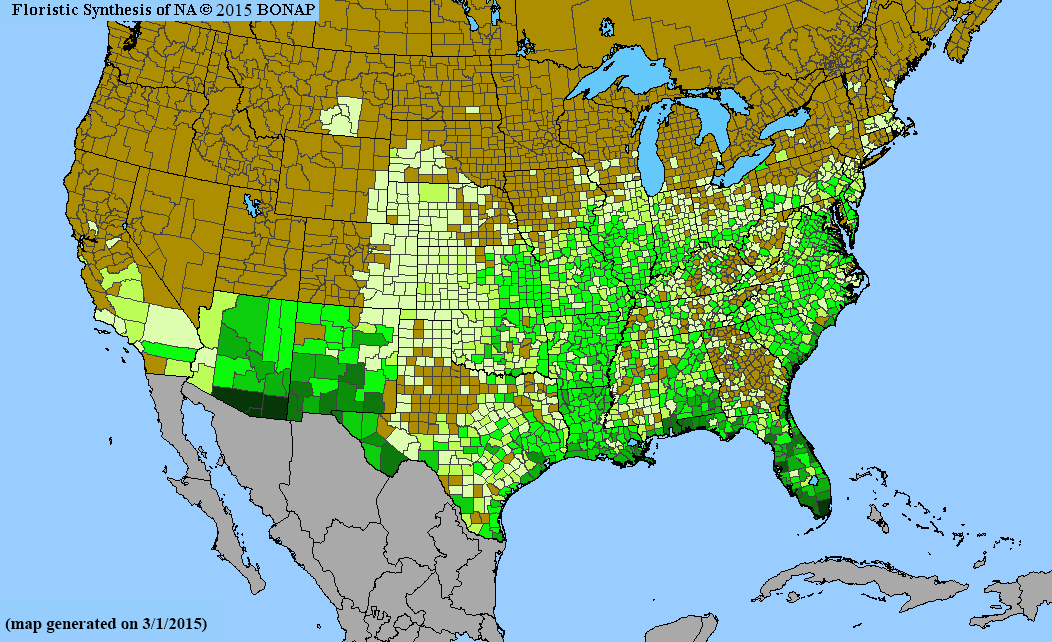
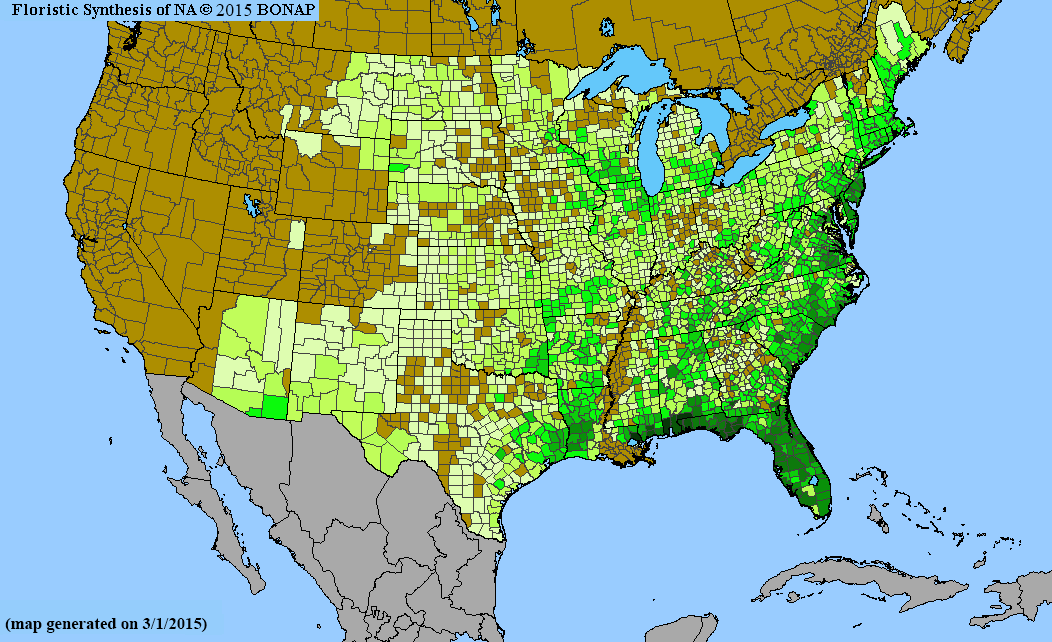
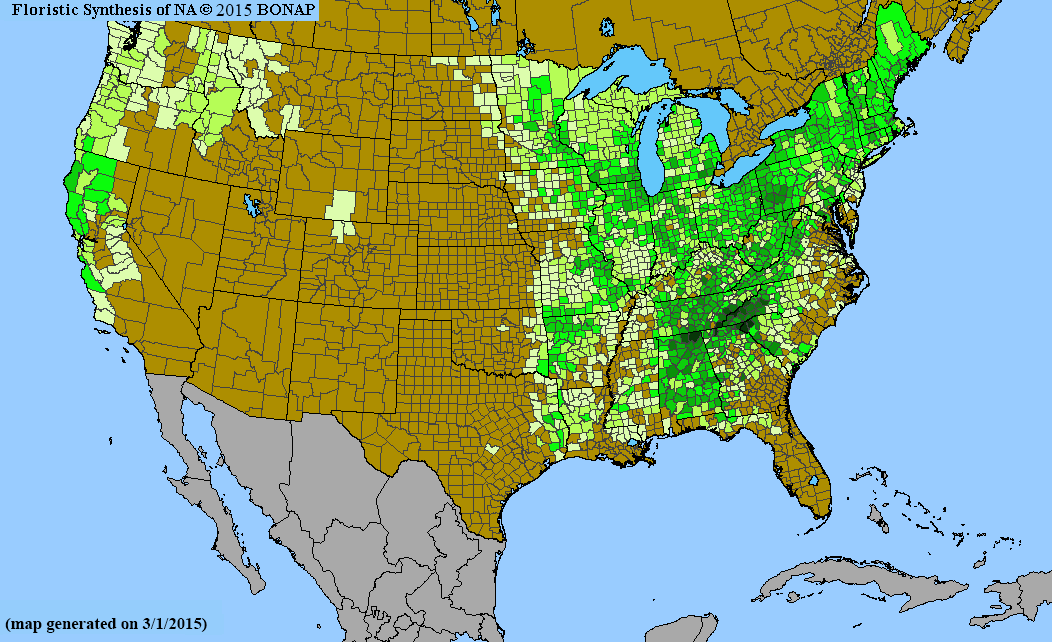
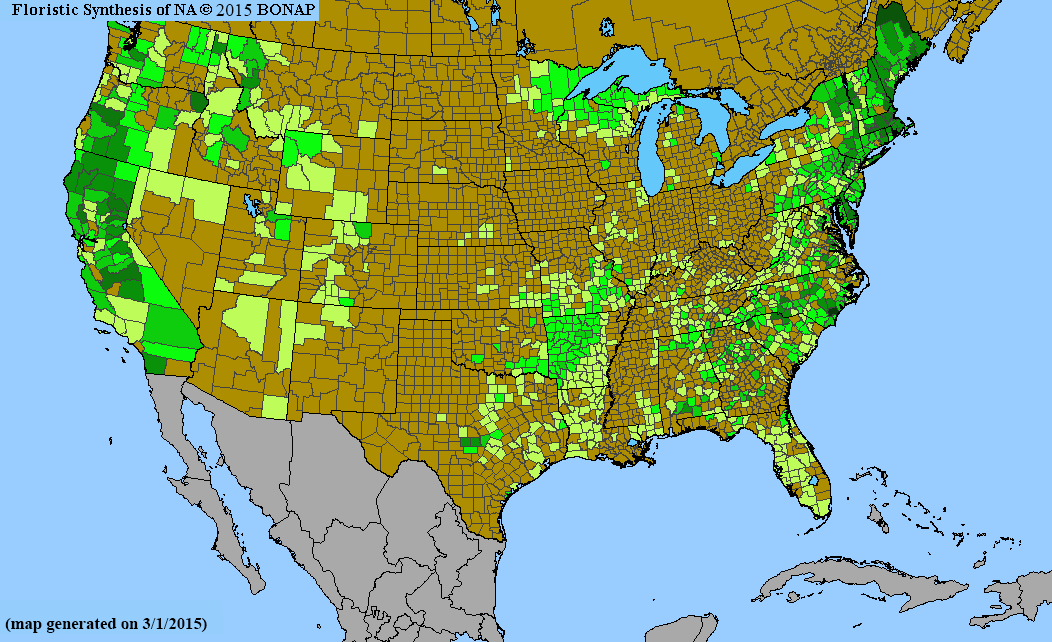
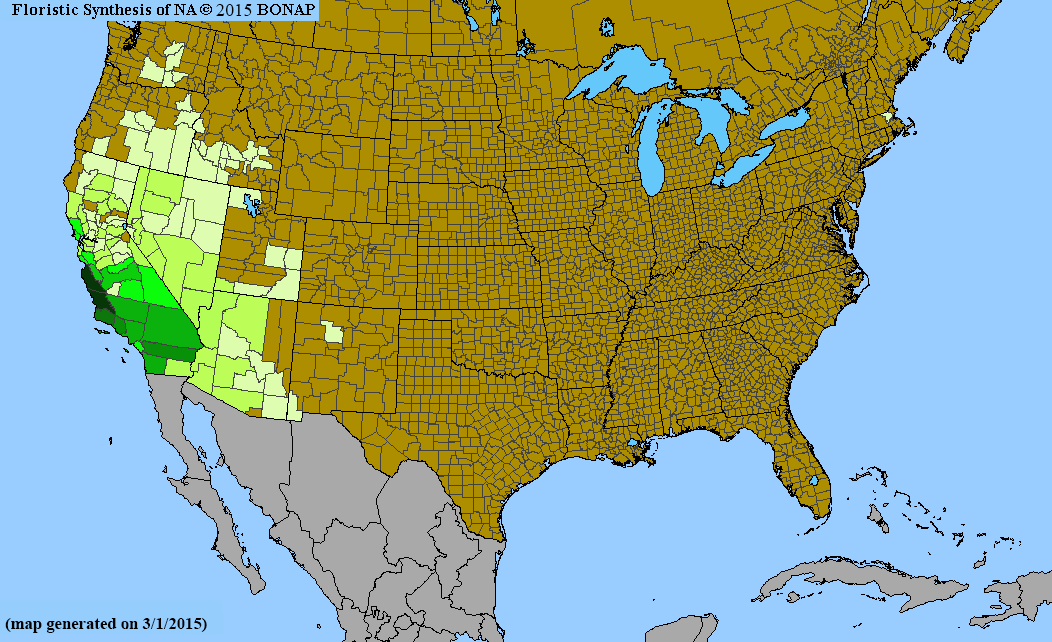
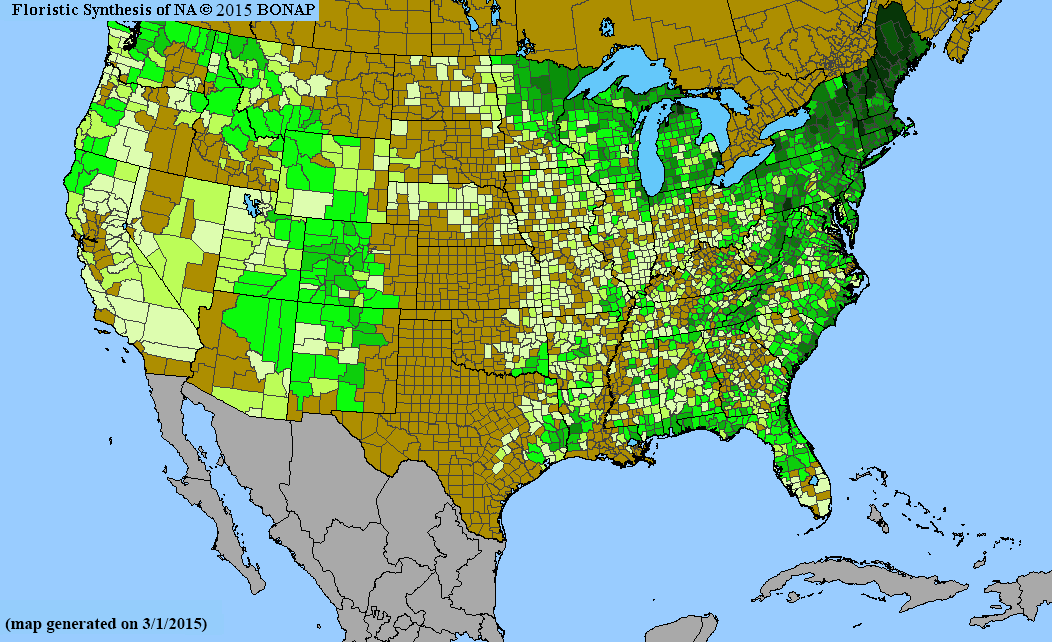
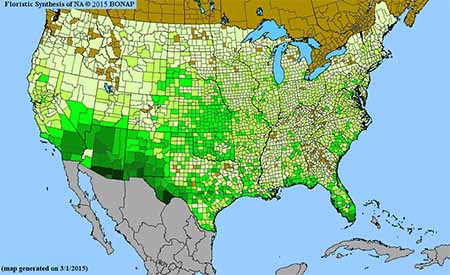
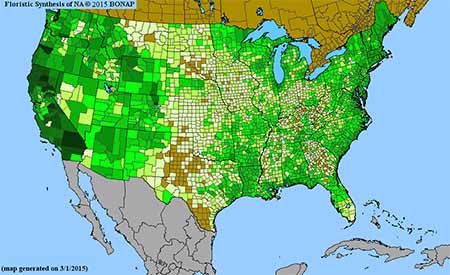
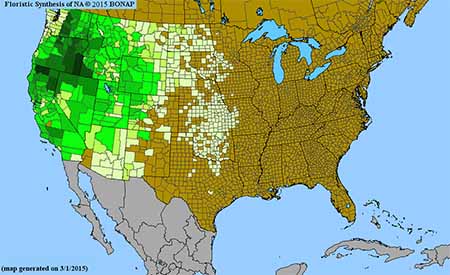
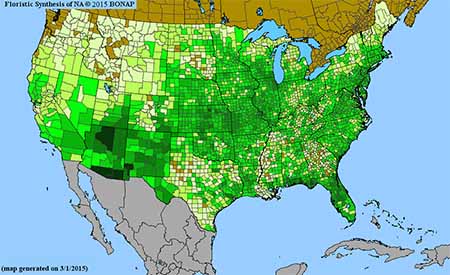
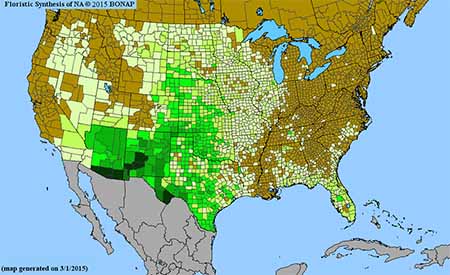
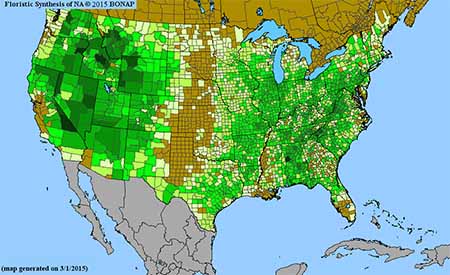
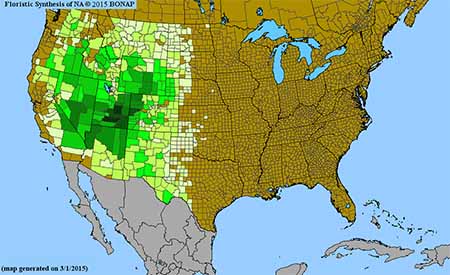
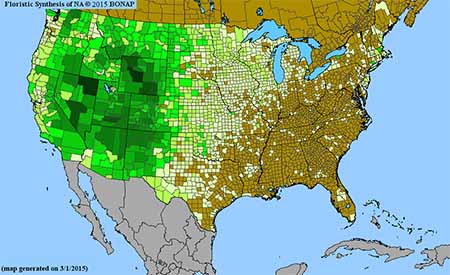
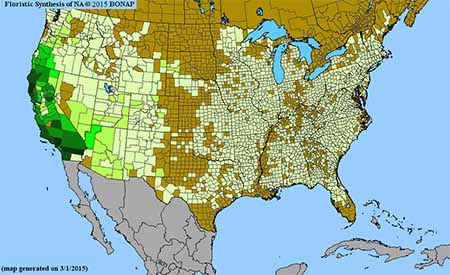
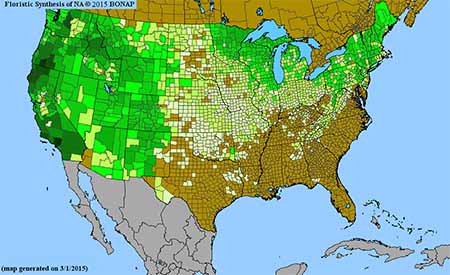
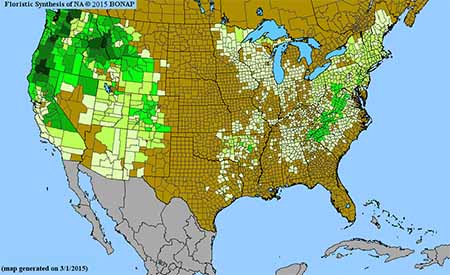
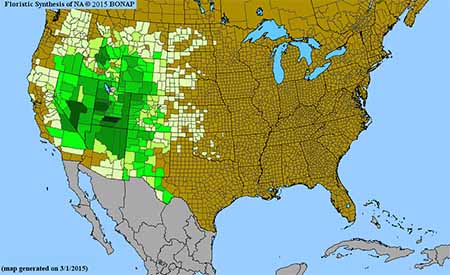
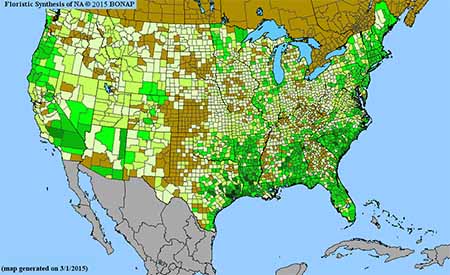
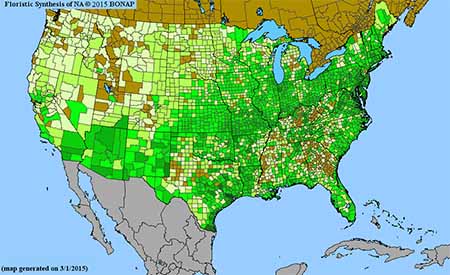
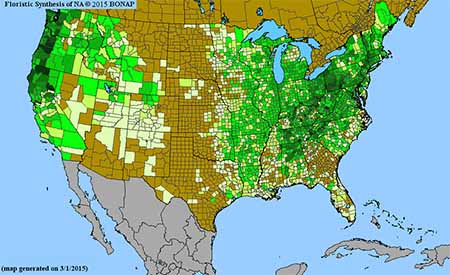
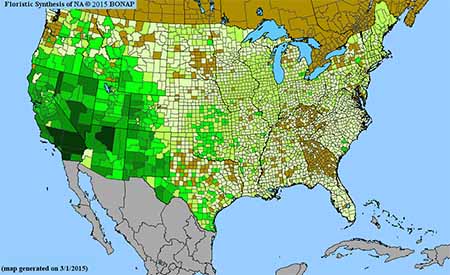
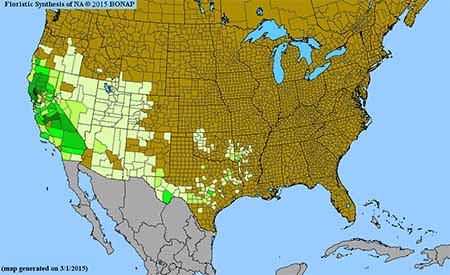
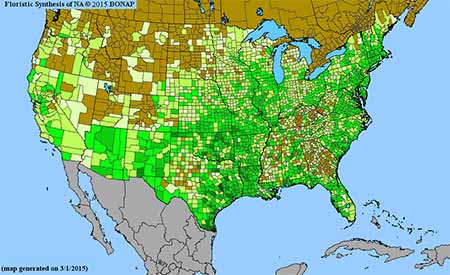
Density gradient of native species for Eriogonum. Darkest green (55 spp. Inyo County, CA) indicates the highest species concentration. BONAP©2015
|
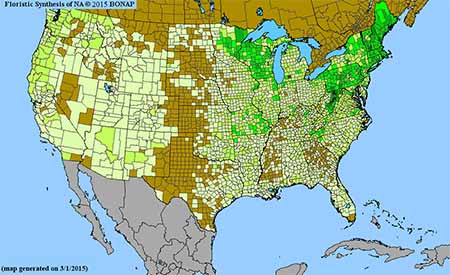
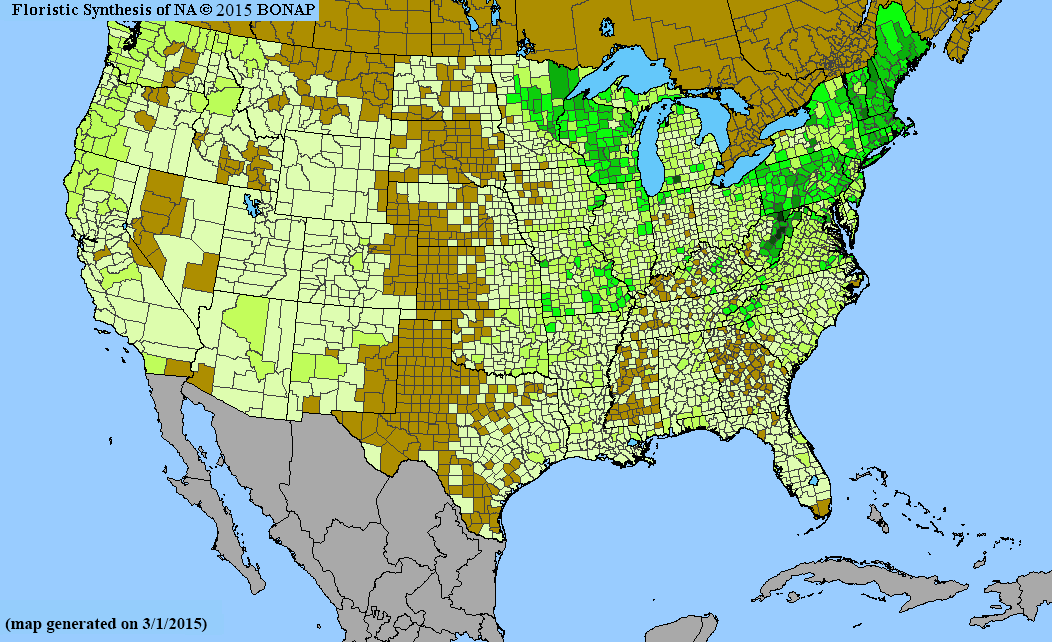
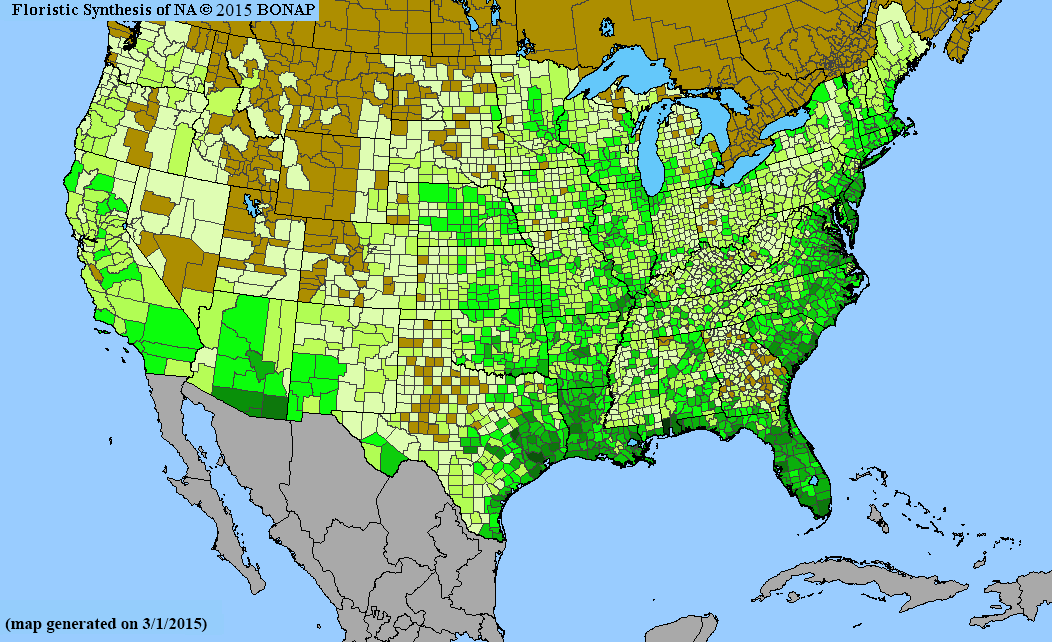
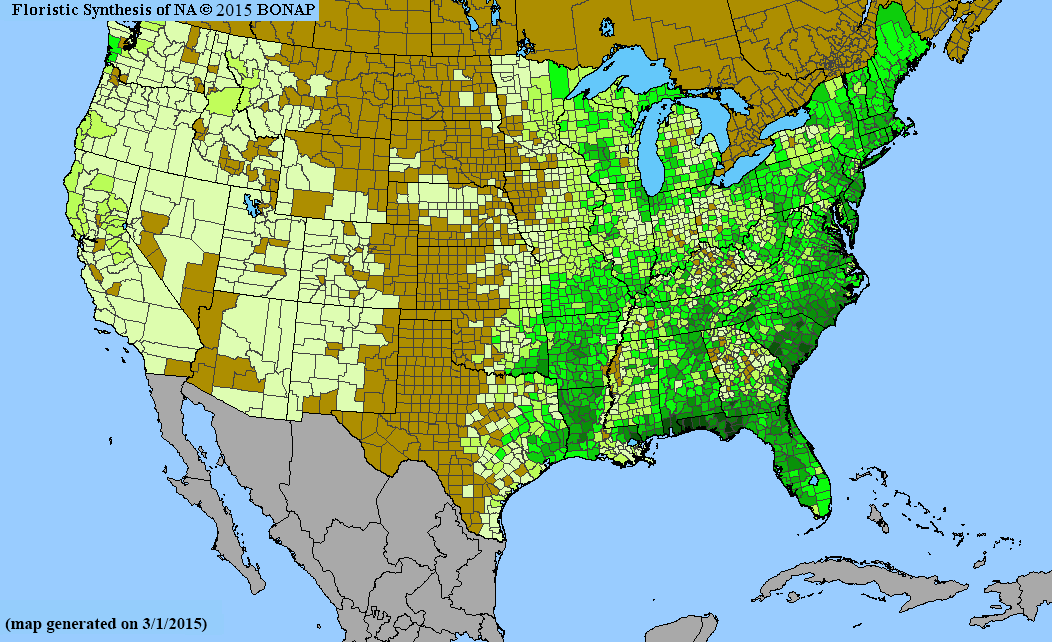
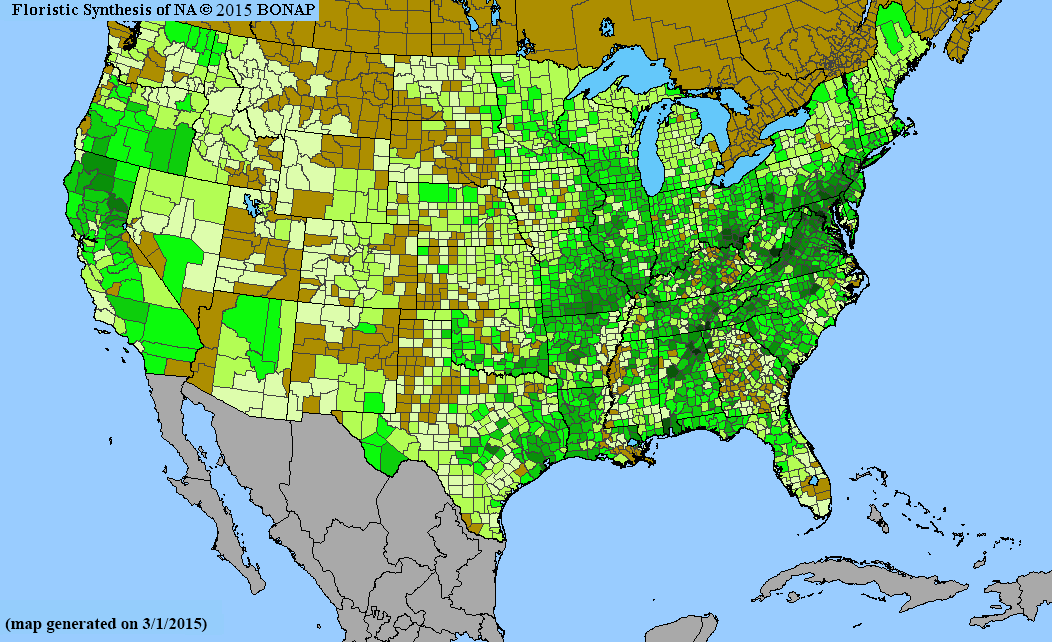
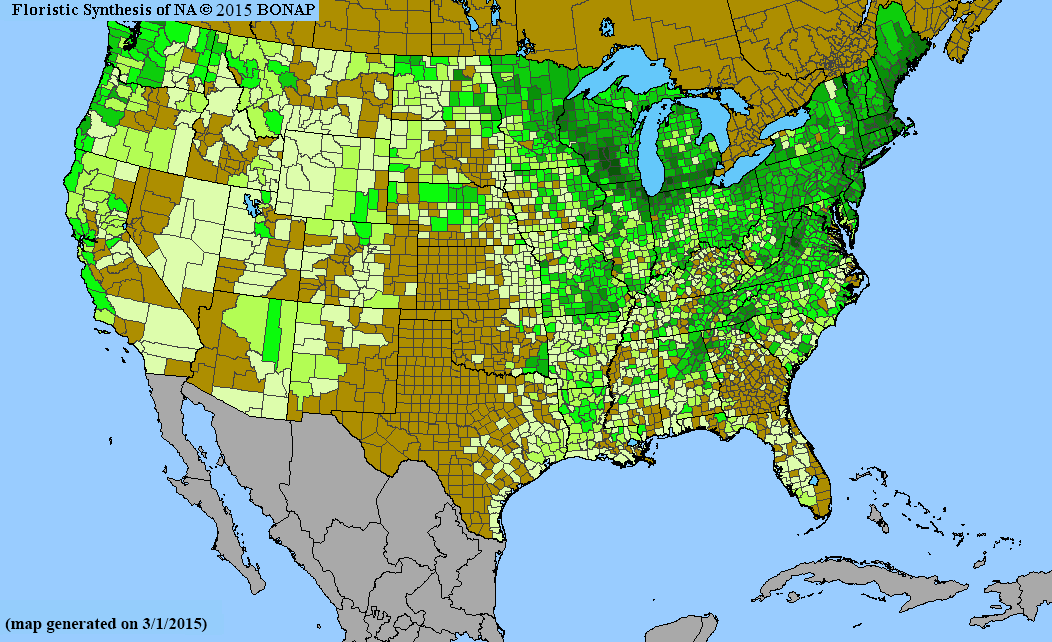
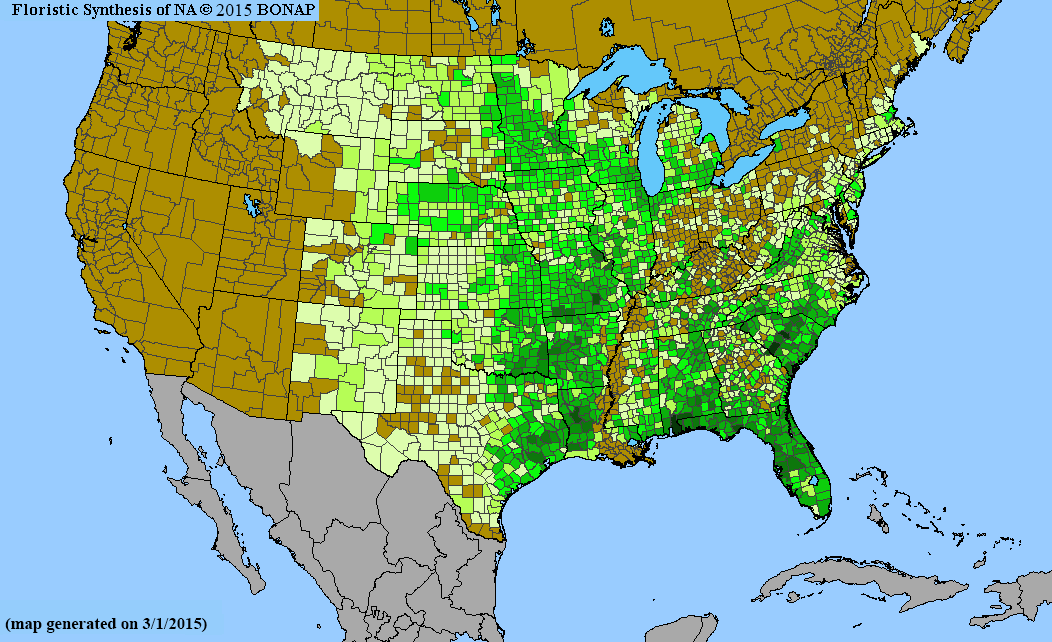
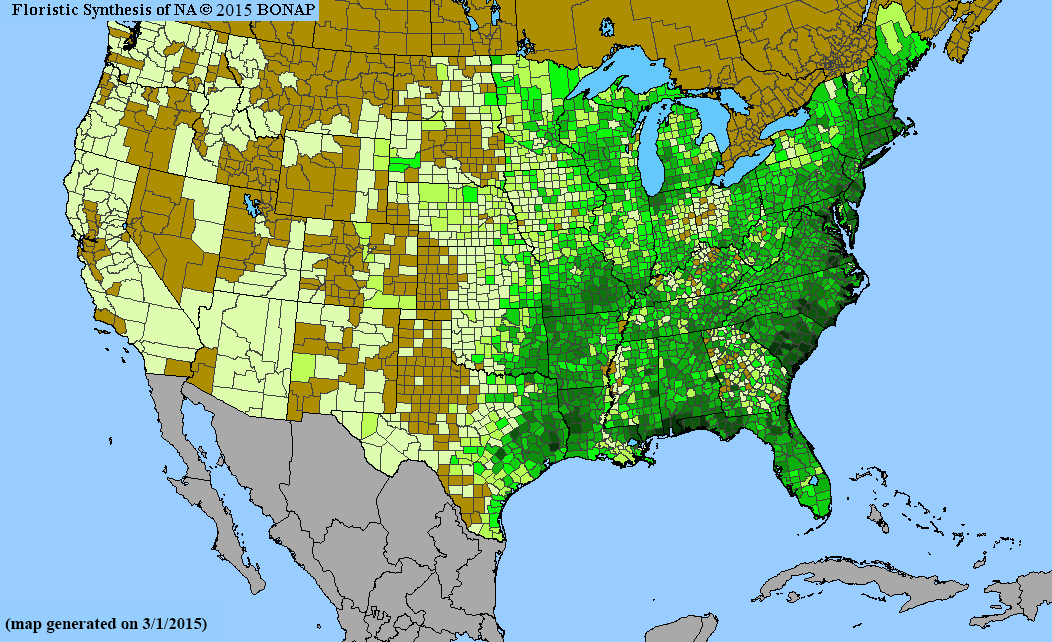
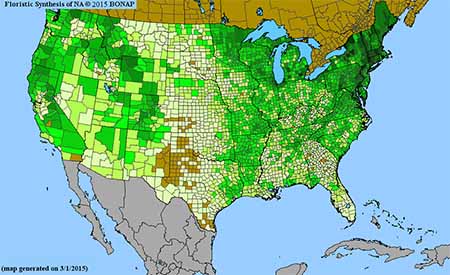
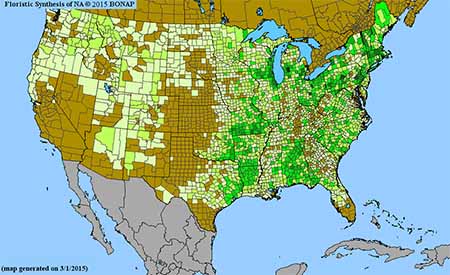
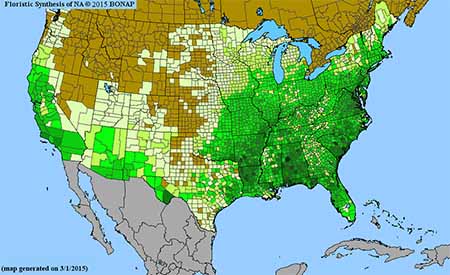
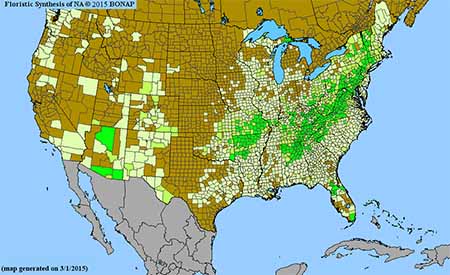
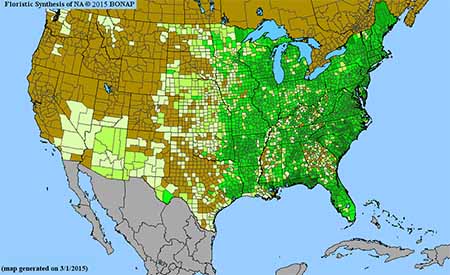
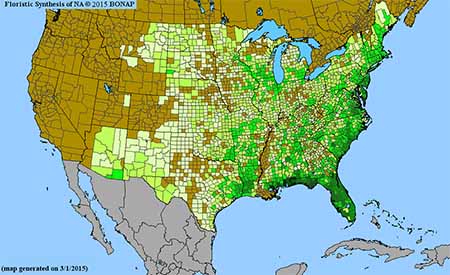
Density gradient of native species for Rubus. Darkest green (42 spp. Preston County, WV) indicates the highest species concentration. BONAP©2015
|
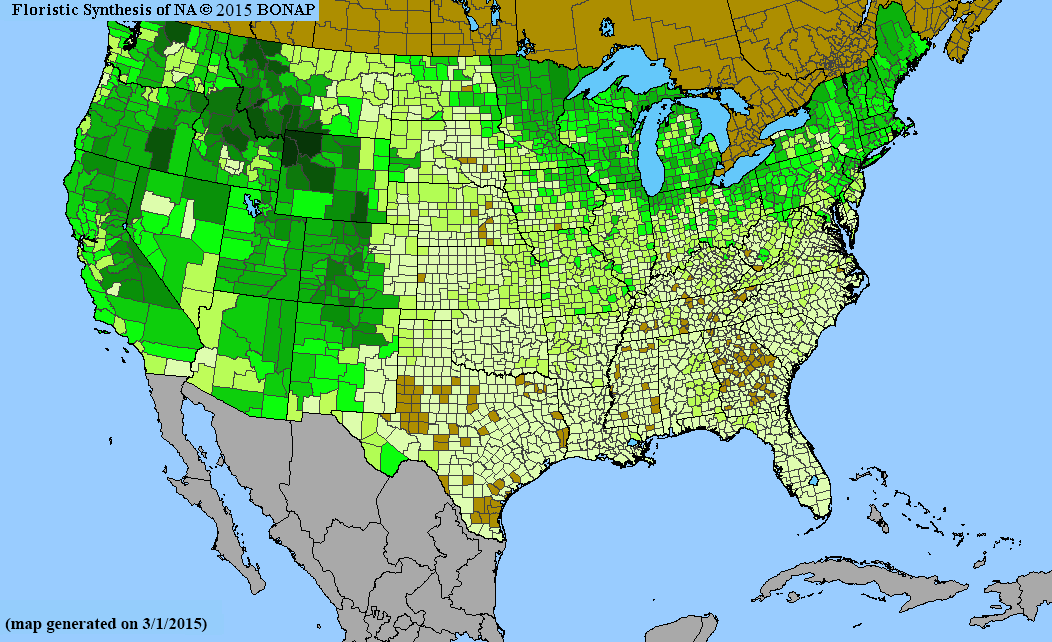
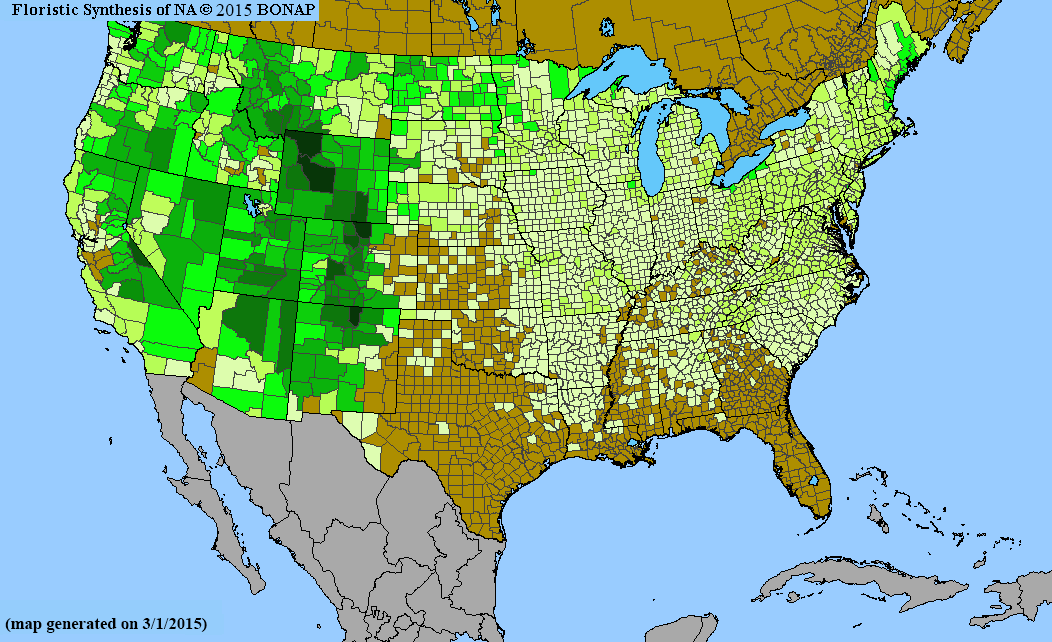
Density gradient of native species for Erigeron. Darkest green (34 spp. San Juan County, UT) indicates the highest species concentration. BONAP©2015
|
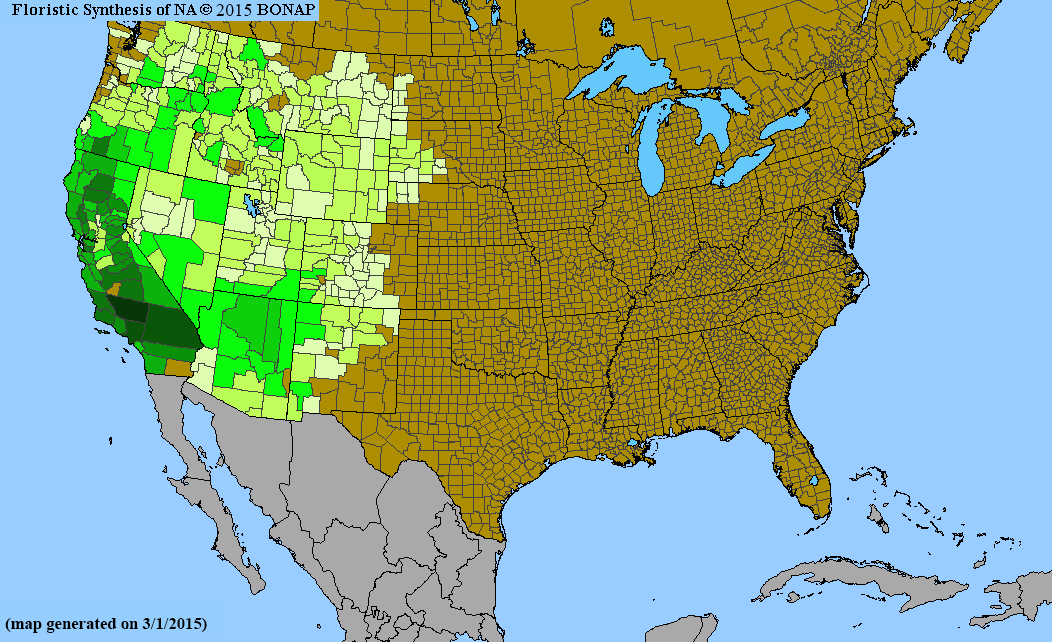
Density gradient of native species for Phacelia. Darkest green (43 spp. Inyo County, CA) indicates the highest species concentration. BONAP©2015
|
Density gradient of native species for Lupinus. Darkest green (40 spp. Inyo County, CA) indicates the highest species concentration. BONAP©2015
|
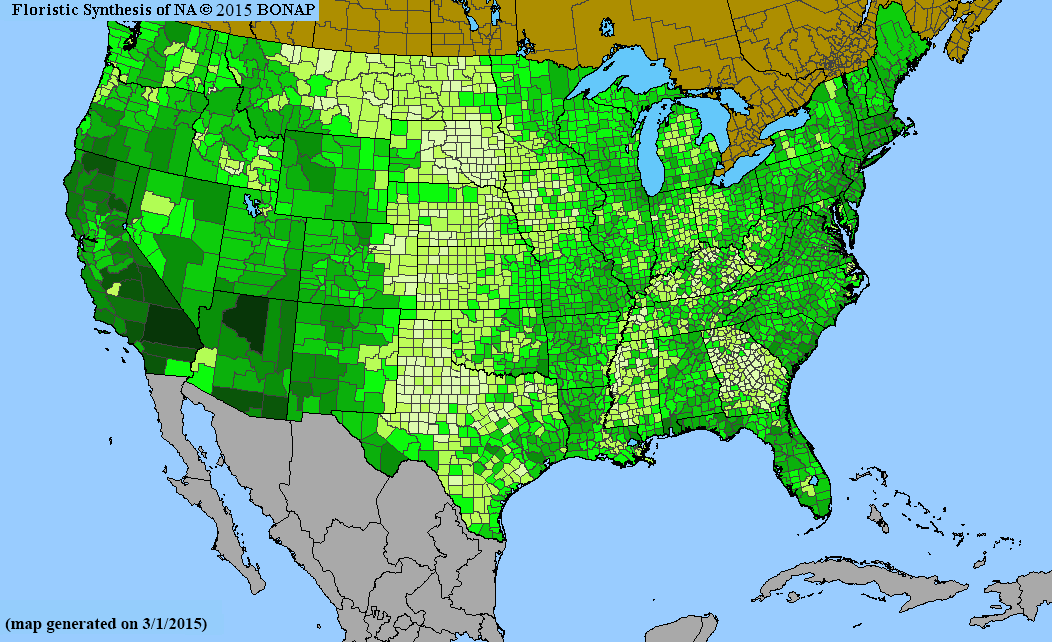
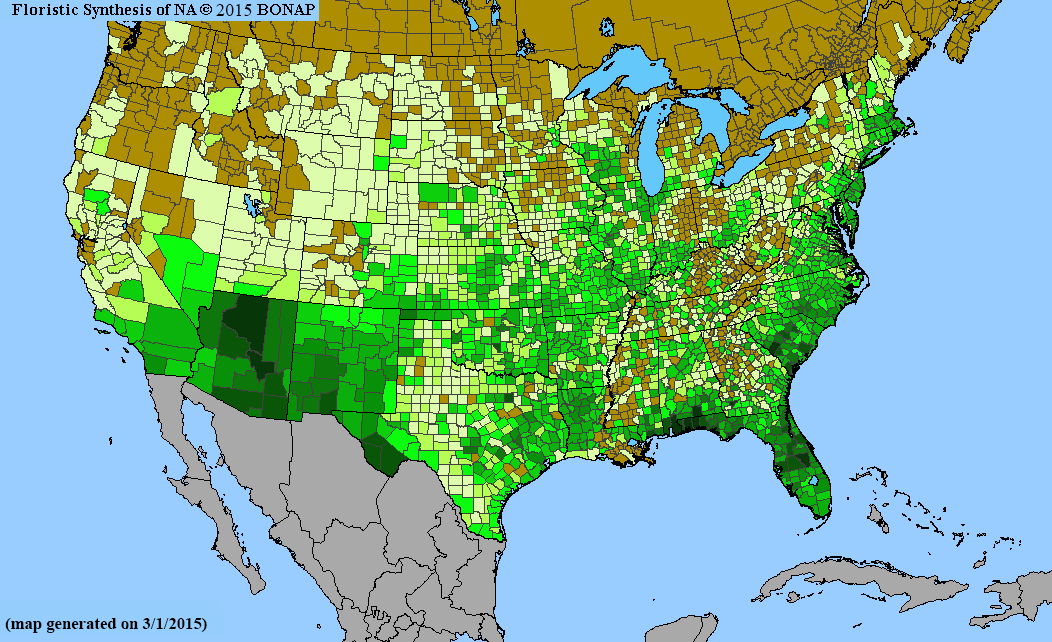
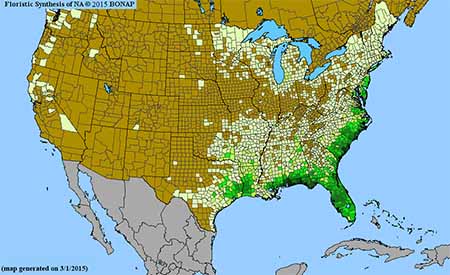
Density gradient of native species for Euphorbia. Darkest green (39 spp. Cochise County, AZ; Pima County, AZ) indicates the highest species concentration. BONAP©2015
|
Density gradient of native species for Crataegus. Darkest green (23 spp. Kent County, MI) indicates the highest species concentration. BONAP©2015
|
Density gradient of native species for Draba. Darkest green (23 spp. Valdez-Cordova Census Area, AK) indicates the highest species concentration. BONAP©2015
|
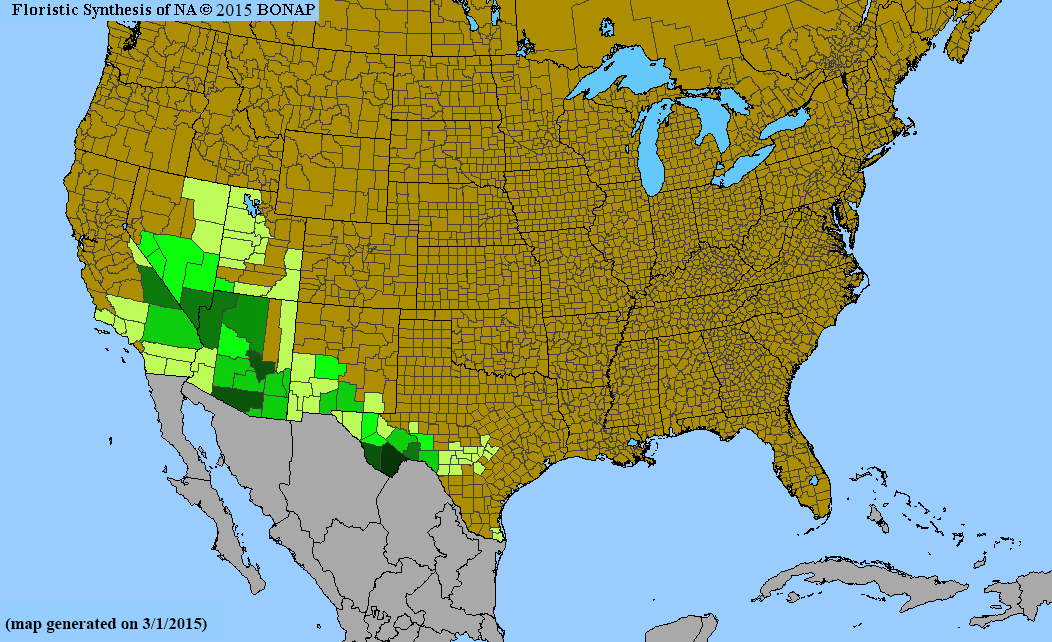
Density gradient of native species for Castilleja. Darkest green (21 spp. Fresno County, CA) indicates the highest species concentration. BONAP©2015
|
|
Density gradient of native species for Juncus. Darkest green (33 spp. Plumas County, CA) indicates the highest species concentration. BONAP©2015
|
Density gradient of native species for Cyperus. Darkest green (33 spp. Mobile County, AL) indicates the highest species concentration. BONAP©2015
|
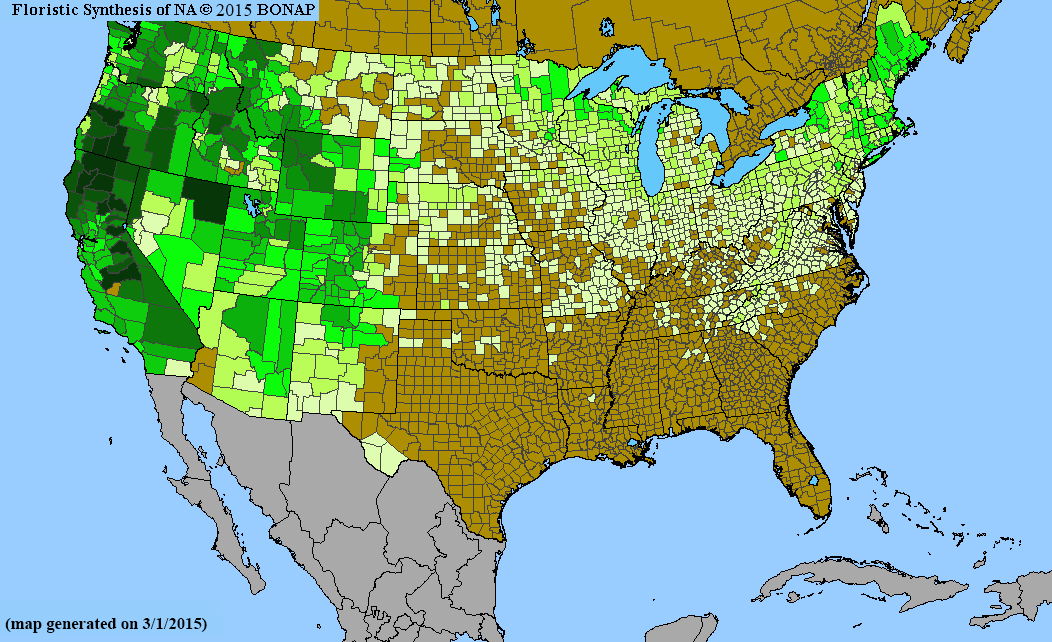
Density gradient of native species for Boechera. Darkest green (36 spp. Mono County, CA) indicates the highest species concentration. BONAP©2015
|

Density gradient of native species for Salix. Darkest green (29 spp. Park County, WY) indicates the highest species concentration. BONAP©2015
|
Density gradient of native species for Quercus. Darkest green (27 spp. Berkeley County, SC) indicates the highest species concentration. BONAP©2015
|
Density gradient of native species for Rhynchospora. Darkest green (48 spp. Berkeley County, SC) indicates the highest species concentration. BONAP©2015
|
Density gradient of native species for Physaria. Darkest green (13 spp. Coconino County, AZ) indicates the highest species concentration. BONAP©2015
|
 Density gradient of native species for Allium. Darkest green (18 spp. Shasta County, CA) indicates the highest species concentration. BONAP©2015
| 
Density gradient of native species for Solidago. Darkest green (23 spp. Macon County, NC; Yancey County, NC) indicates the highest species concentration. BONAP©2015
|
Density gradient of native species for Mentzelia. Darkest green (24 spp. San Bernardino County, CA) indicates the highest species concentration. BONAP©2015
|
Density gradient of native species for Lomatium. Darkest green (21 spp. Malheur County, OR) indicates the highest species concentration. BONAP©2015
|
Density gradient of native species for Oenothera. Darkest green (24 spp. Socorro County, NM; Presidio County, TX) indicates the highest species concentration. BONAP©2015
|

Density gradient of native species for Cyanea. Darkest green (31 spp. Maui County, HI) indicates the highest species concentration. BONAP©2015
|
Density gradient of native species for Potentilla. Darkest green (22 spp. Park County, WY) indicates the highest species concentration. BONAP©2015
|
Density gradient of native species for Symphyotrichum. Darkest green (24 spp. Cook County, IL) indicates the highest species concentration. BONAP©2015
|
|
Density gradient of native species for Asclepias. Darkest green (18 spp. Cochise County, AZ; Pima County, AZ; Grant County, NM) indicates the highest species concentration. BONAP©2015
|
Density gradient of native species for Viola. Darkest green (23 spp. Blount County, TN; Sevier County, TN) indicates the highest species concentration. BONAP©2015
|
Density gradient of native species for Mimulus. Darkest green (30 spp. Tulare County, CA; Tuolumne County, CA) indicates the highest species concentration. BONAP©2015
|
Density gradient of native species for Asplenium. Darkest green (22 spp. Hawaii County, HI; Maui County, HI) indicates the highest species concentration. BONAP©2015
|
Density gradient of native species for Muhlenbergia. Darkest green (34 spp. Cochise County, AZ; Catron County, NM) indicates the highest species concentration. BONAP©2015
|
Density gradient of native species for Poa. Darkest green (18 spp. Gunnison County, CO) indicates the highest species concentration. BONAP©2015
|
Density gradient of native species for Trifolium. Darkest green (24 spp. Mendocino County, CA) indicates the highest species concentration. BONAP©2015
|
Density gradient of native species for Ranunculus. Darkest green (23 spp. Park County, WY) indicates the highest species concentration. BONAP©2015
|
Density gradient of native species for Dalea. Darkest green (22 spp. Cochise County, AZ; Pima County, AZ) indicates the highest species concentration. BONAP©2015
|
Density gradient of native species for Eleocharis. Darkest green (25 spp. Mobile County, AL) indicates the highest species concentration. BONAP©2015
|
Density gradient of native species for Galium. Darkest green (20 spp. San Bernardino County, CA) indicates the highest species concentration. BONAP©2015
|
Density gradient of native species for Silene. Darkest green (16 spp. Shasta County, CA) indicates the highest species concentration. BONAP©2015
|
Density gradient of native species for Phlox. Darkest green (11 spp. Baker County, OR) indicates the highest species concentration. BONAP©2015
|
Density gradient of native species for Arctostaphylos. Darkest green (19 spp. Monterey County, CA) indicates the highest species concentration. BONAP©2015
|
Density gradient of native species for Atriplex. Darkest green (20 spp. Kern County, CA) indicates the highest species concentration. BONAP©2015
|
Density gradient of native species for Cirsium. Darkest green (12 spp. Apache County, AZ) indicates the highest species concentration. BONAP©2015
|
Density gradient of native species for Oreocarya. Darkest green (16 spp. Emery County, UT; Garfield County, UT) indicates the highest species concentration. BONAP©2015
|

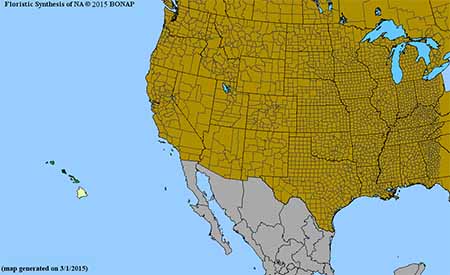
Density gradient of native species for Cyrtandra. Darkest green (33 spp. Honolulu County, HI) indicates the highest species concentration. BONAP©2015
|
Density gradient of native species for Delphinium. Darkest green (16 spp. Tulare County, CA) indicates the highest species concentration. BONAP©2015
|
Density gradient of native species for Calochortus. Darkest green (17 spp. Kern County, CA) indicates the highest species concentration. BONAP©2015
|
Density gradient of native species for Packera. Darkest green (12 spp. Rio Arriba County, NM; Albany County, WY) indicates the highest species concentration. BONAP©2015
|
Density gradient of native species for Artemisia. Darkest green (18 spp. Fremont County, WY) indicates the highest species concentration. BONAP©2015
|
Density gradient of native species for Hypericum. Darkest green (24 spp. Franklin County, FL) indicates the highest species concentration. BONAP©2015
|
Density gradient of native species for Senecio. Darkest green (17 spp. Larimer County, CO) indicates the highest species concentration. BONAP©2015
|
Density gradient of native species for Helianthus. Darkest green (15 spp. Richland County, SC) indicates the highest species concentration. BONAP©2015
|
Density gradient of native species for Ceanothus. Darkest green (19 spp. Riverside County, CA) indicates the highest species concentration. BONAP©2015
|
Density gradient of native species for Peperomia. Darkest green (20 spp. Maui County, HI) indicates the highest species concentration. BONAP©2015
|
Density gradient of native species for Cryptantha. Darkest green (24 spp. Inyo County, CA) indicates the highest species concentration. BONAP©2015
|
Density gradient of native species for Cuscuta. Darkest green (13 spp. Pima County, AZ; Dona Ana County, NM) indicates the highest species concentration. BONAP©2015
|
Density gradient of native species for Ribes. Darkest green (17 spp. Los Angeles County, CA) indicates the highest species concentration. BONAP©2015
|
Density gradient of native species for Desmodium. Darkest green (18 spp. Leon County, FL; Berkeley County, SC) indicates the highest species concentration. BONAP©2015
|

Density gradient of native species for Melicope. Darkest green (24 spp. Honolulu County, HI) indicates the highest species concentration. BONAP©2015
|
Density gradient of native species for Paspalum. Darkest green (19 spp. Brazoria County, TX) indicates the highest species concentration. BONAP©2015
|
Density gradient of native species for Salvia. Darkest green (14 spp. San Diego County, CA) indicates the highest species concentration. BONAP©2015
|
Density gradient of native species for Micranthes. Darkest green (13 spp. Siskiyou County, CA; Clackamas County, OR; Jackson County, OR) indicates the highest species concentration. BONAP©2015
|
Density gradient of native species for Plagiobothrys. Darkest green (21 spp. Stanislaus County, CA) indicates the highest species concentration. BONAP©2015
|
Density gradient of native species for Solanum. Darkest green (11 spp. Pima County, AZ) indicates the highest species concentration. BONAP©2015
|
Density gradient of native species for Bidens. Darkest green (14 spp. Honolulu County, HI) indicates the highest species concentration. BONAP©2015
|
Density gradient of native species for Lobelia. Darkest green (11 spp. Honolulu County, HI) indicates the highest species concentration. BONAP©2015
|
Density gradient of native species for Polygonum. Darkest green (13 spp. Plumas County, CA) indicates the highest species concentration. BONAP©2015
|
Density gradient of native species for Selaginella. Darkest green (10 spp. Brewster County, TX) indicates the highest species concentration. BONAP©2015
|
Density gradient of native species for Croton. Darkest green (14 spp. Hidalgo County, TX) indicates the highest species concentration. BONAP©2015
|
Density gradient of native species for Cymopterus. Darkest green (11 spp. Garfield County, UT)indicates the highest species concentration. BONAP©2015
|
Density gradient of native species for Clarkia. Darkest green (19 spp. Monterey County, CA) indicates the highest species concentration. BONAP©2015
|
Density gradient of native species for Ipomoea. Darkest green (13 spp. Cochise County, AZ; Santa Cruz County, AZ; Miami-Dade County, FL) indicates the highest species concentration. BONAP©2015
|
Density gradient of native species for Scutellaria. Darkest green (10 spp. Hamilton County, TN) indicates the highest species concentration. BONAP©2015
|
Density gradient of native species for Sisyrinchium. Darkest green (9 spp. Floyd County, GA; Harris County, TX; Liberty County, TX) indicates the highest species concentration. BONAP©2015
|
Density gradient of native species for Festuca. Darkest green (11 spp. Larimer County, CO; Flathead County, MT; Glacier County, MT; Taos County, NM) indicates the highest species concentration. BONAP©2015
|
Density gradient of native species for Pedicularis. Darkest green (12 spp. North Slope Borough, AK; Northwest Arctic Borough, AK) indicates the highest species concentration. BONAP©2015
|
Density gradient of native species for Polygala. Darkest green (16 spp. Mobile County, AL; St. Tammany Parish, LA) indicates the highest species concentration. BONAP©2015
|
Density gradient of native species for Navarretia. Darkest green (18 spp. Lake County, CA) indicates the highest species concentration. BONAP©2015
|
Density gradient of native species for Pinus. Darkest green (12 spp. Fresno County, CA) indicates the highest species concentration. BONAP©2015
|
Density gradient of native species for Epilobium. Darkest green (19 spp. Plumas County, CA; Shasta County, CA; Siskiyou County, CA) indicates the highest species concentration. BONAP©2015
|
Density gradient of native species for Lysimachia. Darkest green (10 spp. Kauai County, HI) indicates the highest species concentration. BONAP©2015
|
Density gradient of native species for Panicum. Darkest green (10 spp. Honolulu County, HI; Kauai County, HI) indicates the highest species concentration. BONAP©2015
|
Density gradient of native species for Rumex. Darkest green (10 spp. Lassen County, CA) indicates the highest species concentration. BONAP©2015
|
Density gradient of native species for Thelypteris. Darkest green (7 spp. Miami-Dade County, FL) indicates the highest species concentration. BONAP©2015
|
|
Density gradient of native species for Trillium. Darkest green (11 spp. Jackson County, AL; Oconee County, SC; Polk County, TN) indicates the highest species concentration. BONAP©2015
|
Density gradient of native species for Cardamine. Darkest green (9 spp. Plumas & Siskiyou Counties, CA; Casey & Madison Counties KY; Athens County, OH; Lane, Linn & Marion Counties, OR; Bedford County, PA; Blount & Marion Counties; TN; Fayette County, WV)indicates the highest species concentration. BONAP©2015
|
Density gradient of native species for Opuntia. Darkest green (13 spp. Brewster County, TX) indicates the highest species concentration. BONAP©2015
|
|
Density gradient of native species for Agalinis. Darkest green (13 spp. Mobile County, AL; Franklin County, FL; Walton County, FL) indicates the highest species concentration. BONAP©2015
|
Density gradient of native species for Isoetes. Darkest green (7 spp. Pender County, NC) indicates the highest species concentration. BONAP©2015
|
Density gradient of native species for Lepidium. Darkest green (12 spp. Los Angeles County, CA) indicates the highest species concentration. BONAP©2015
|
|
Density gradient of native species for Liatris. Darkest green (11 spp. Aiken County, SC) indicates the highest species concentration. BONAP©2015
|
Density gradient of native species for Aristida. Darkest green (11 spp. Baldwin County, AL) indicates the highest species concentration. BONAP©2015
|
Density gradient of native species for Perityle. Darkest green (7 spp. Brewster County, TX) indicates the highest species concentration. BONAP©2015
|
|
Density gradient of native species for Streptanthus. Darkest green (11 spp. Lake County, CA) indicates the highest species concentration. BONAP©2015
|
Density gradient of native species for Antennaria. Darkest green (17 spp. Park County, WY) indicates the highest species concentration. BONAP©2015
|
Density gradient of native species for Chorizanthe. Darkest green (20 spp. San Luis Obispo County, CA) indicates the highest species concentration. BONAP©2015
|
|
Density gradient of native species for Dichanthelium. Darkest green (20 spp. Jackson County, MS; Moore County, NC) indicates the highest species concentration. BONAP©2015
|
Density gradient of native species for Eragrostis. Darkest green (16 spp. Brazos County, TX) indicates the highest species concentration. BONAP©2015
|
Density gradient of native species for Ericameria. Darkest green (14 spp. Inyo County, CA; Clark County, NV) indicates the highest species concentration. BONAP©2015
|
|
Density gradient of native species for Gilia. Darkest green (23 spp. San Bernardino County, CA) indicates the highest species concentration. BONAP©2015
|
Density gradient of native species for Platanthera. Darkest green (13 spp. Aroostook County, ME) indicates the highest species concentration. BONAP©2015
|
Density gradient of native species for Schiedea. Darkest green (17 spp. Honolulu County, HI) indicates the highest species concentration. BONAP©2015
|
|
Density gradient of native species for Vaccinium. Darkest green (11 spp. Hancock County, ME; Oxford ) indicates the highest species concentration. BONAP©2015
|
|
Return to top of Map View
Return to Graph View
|
|
| |
|
|
|
| Graphs and maps generated by Misako Nishino and John Kartesz. |
|