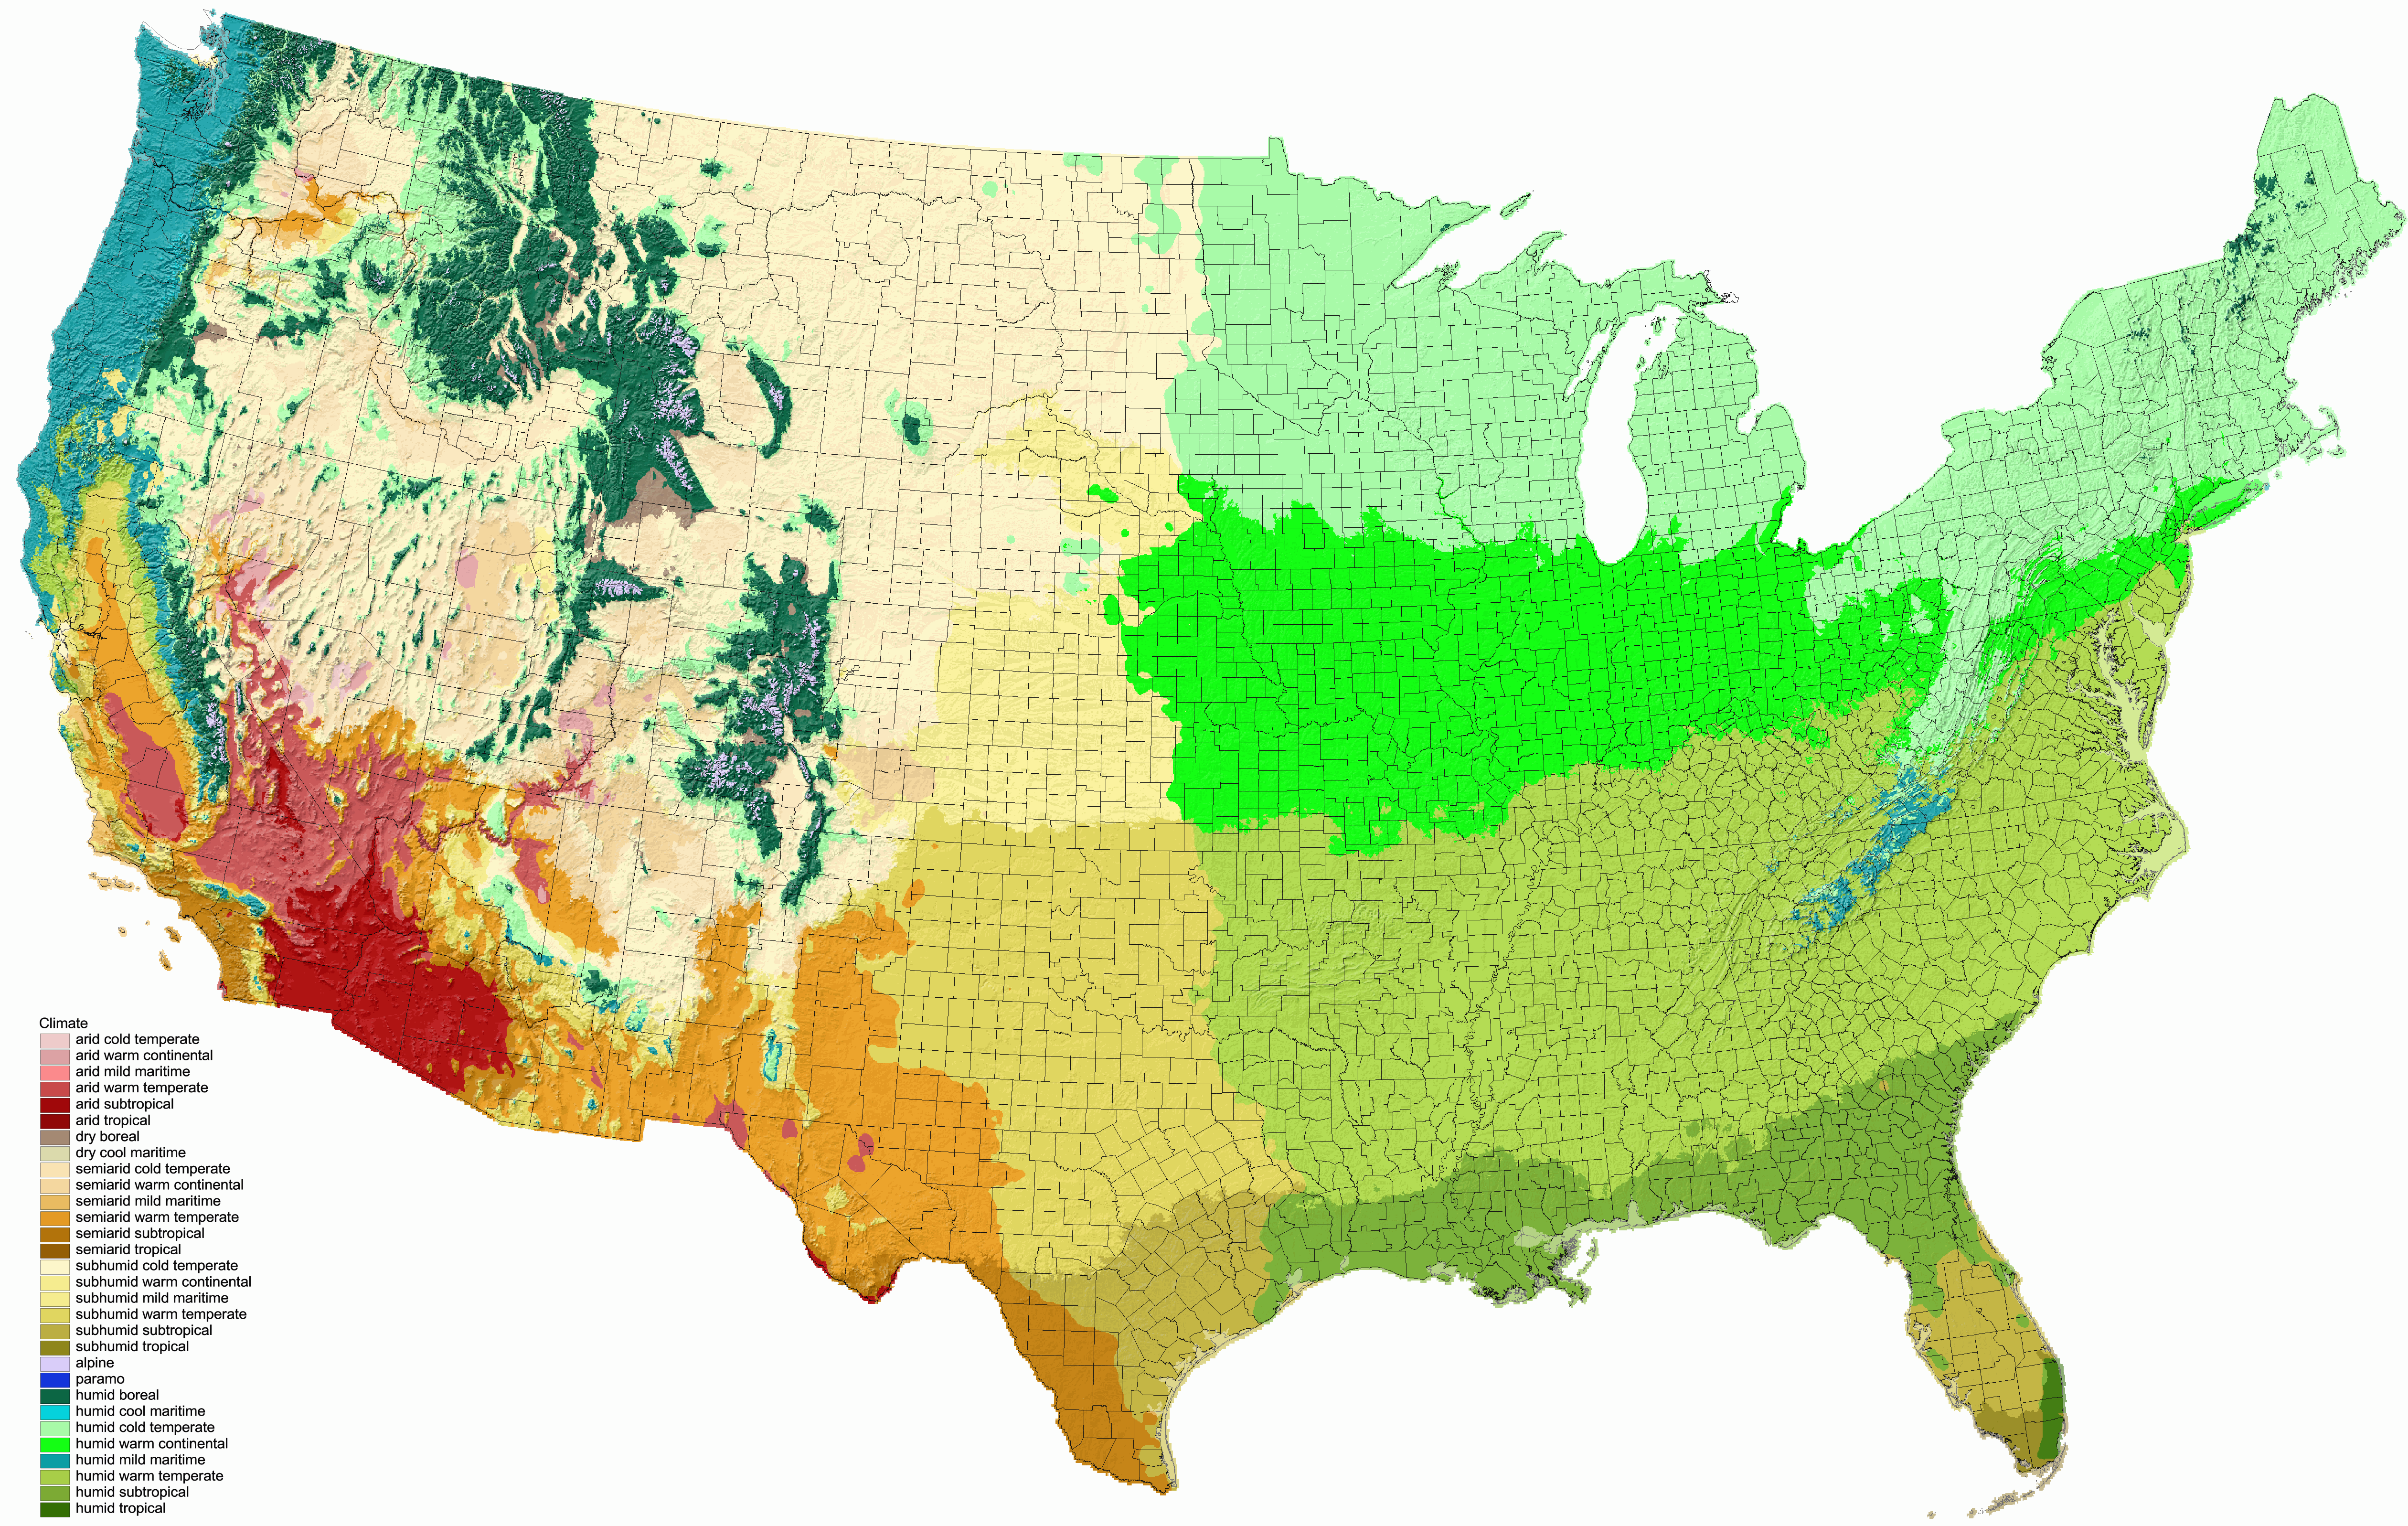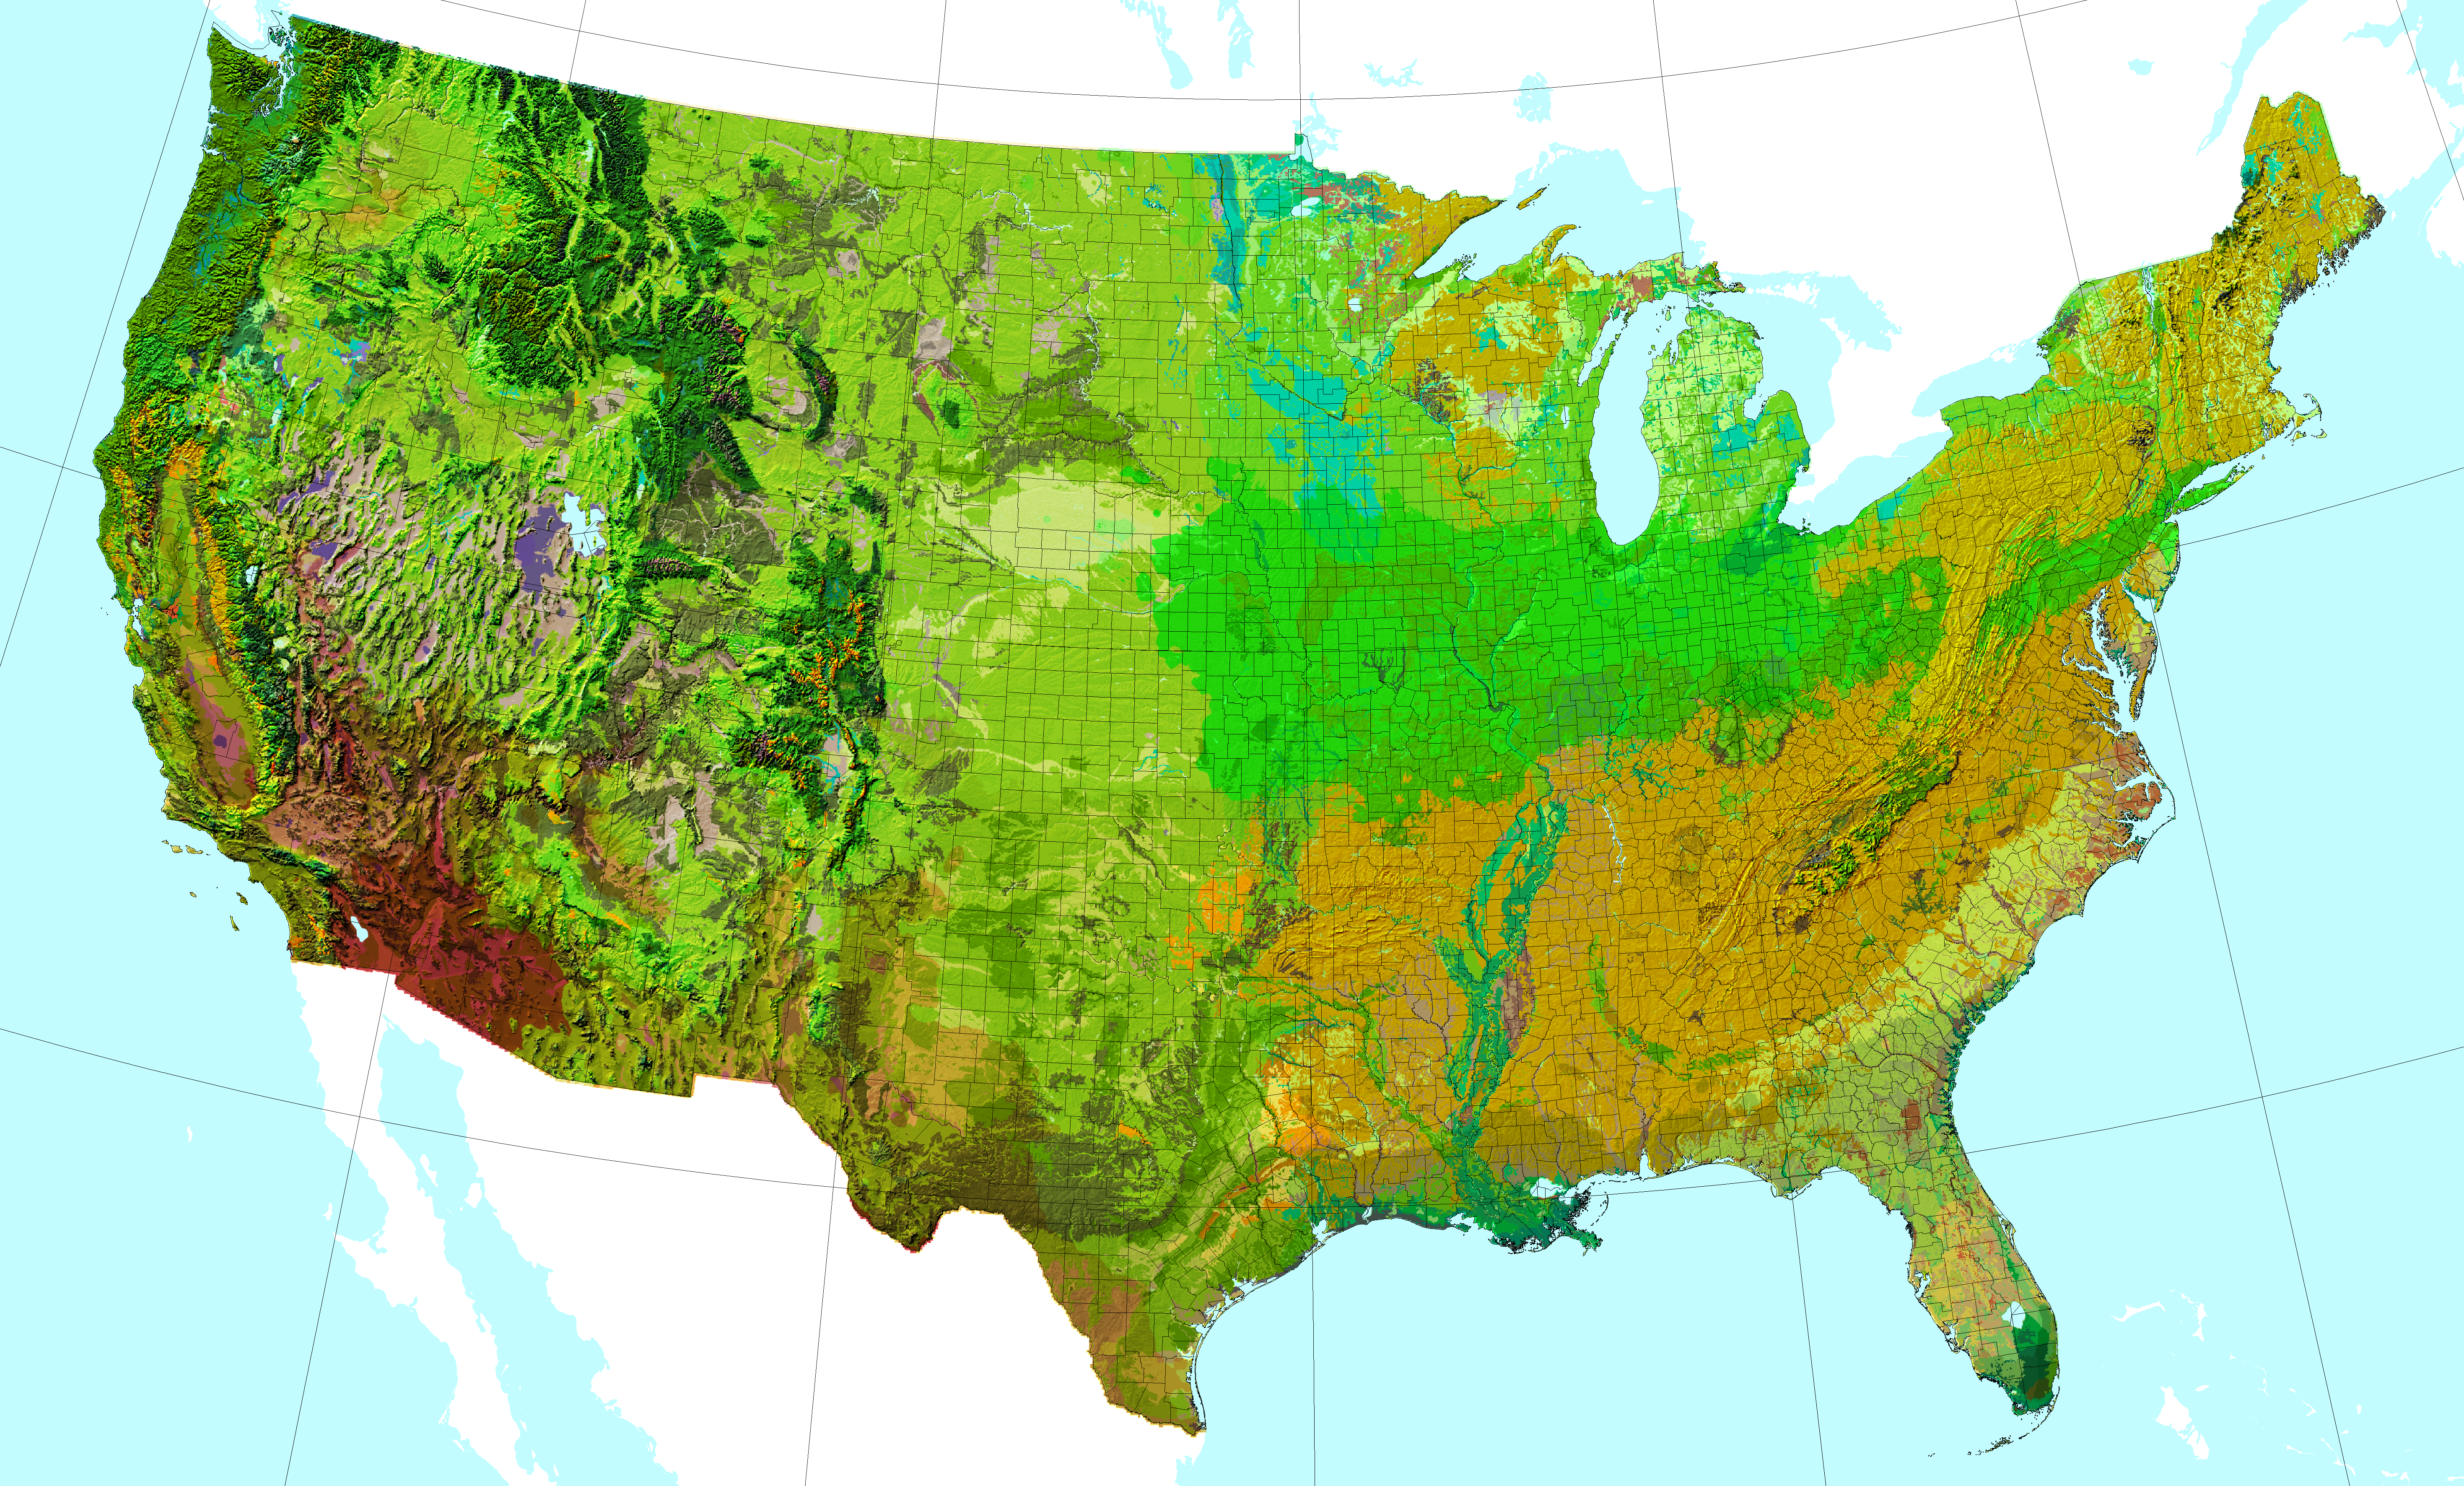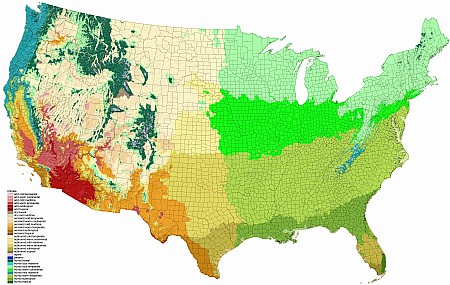
Climate zones of the Lower 48, based on zones of the warmest 6 months, coldest month, and moisture index (ratio of precipitation and positive temperature average; 1971-2000 data from PRISM ©BONAP | 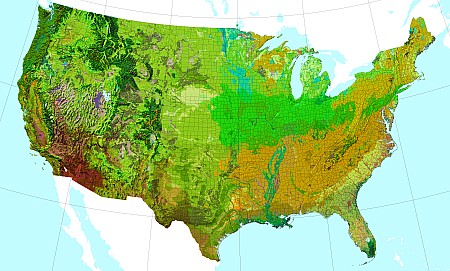 Composite map of climate, soil texture, wetlands, soil pH, and topography. ©BONAP | 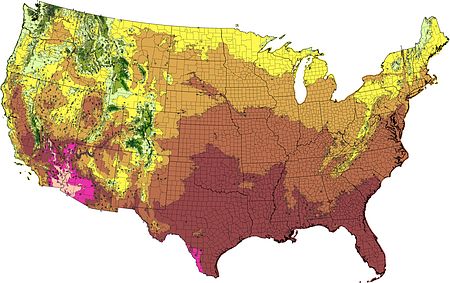
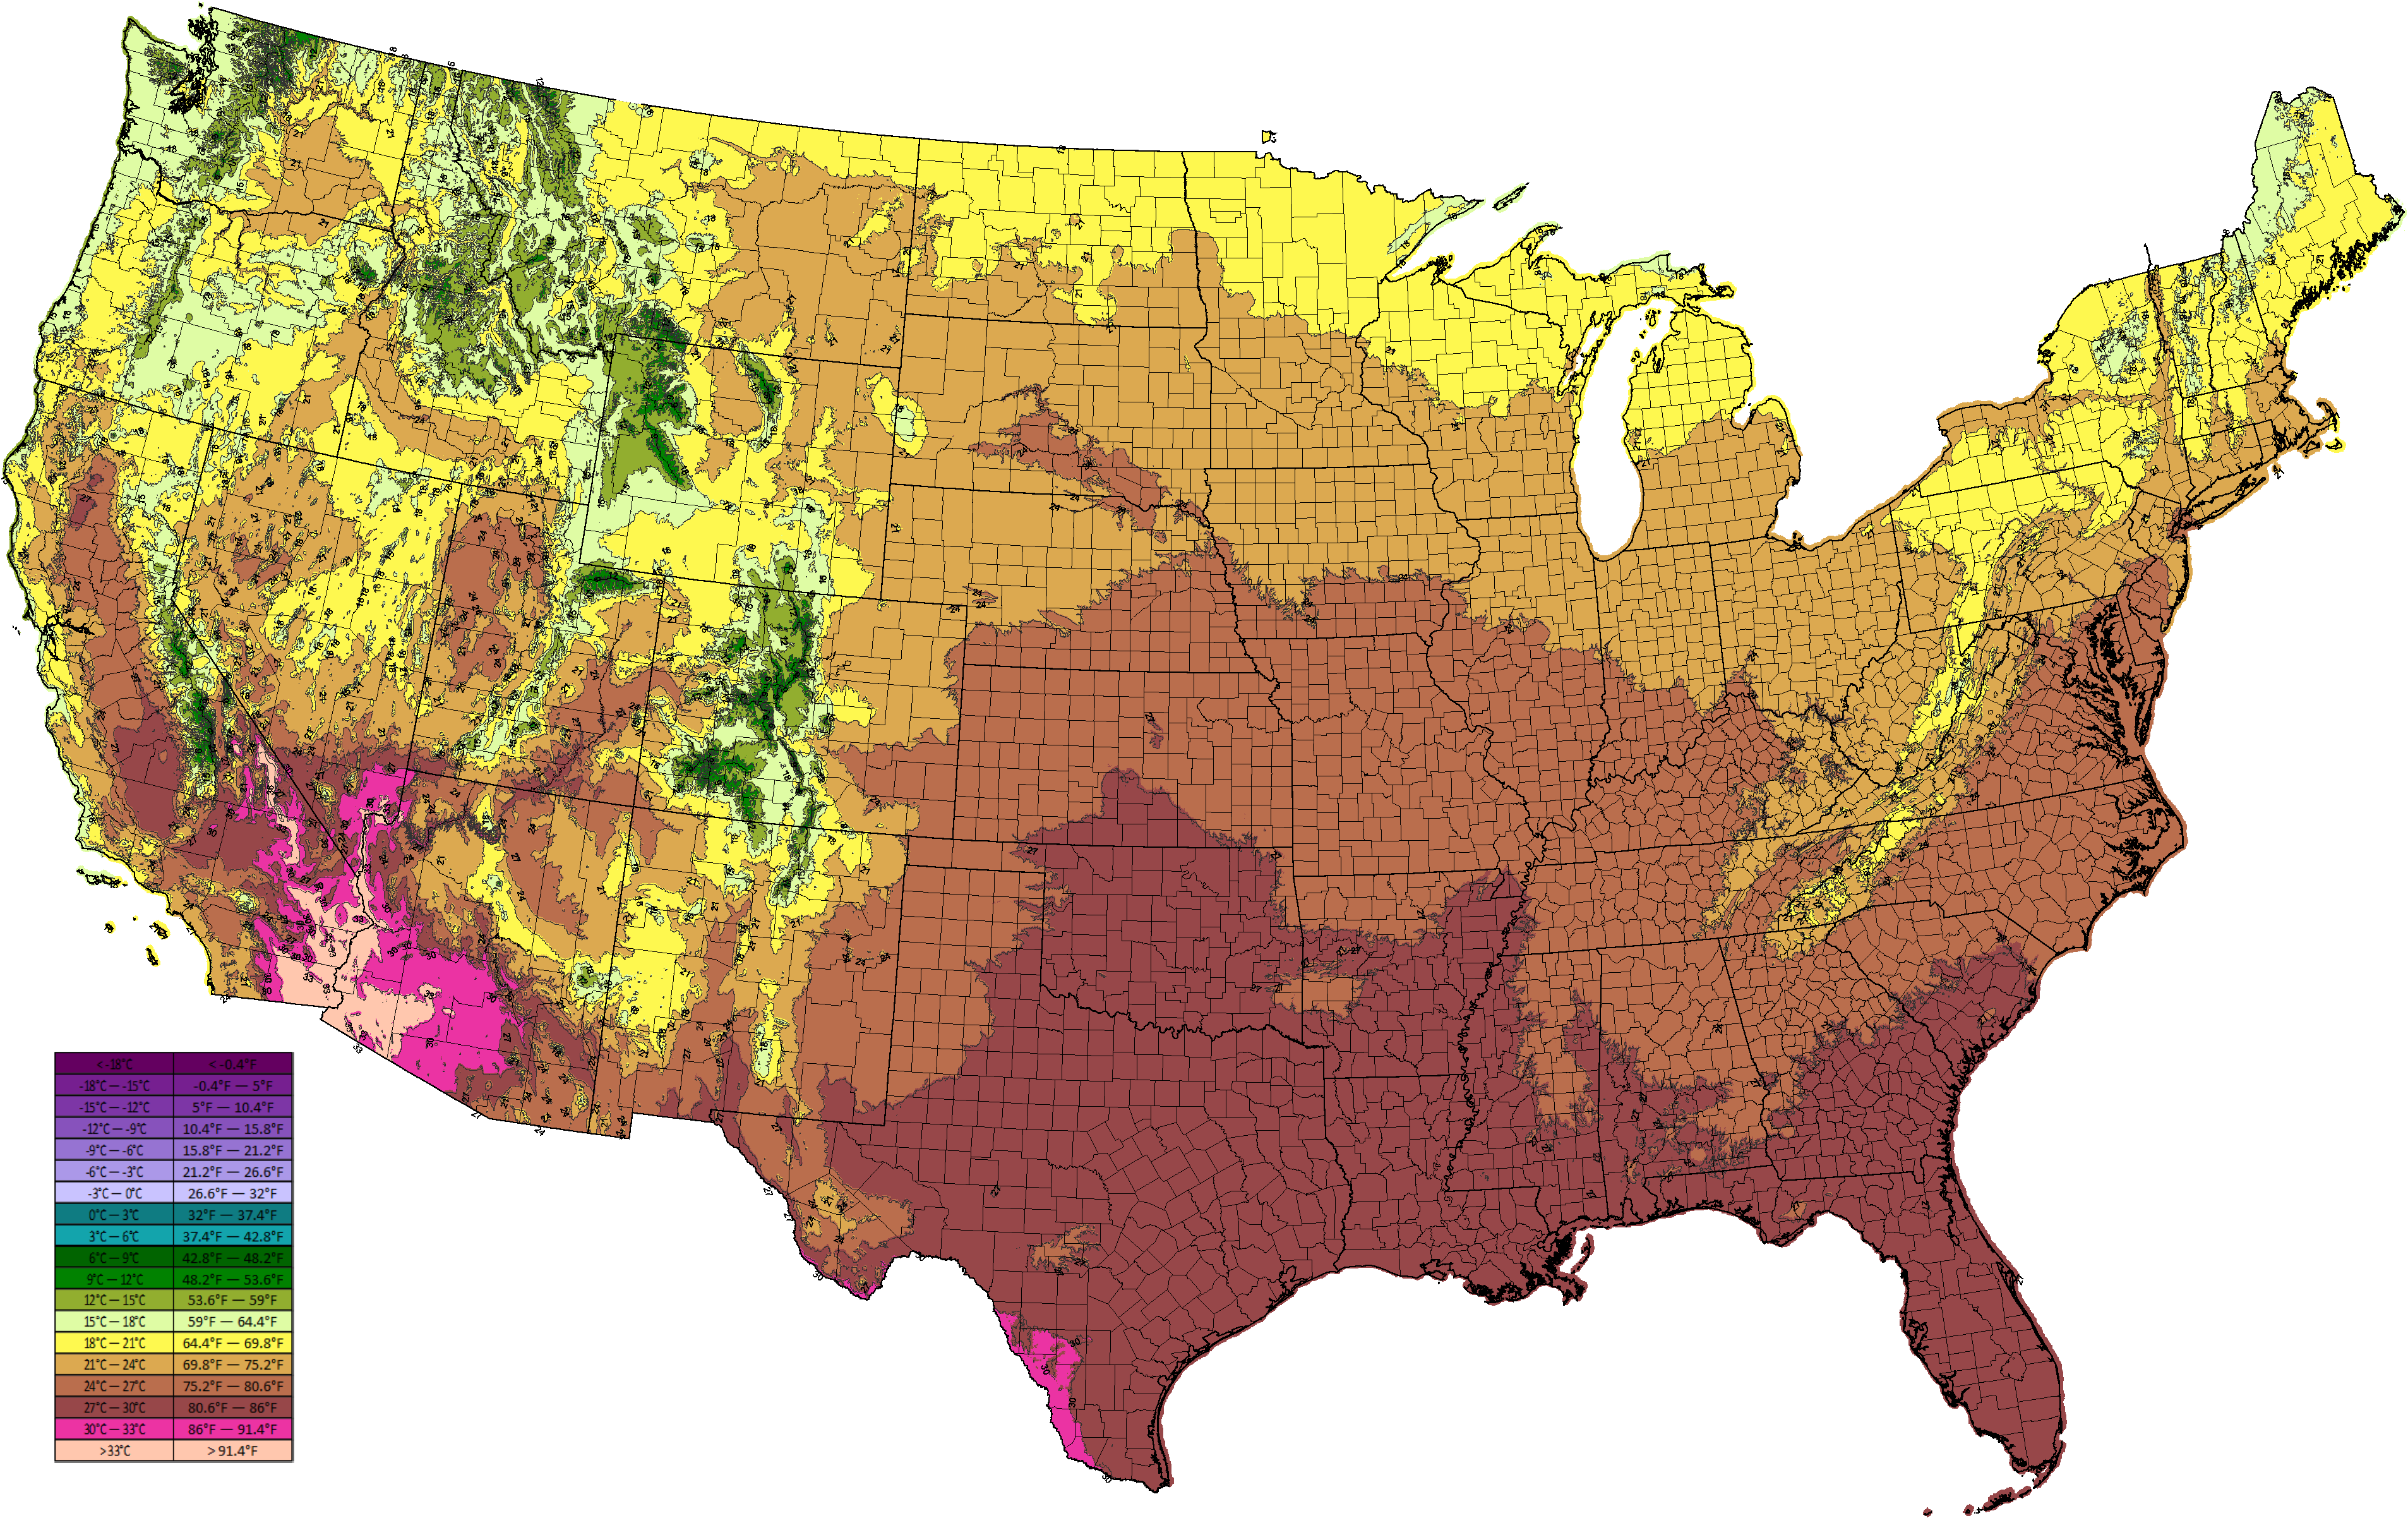
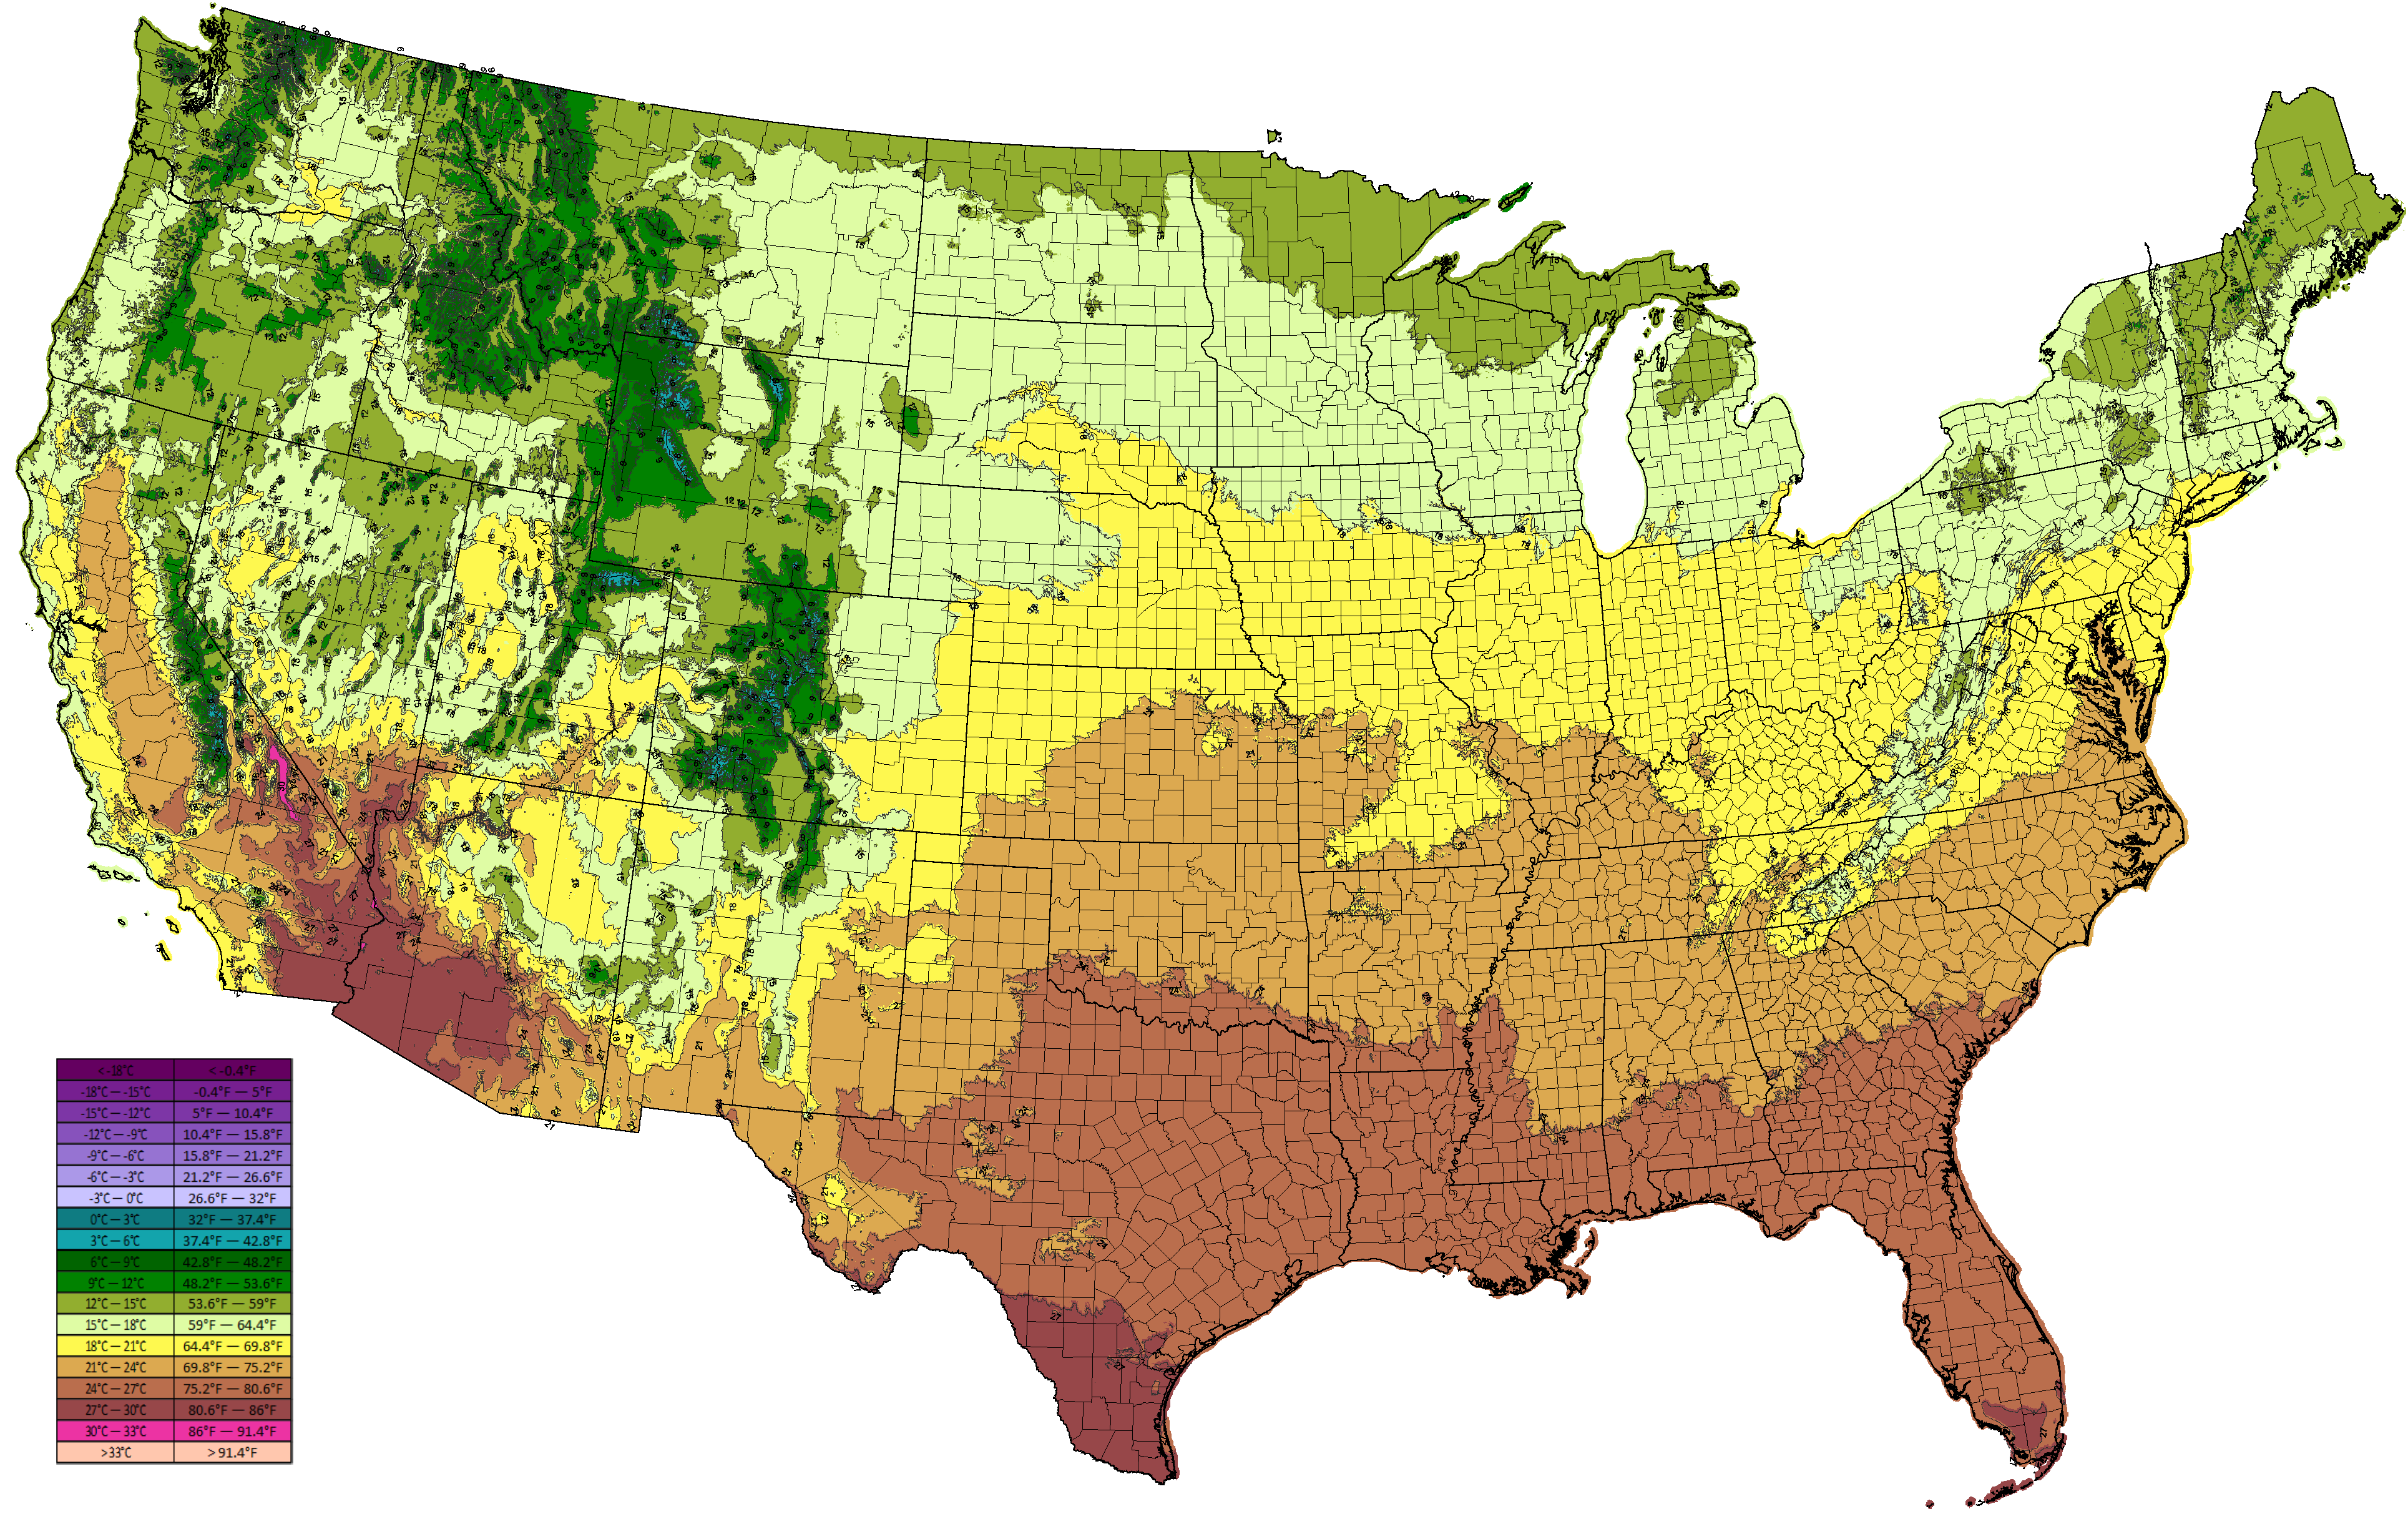
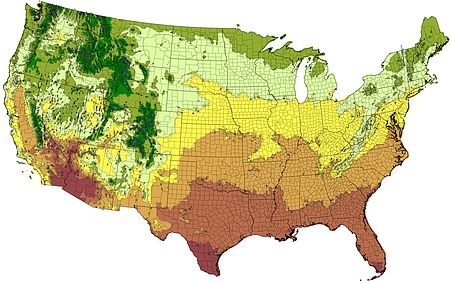
Average temperature of warmest month (July) in °C (Data from PRISM, based on 1971-2000 climate normals) ©BONAP |
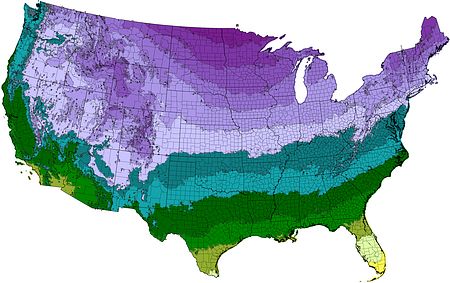
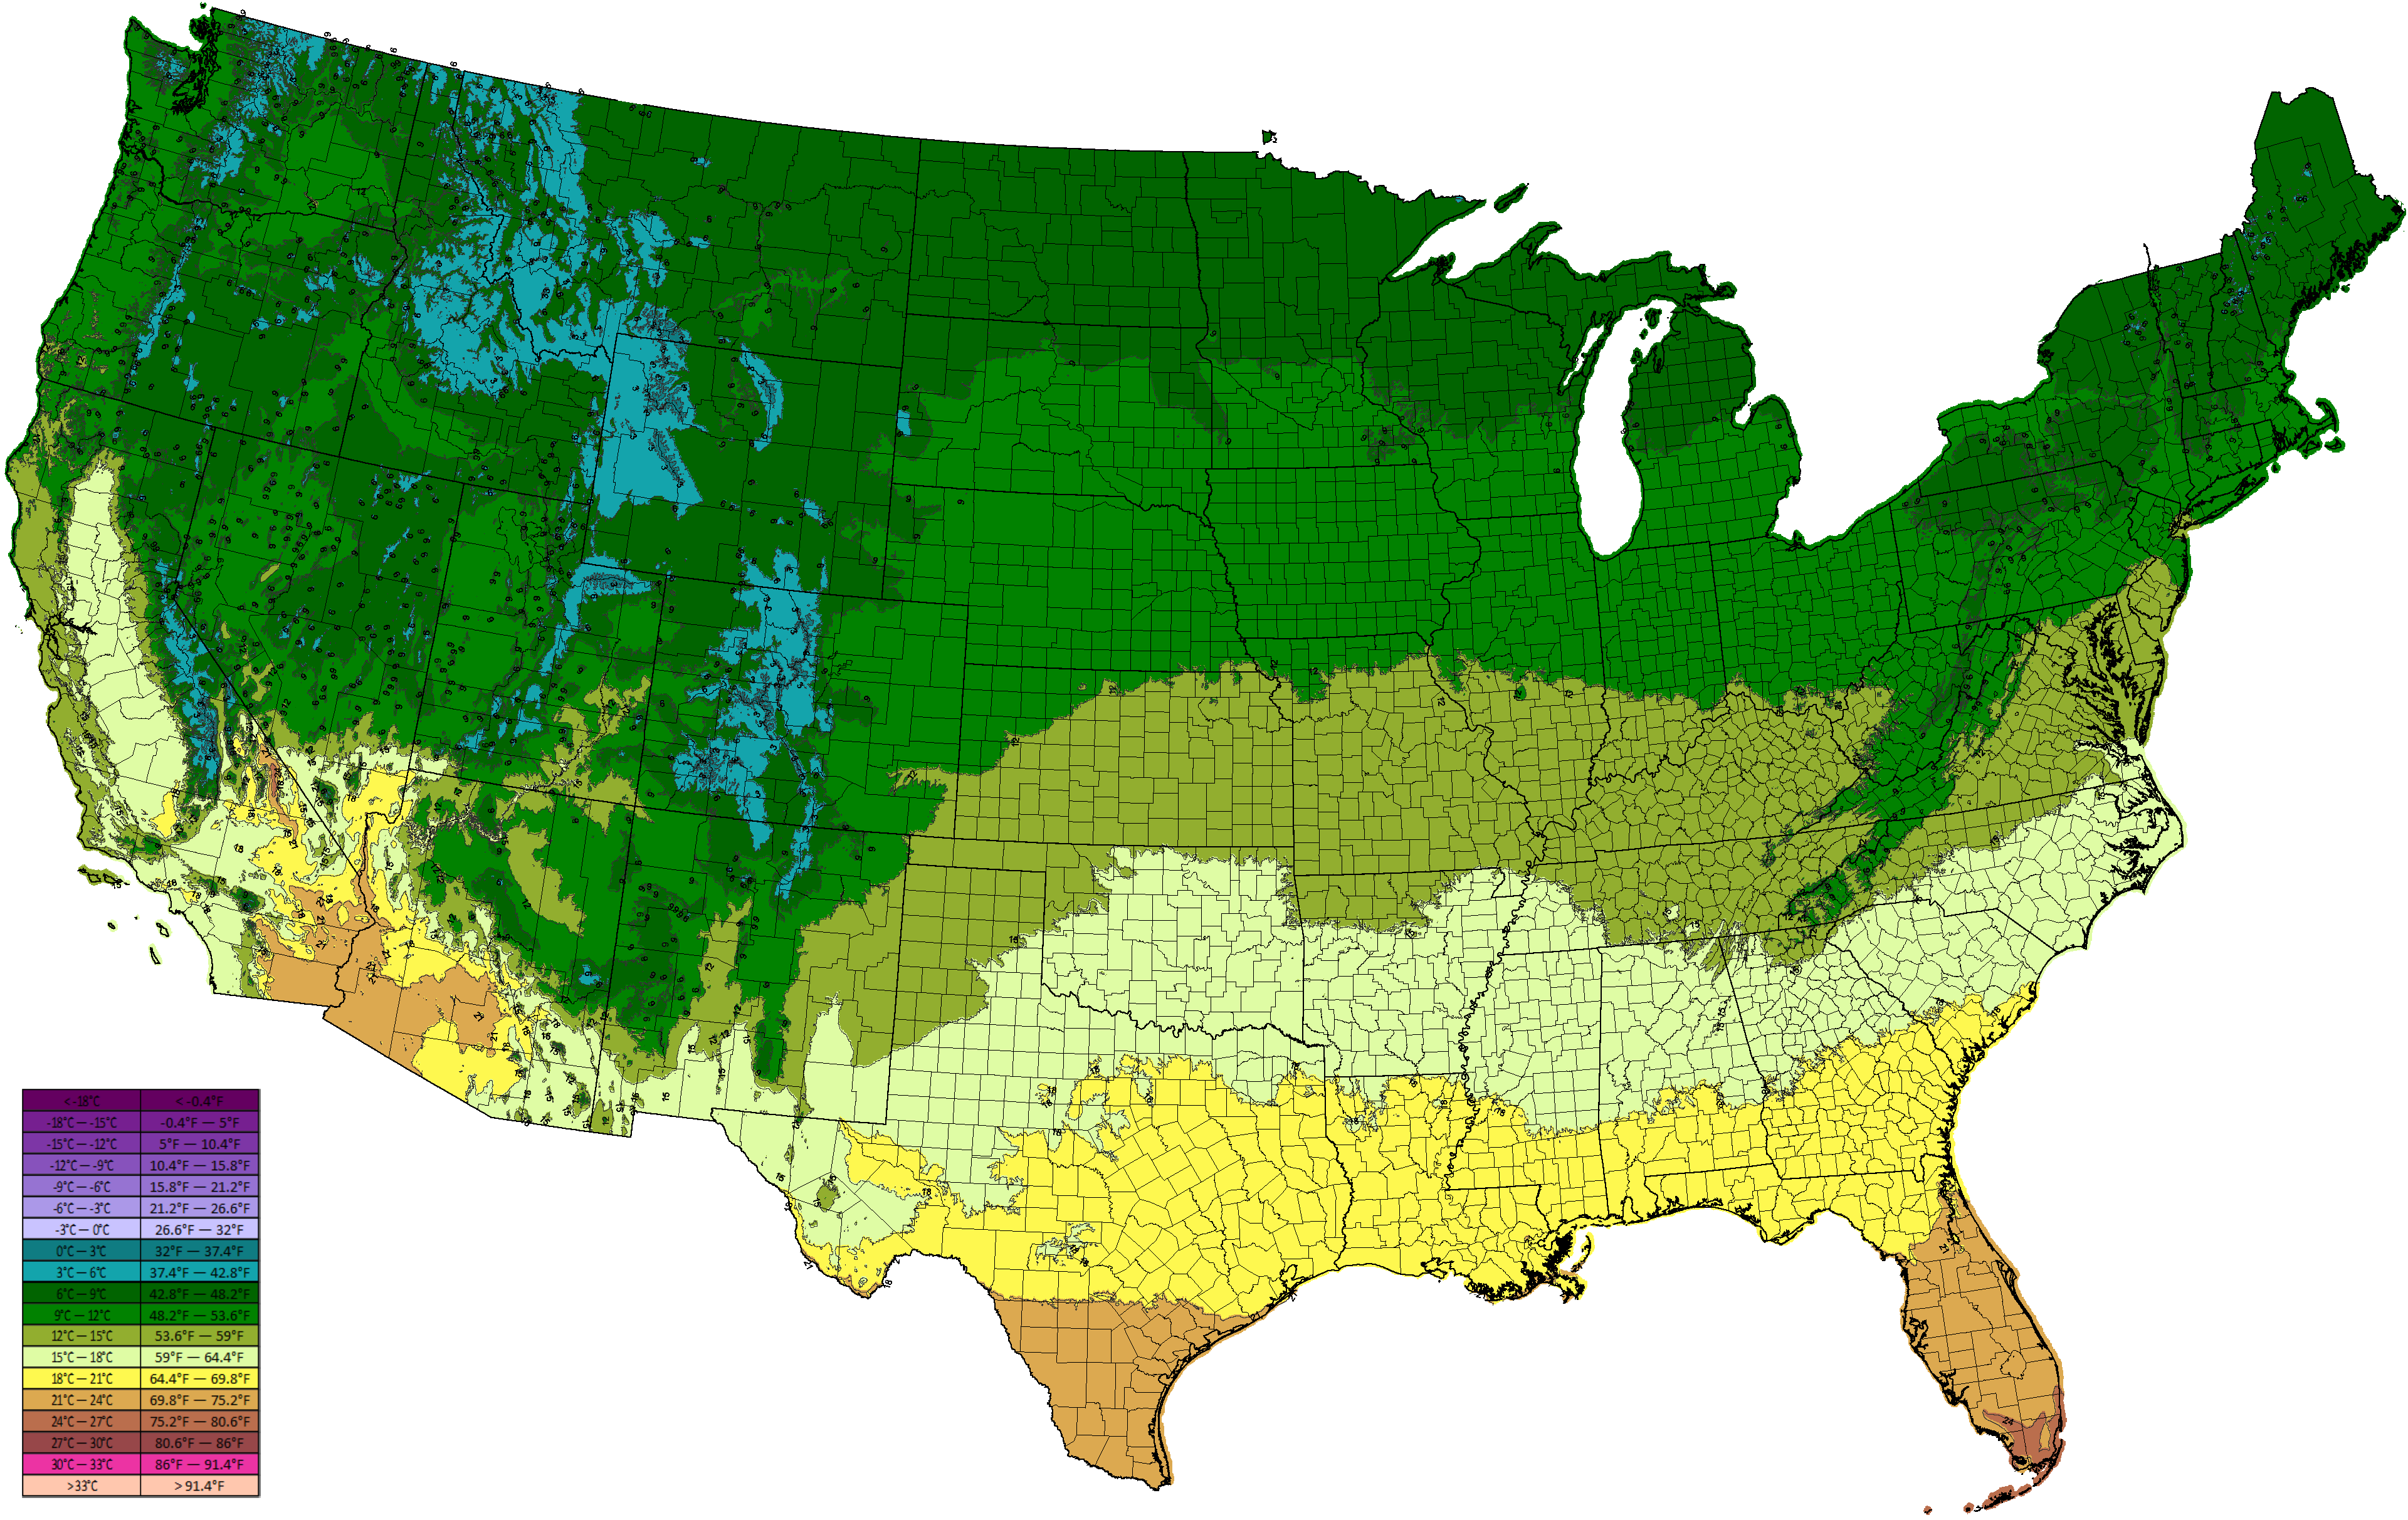
Average temperature of coldest month (January) in °C (Data from PRISM, based on 1971-2000 climate normals) ©BONAP | 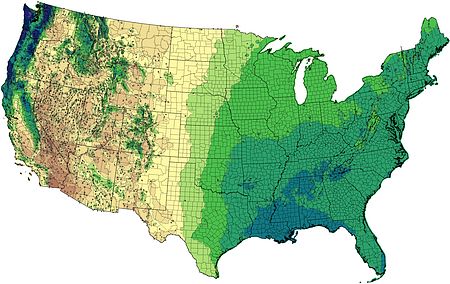
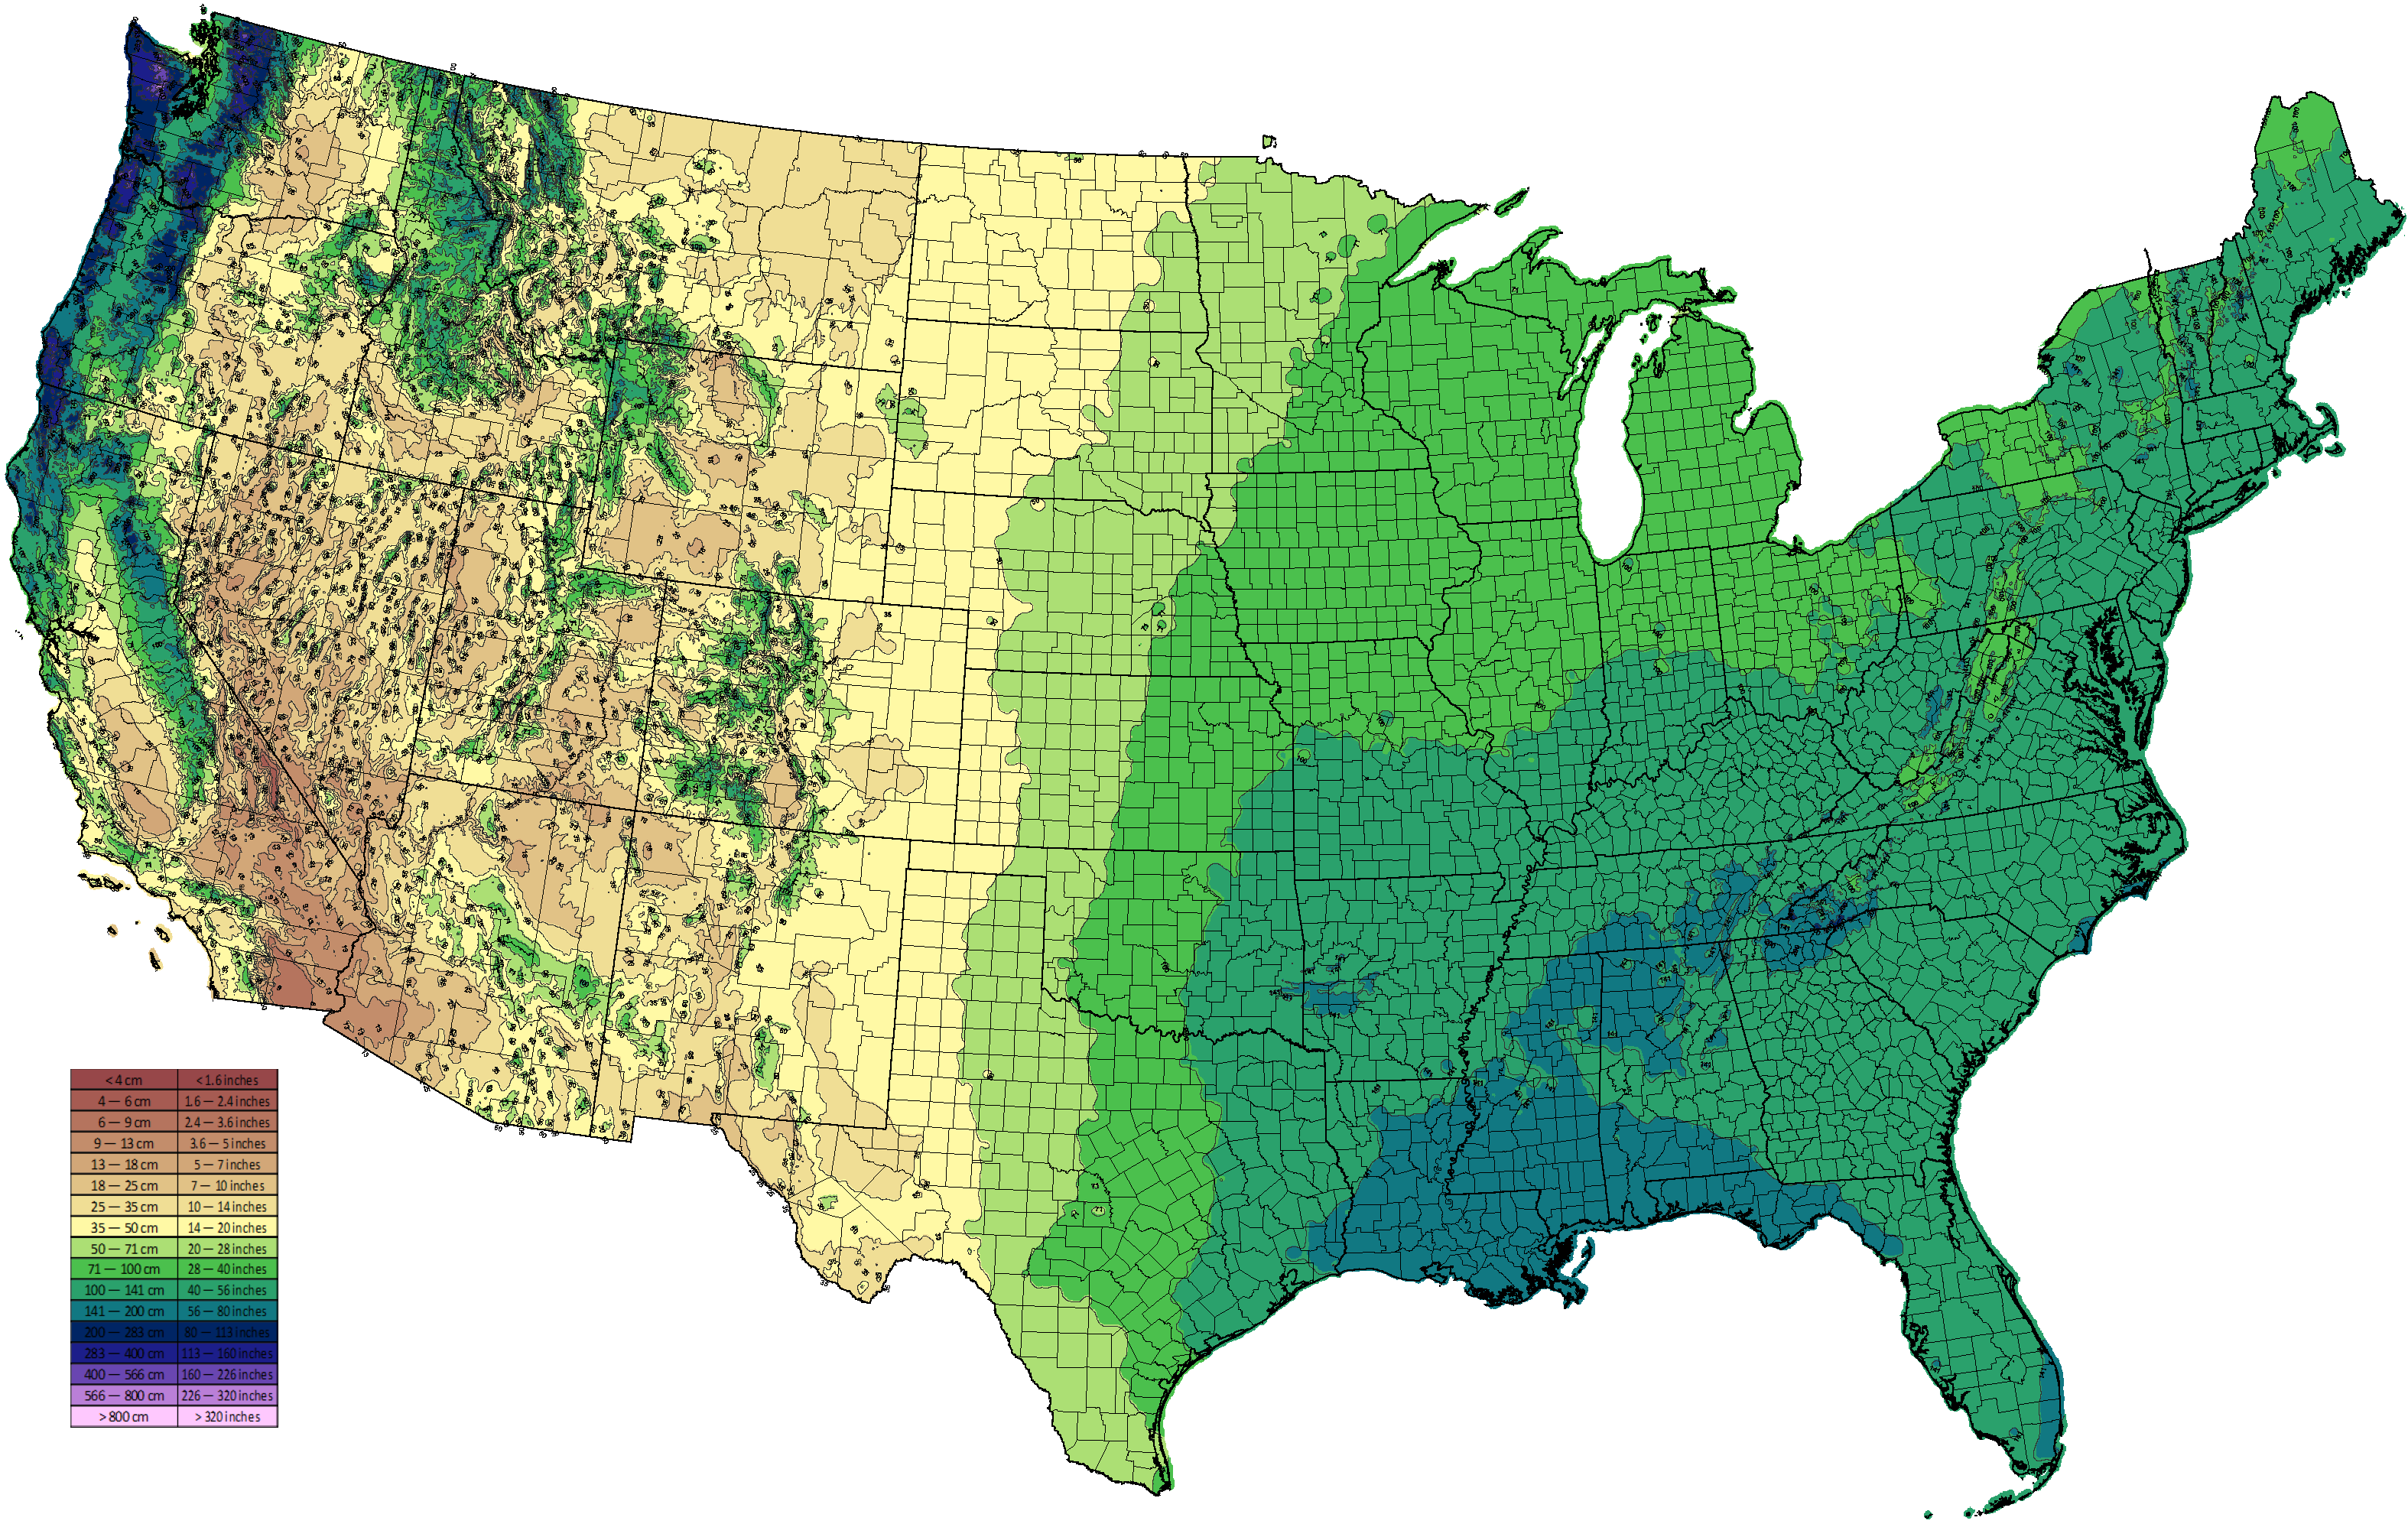
Annual precipitation in centimeters (Data from PRISM, based on 1971-2000 climate normals) ©BONAP | 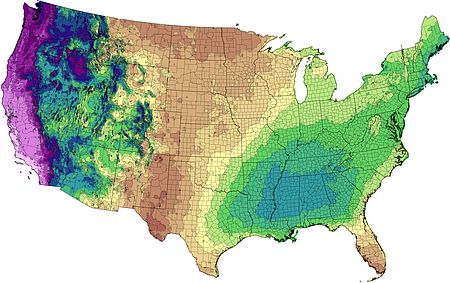
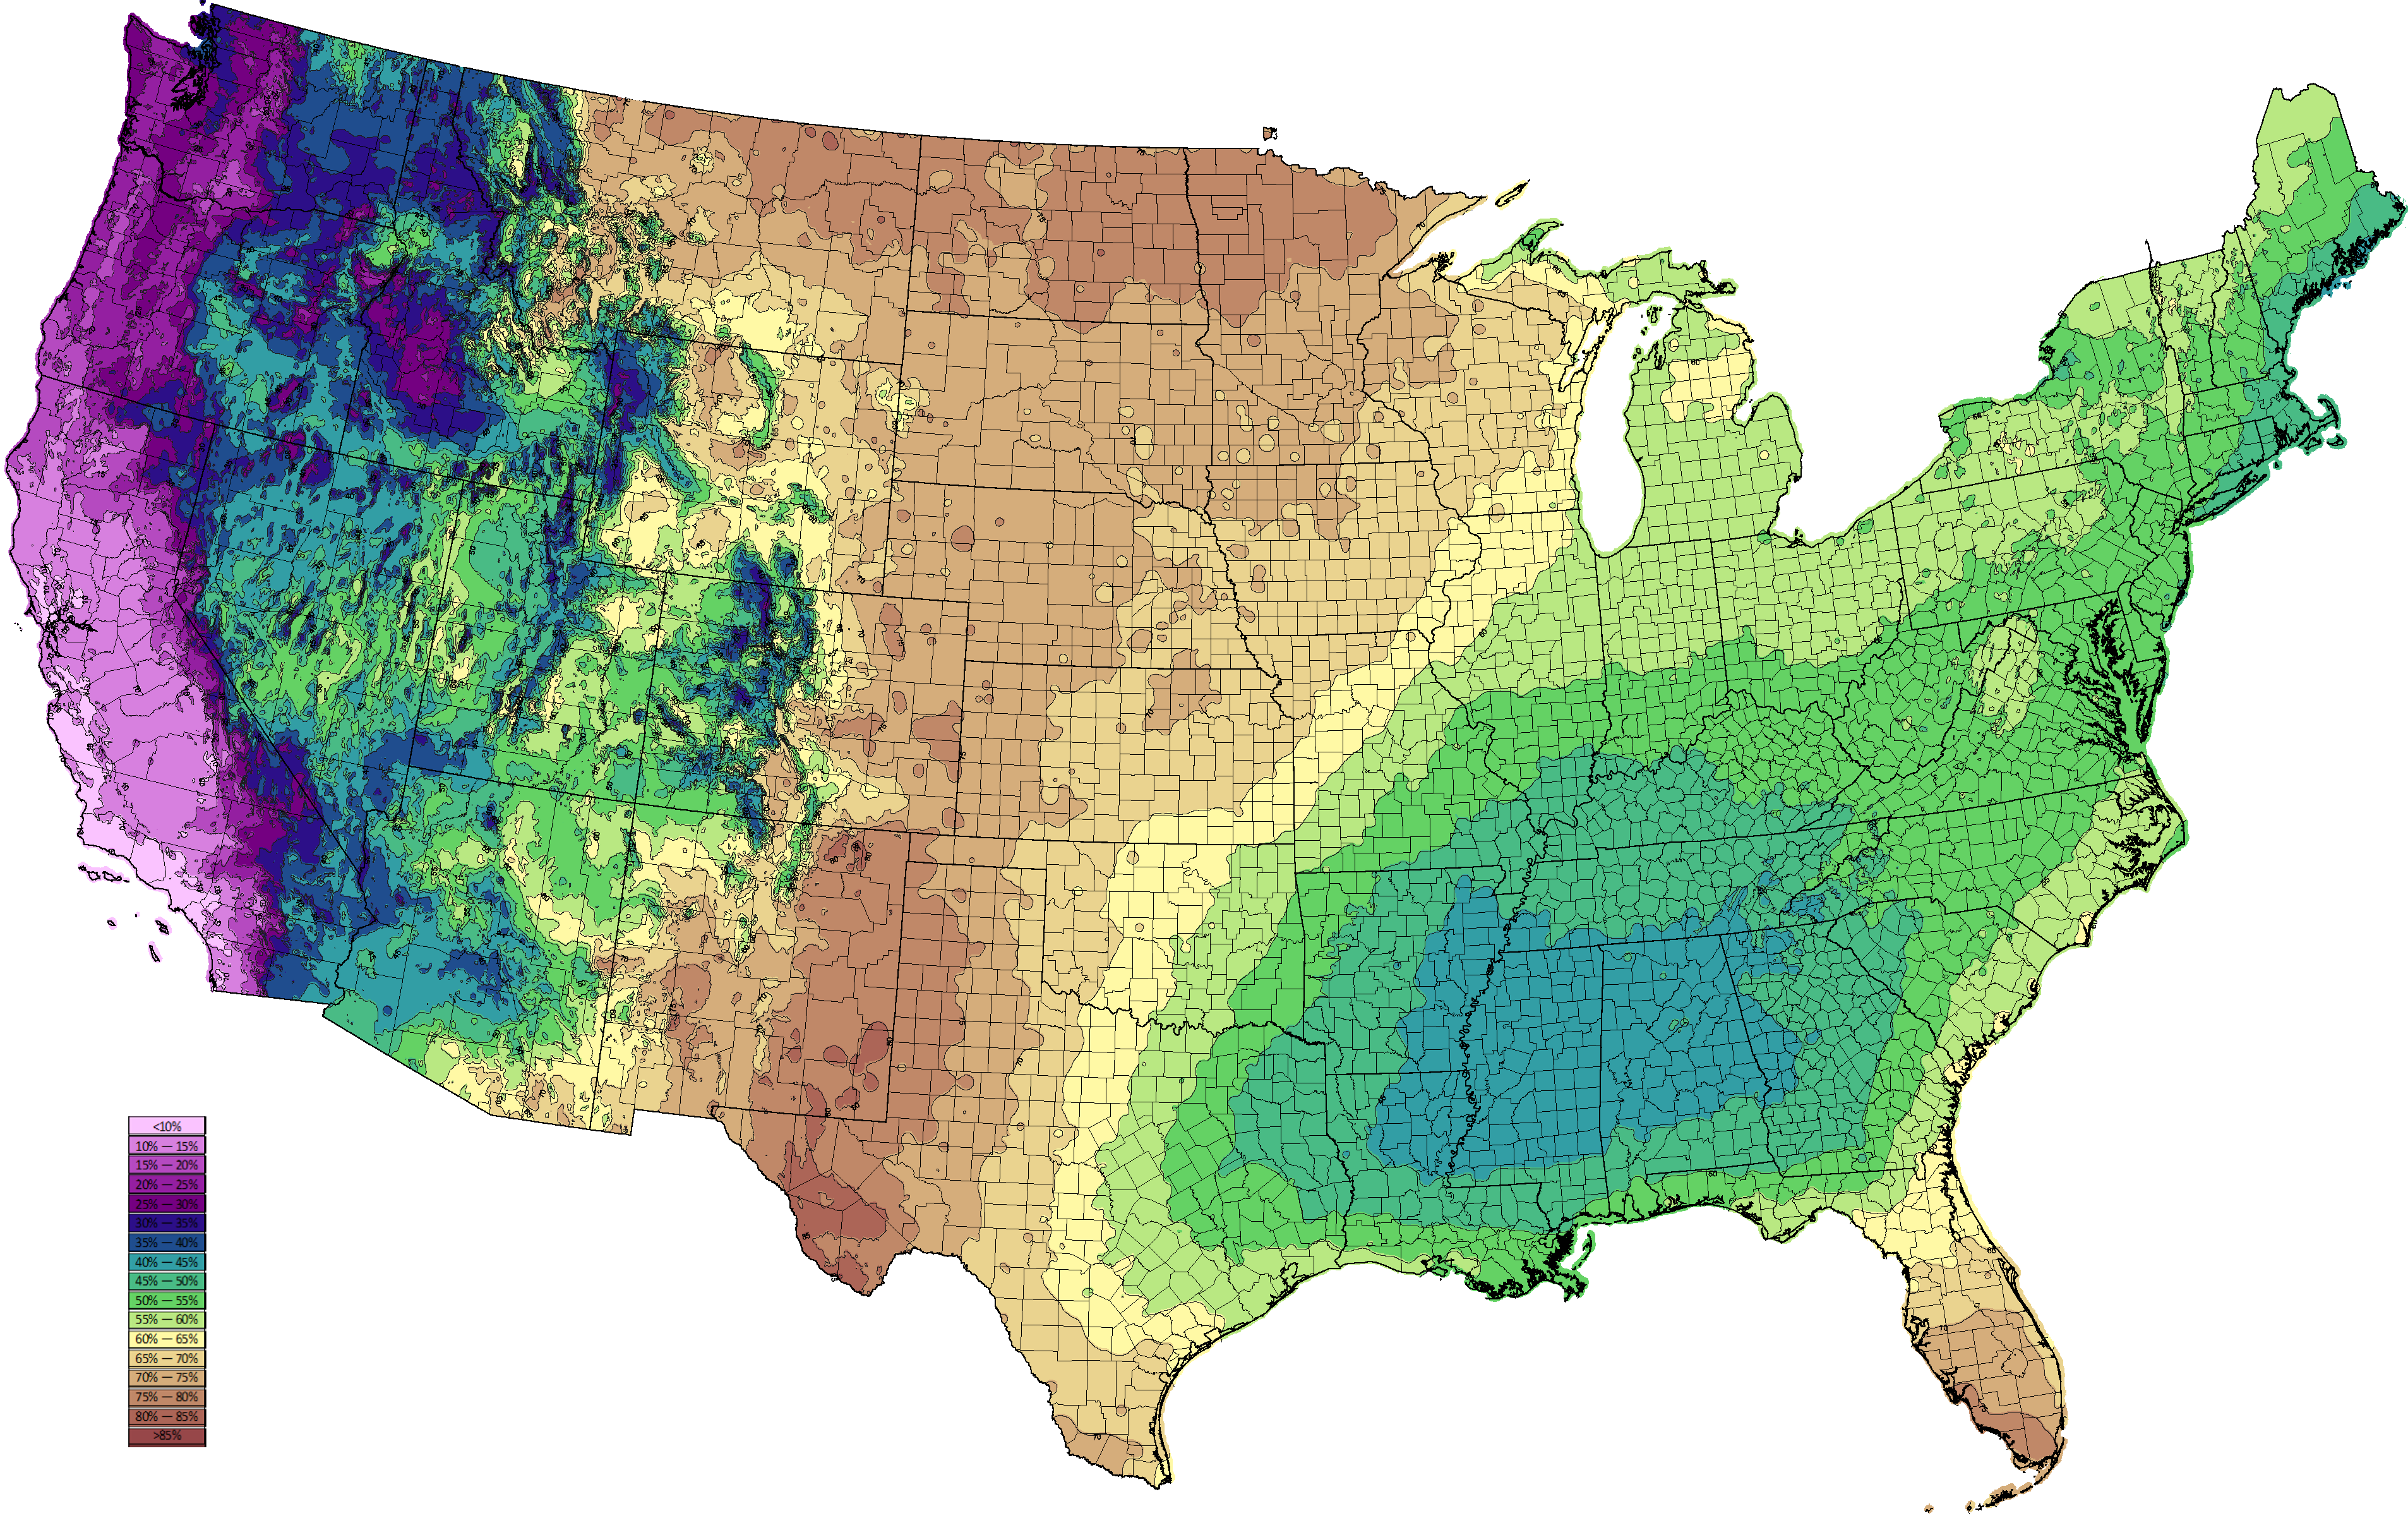
Percent of annual precipitation falling May-October, the warmest 6 months of the year (Data from PRISM, based on 1971-2000 climate normals) ©BONAP |
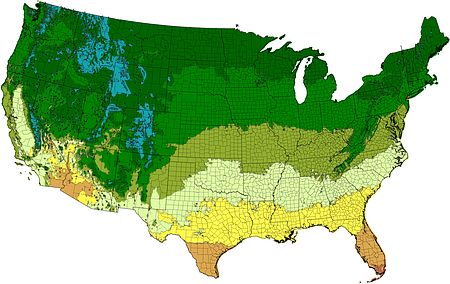
Warmth index (positive temperature averages for the warmest 6 months; i.e. May - October averaged, whereby monthly temperatures less than 0°C are assumed zero) ©BONAP
| 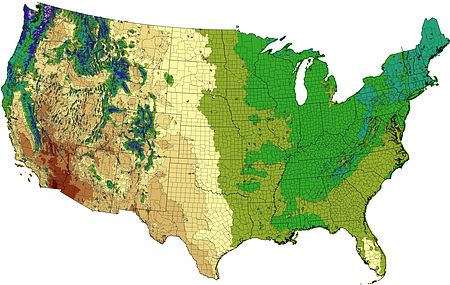
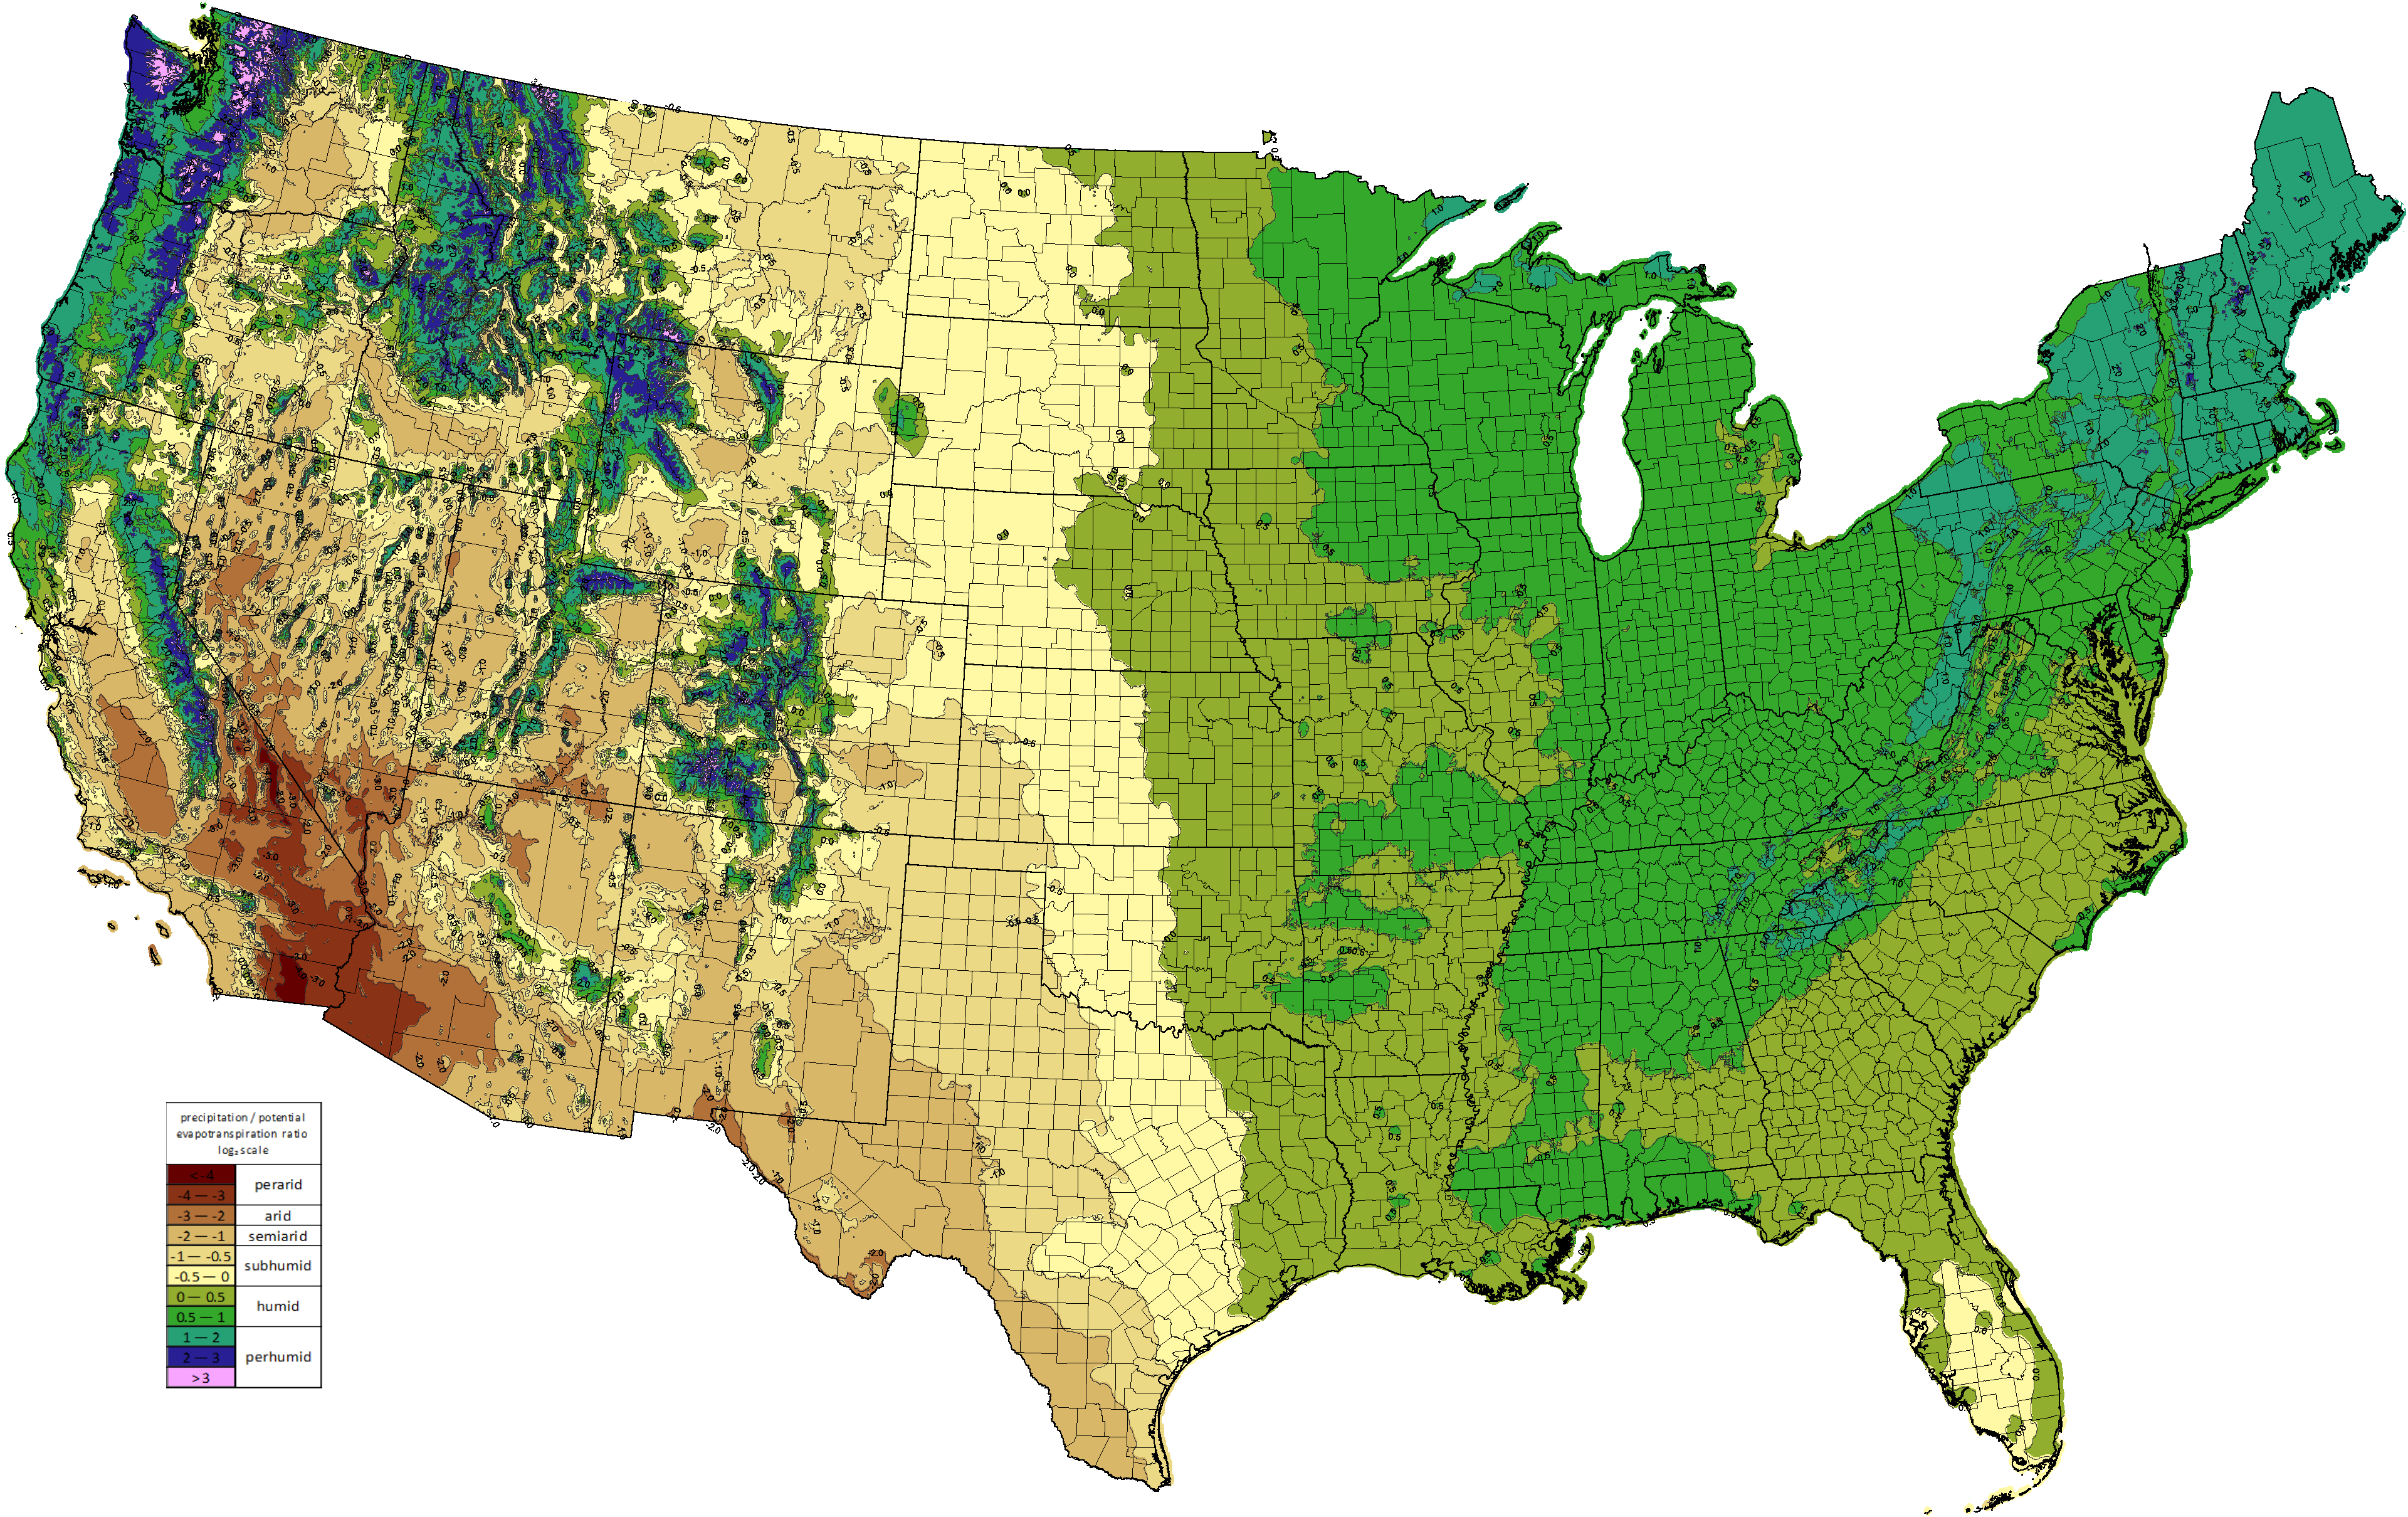
Moisture index (ratio of annual precipitation over annual evapotranspiration, where evapotranspiration is estimated by multiplying the annual positive temperature average, or Holdridge biotemperature, by58.93mm/°C) ©BONAP
| 
Holdridge biotemperature (annual positive temperature average with no maximum limit) ©BONAP |
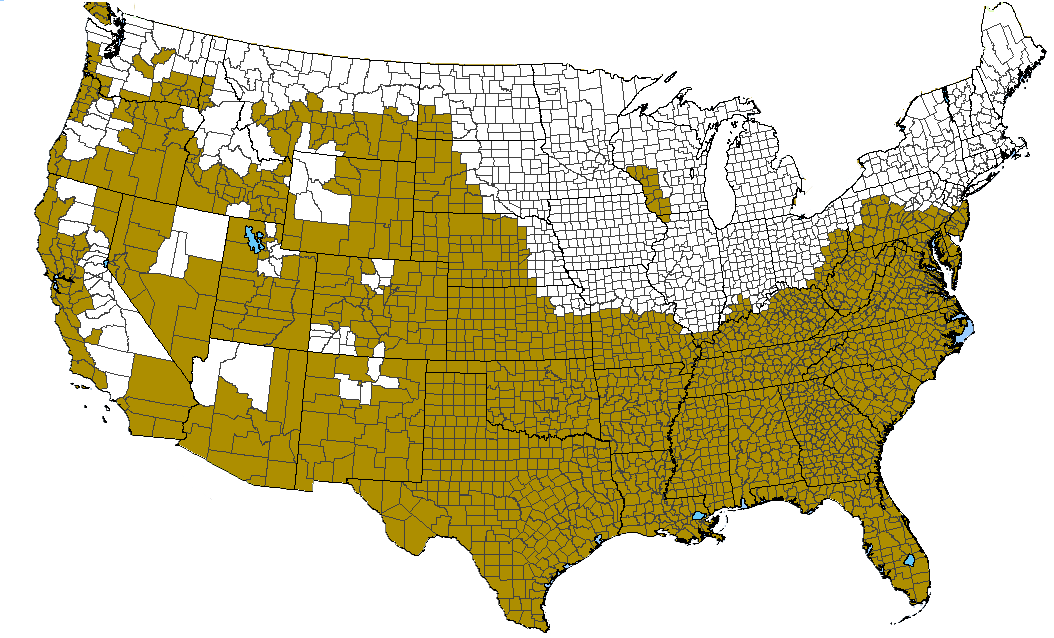
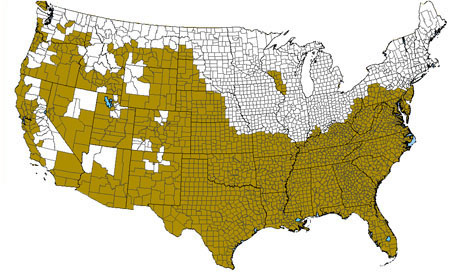 US County-level assessment of all glaciated areas ©BONAP | 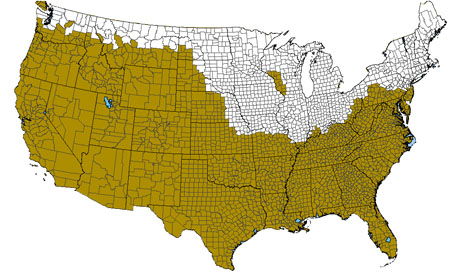
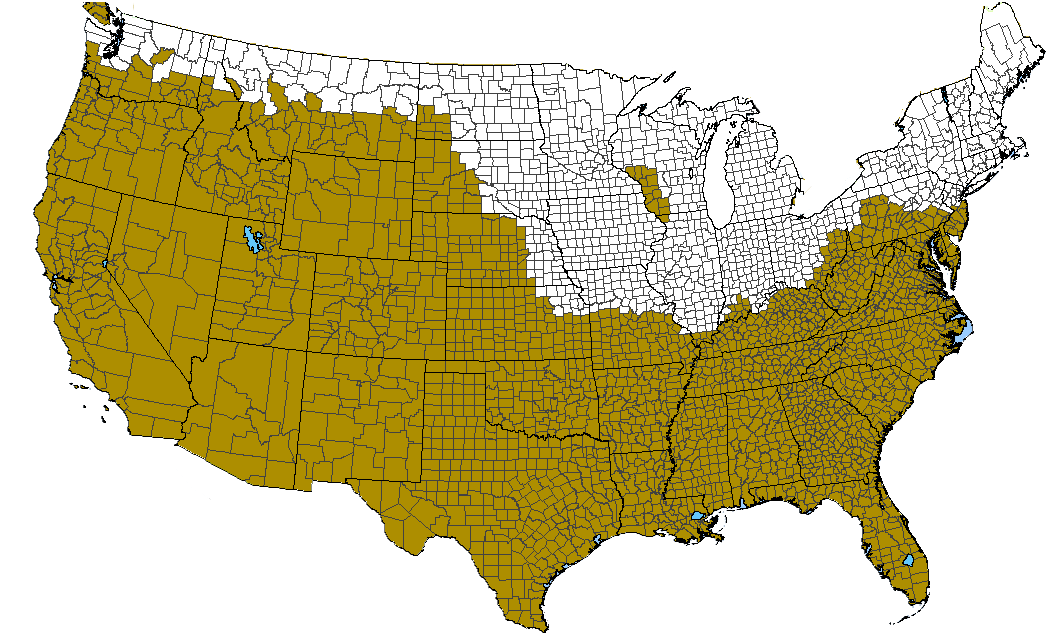
US County-level assessment of the maximum extent of glaciated areas ©BONAP | 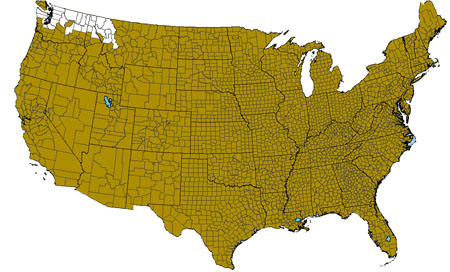 US county-level assessment of the Cordileran Ice Sheet ©BONAP |
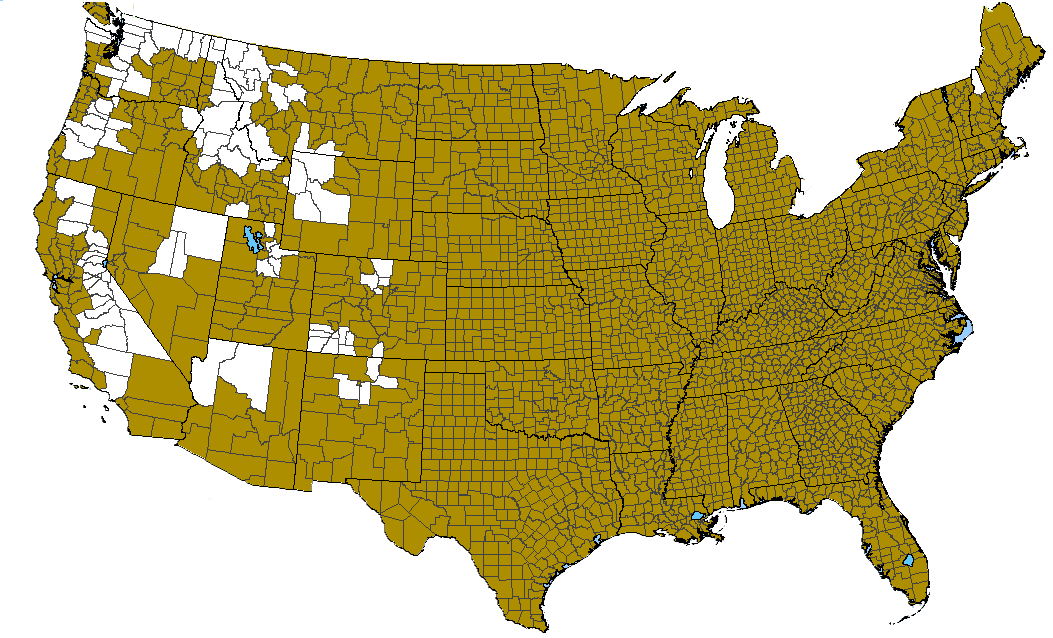
 US county-level assessment of mountain glaciers ©BONAP | 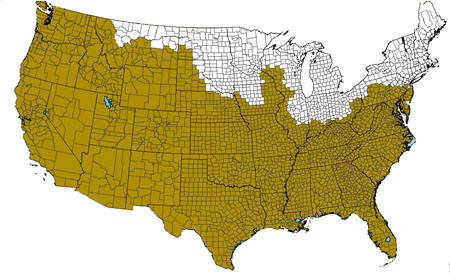
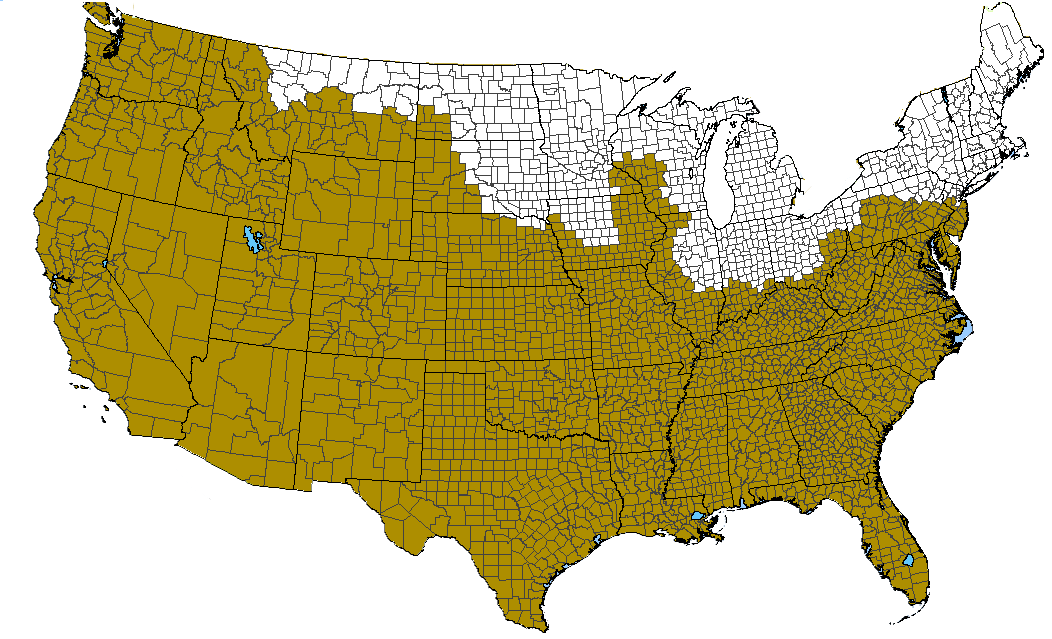
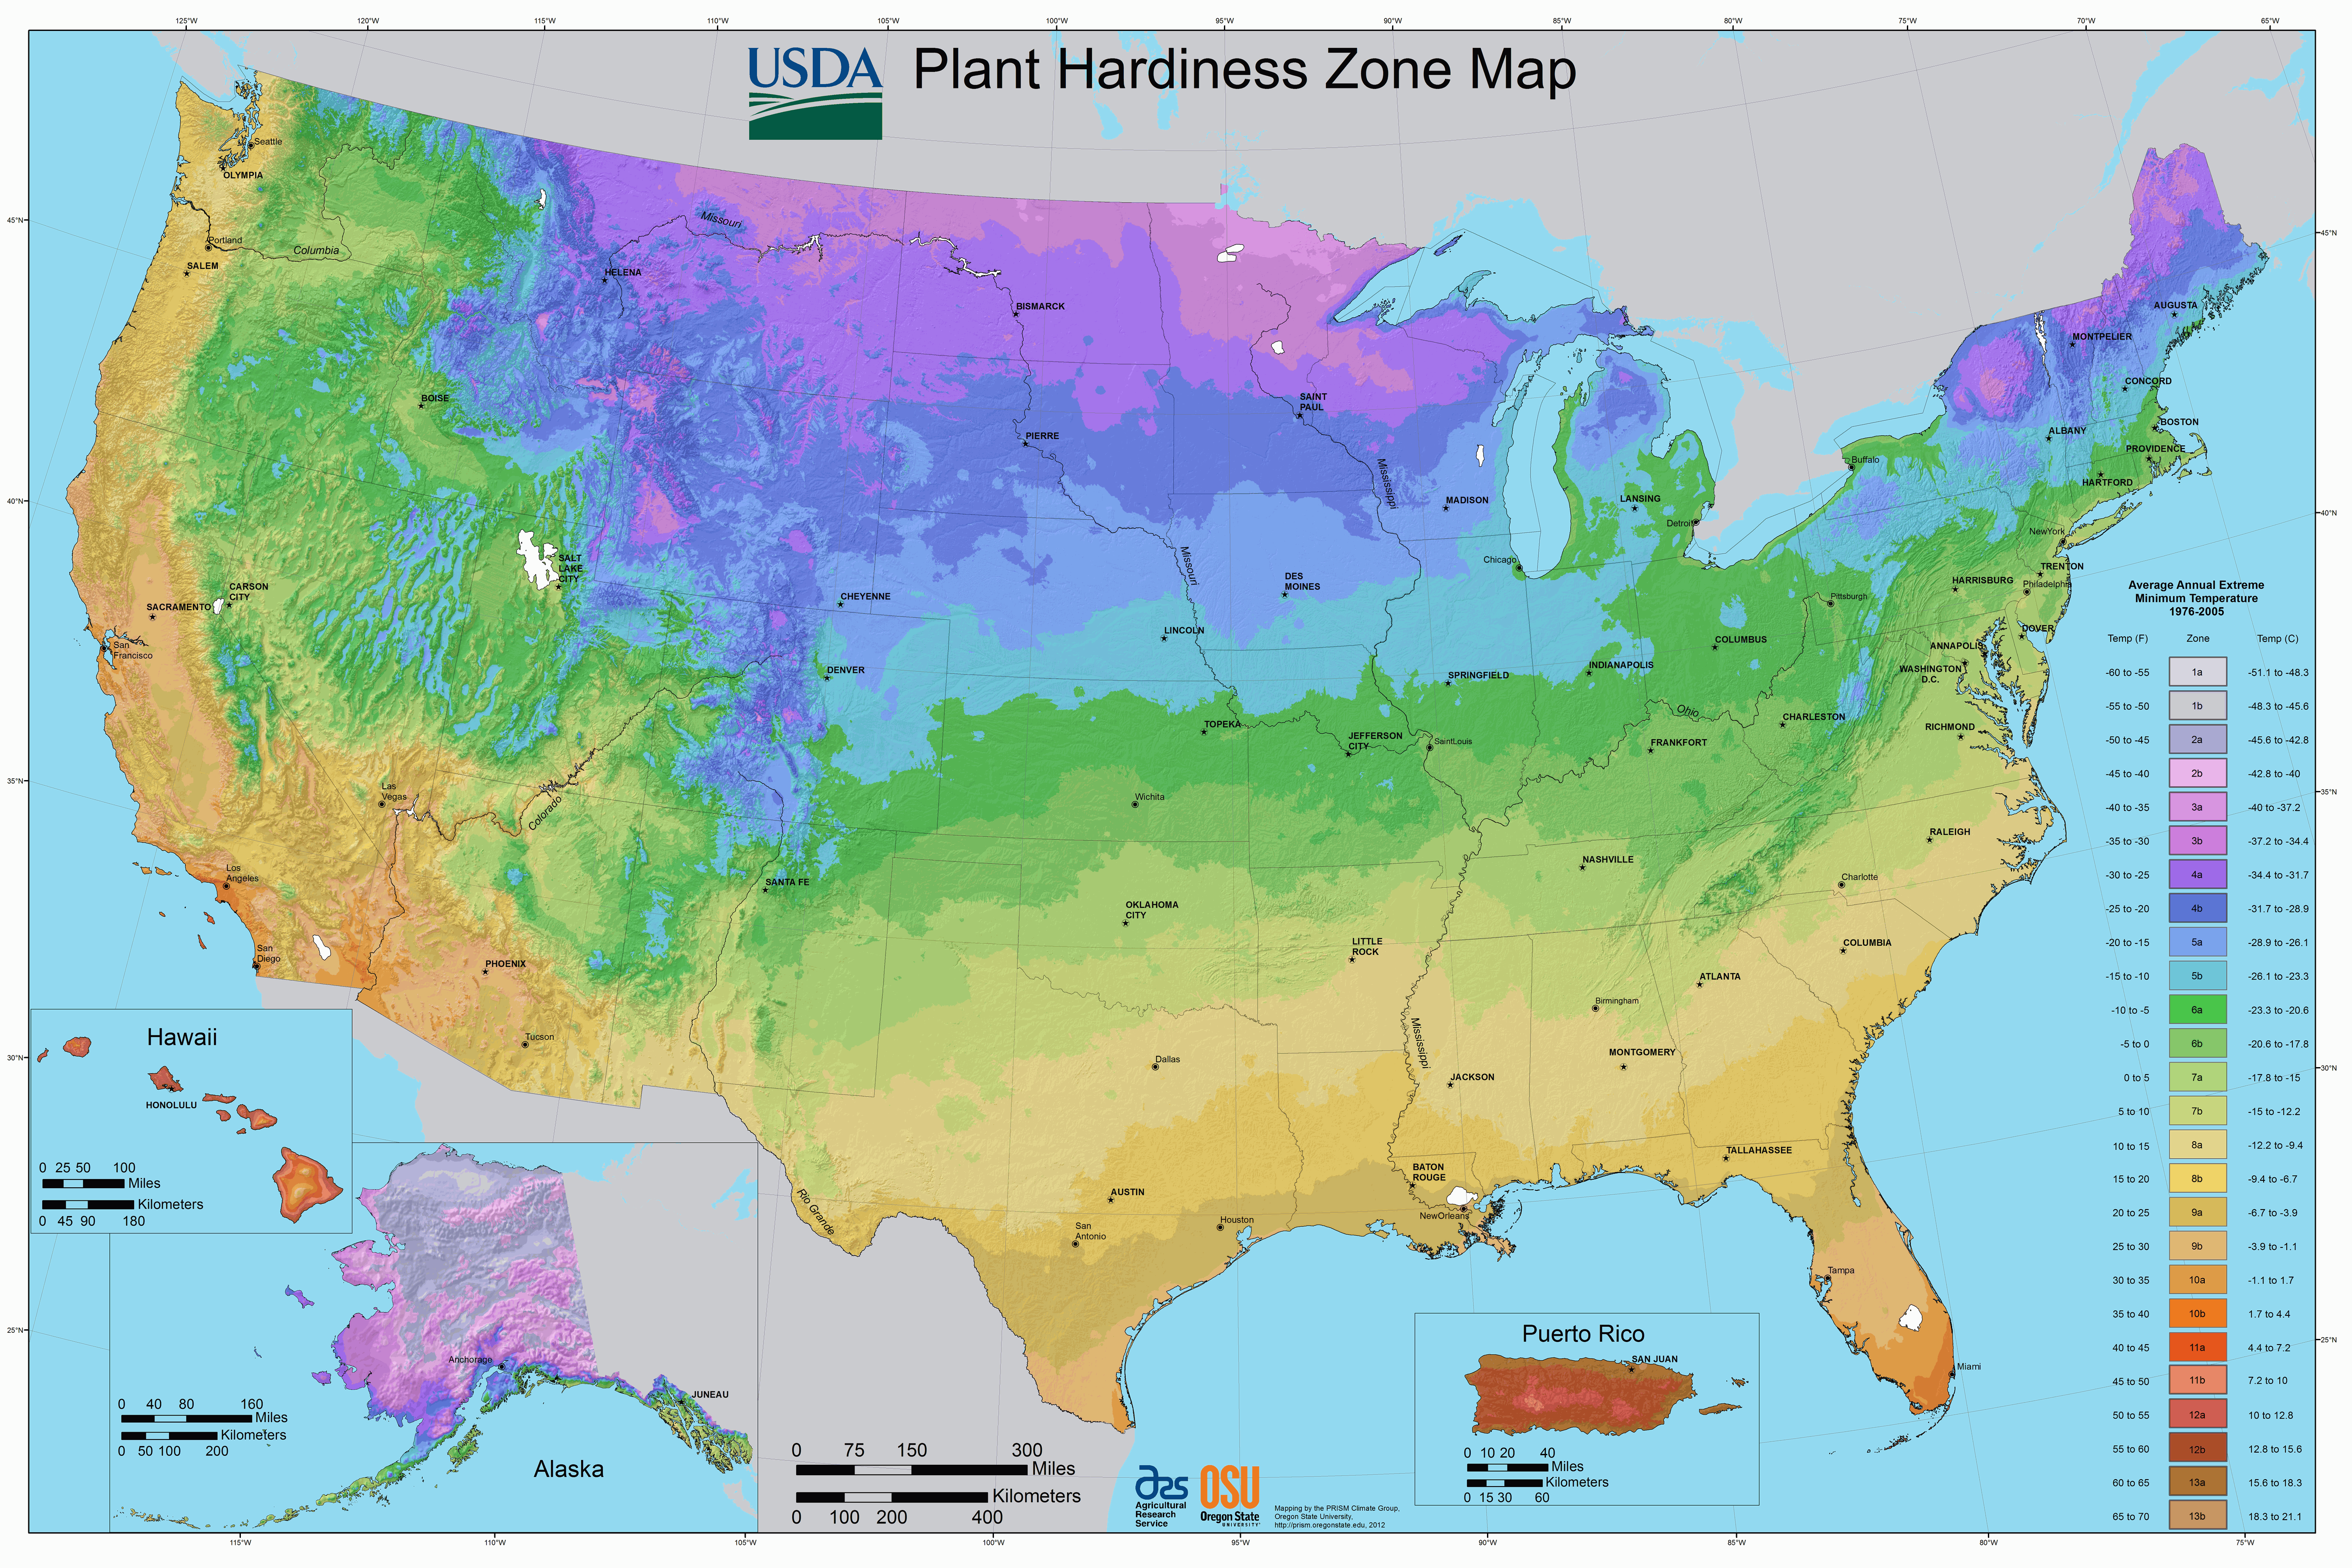
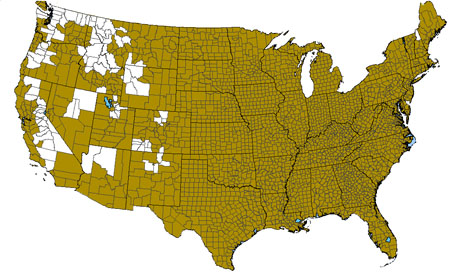
US county-level assessment of the Wisconsin Ice Sheet ©BONAP | 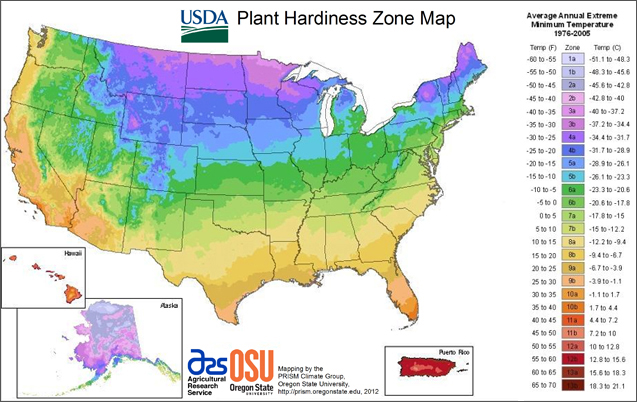 USDA Plant Hardiness Zones |
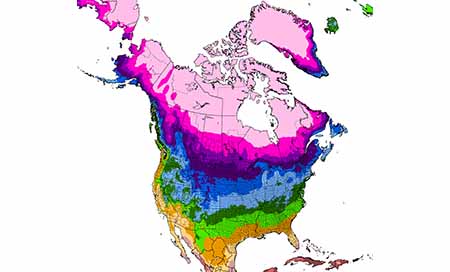
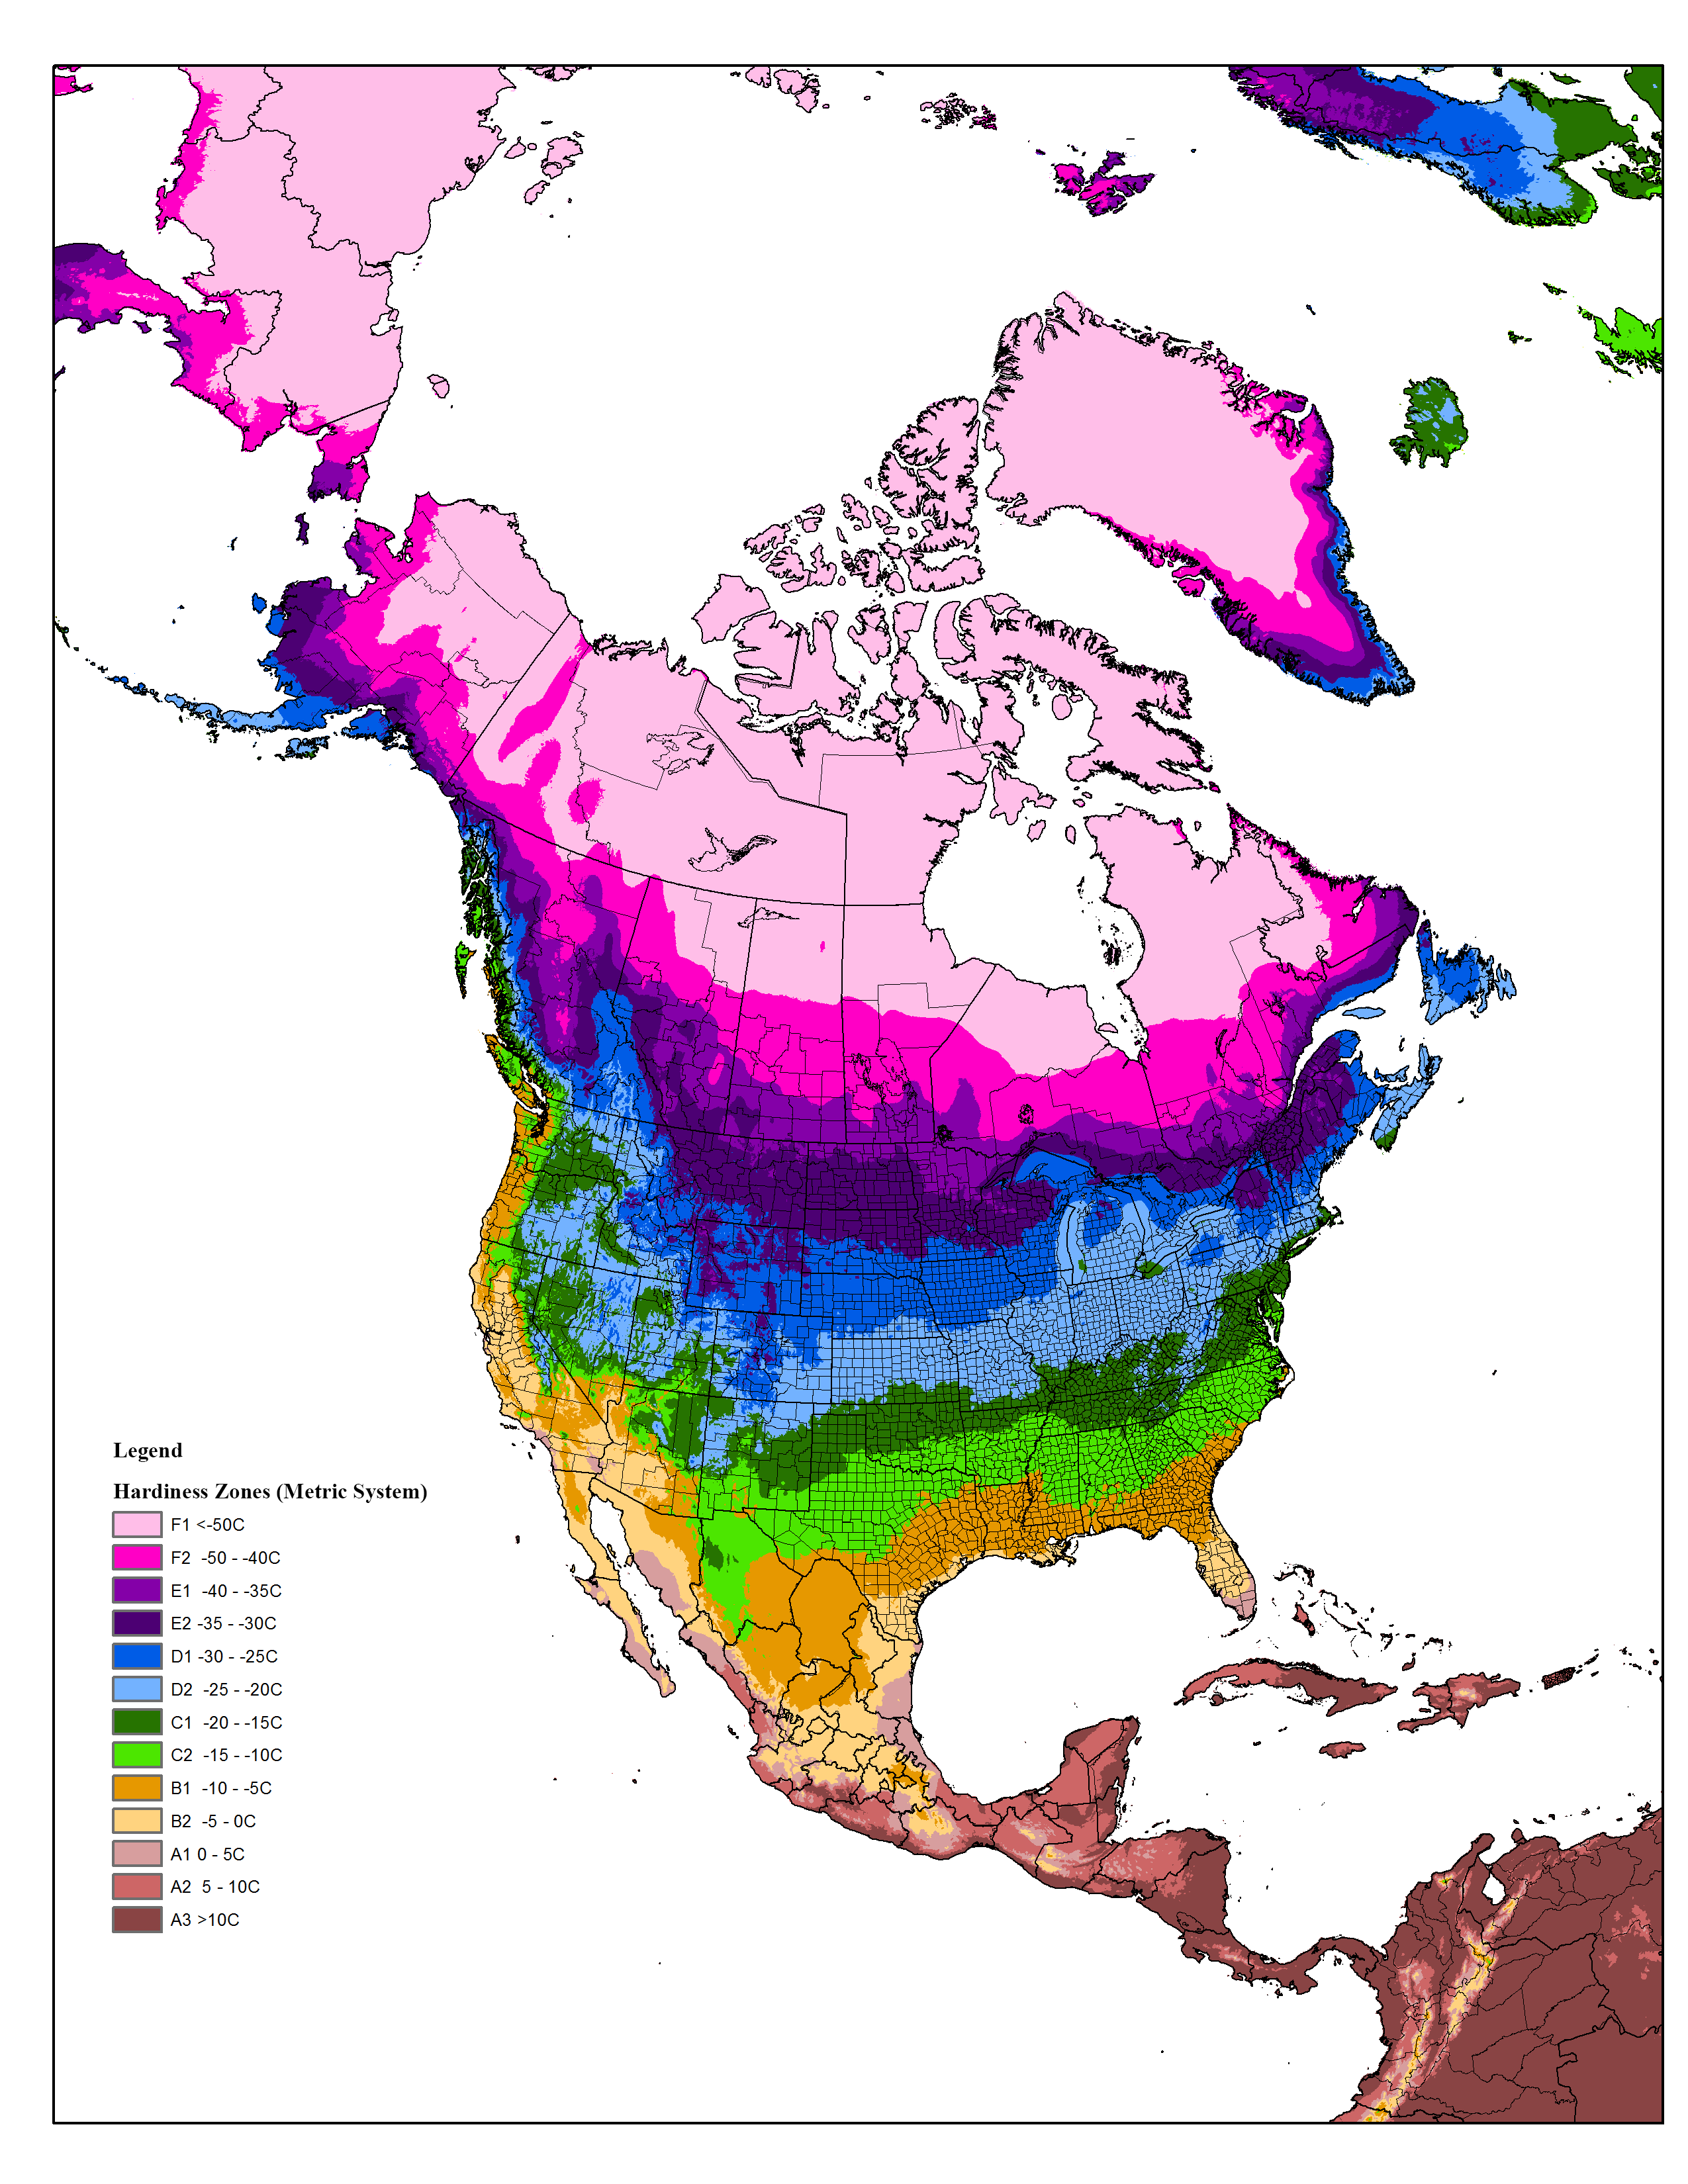
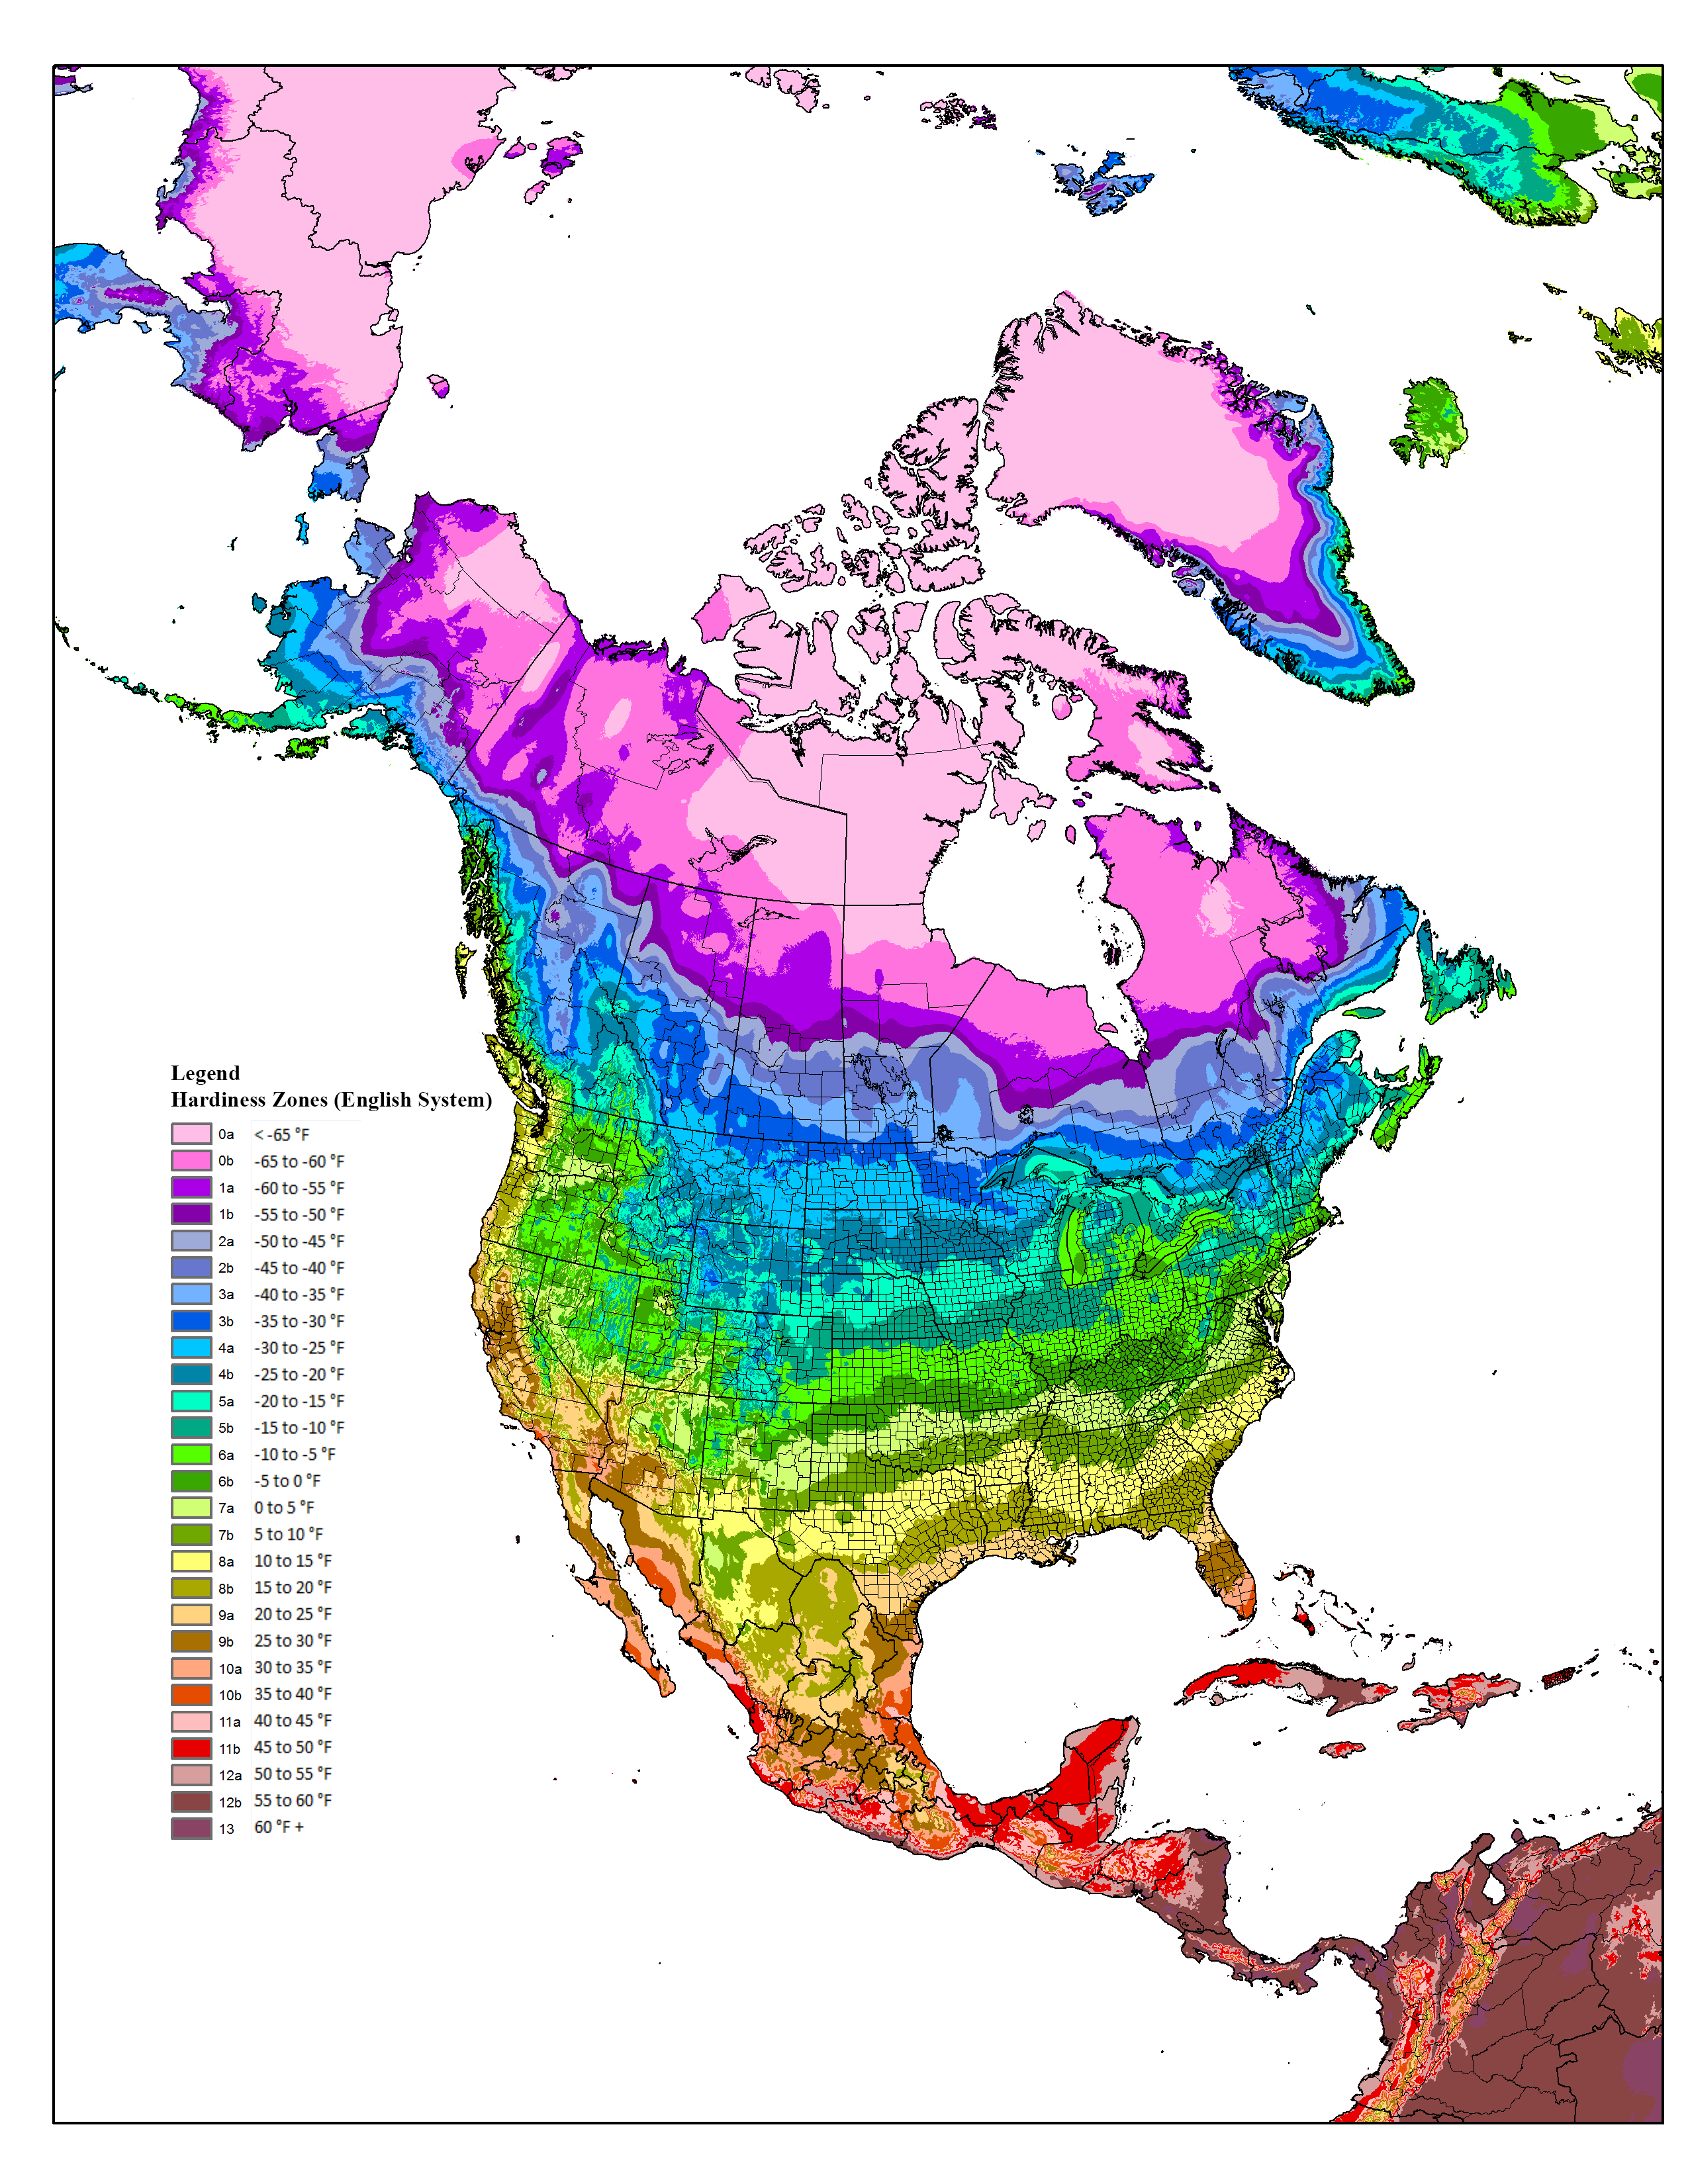
Hardiness Zones (Metric System) ©BONAP | 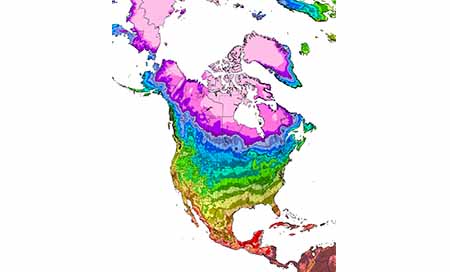 Hardiness Zones (English System) ©BONAP | |