
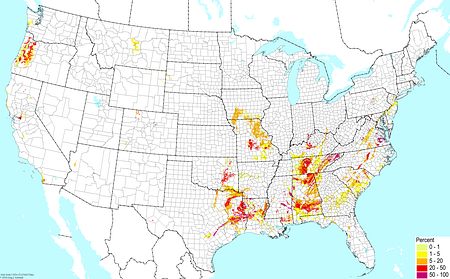
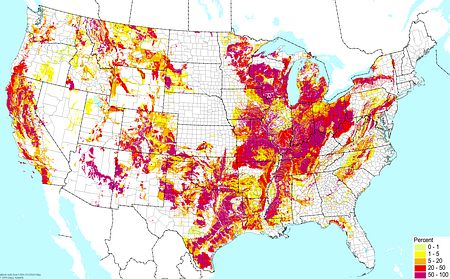
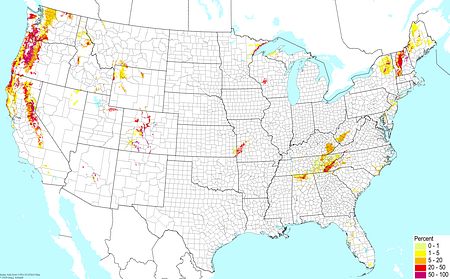
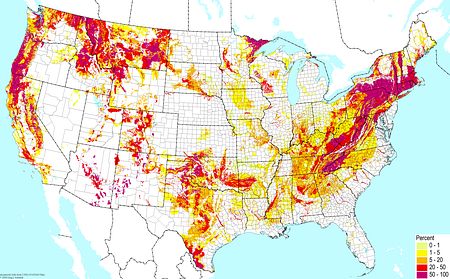
Density gradient of taxa for Carex within the US (data 2011). Darkest green (31 spp. Garfield County, UT) indicates the highest species concentration. ©BONAP | 
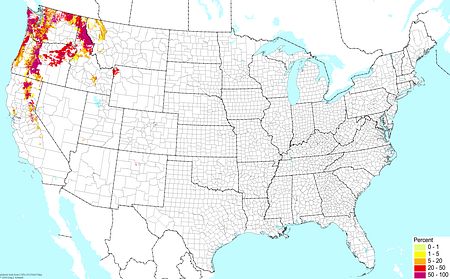
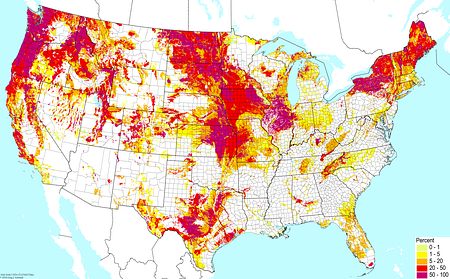
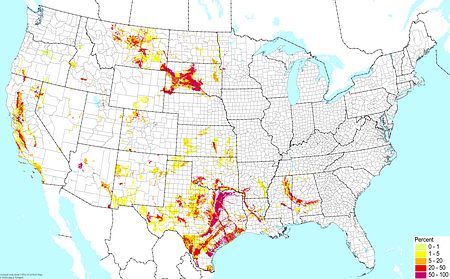
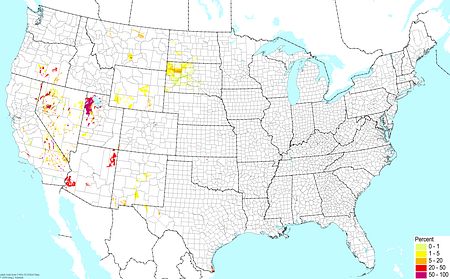
Density gradient of taxa for Astragalus within the US (data 2011). Darkest green (31 spp. Garfield County, UT) indicates the highest species concentration. ©BONAP | 
Density gradient of taxa for Penstemon within the US (data 2011). Darkest green (31 spp. Garfield County, UT) indicates the highest species concentration. ©BONAP |
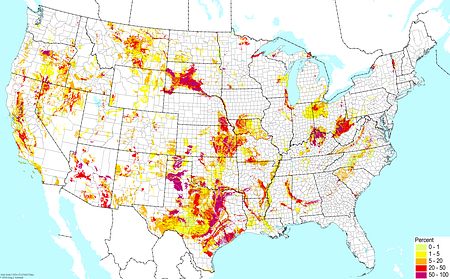
 Density gradient of taxa for Eriogonum within the US (data 2011). Darkest green (55 spp. Inyo County, CA) indicates the highest species concentration. ©BONAP | 
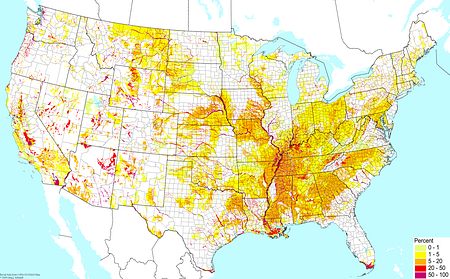
Density gradient of taxa for Rubus within the US (data 2011). Darkest green (43 spp. Preston County, WV) indicates the highest species concentration. ©BONAP | 
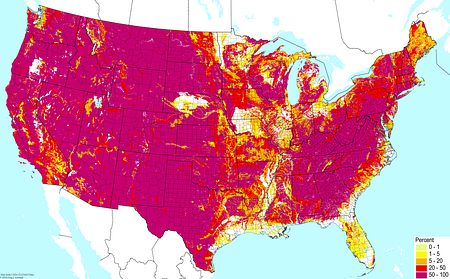
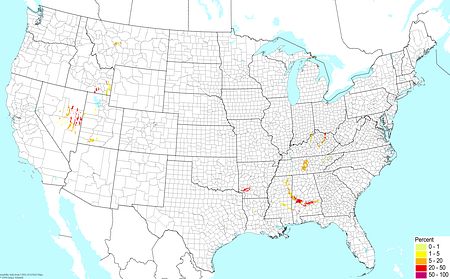
Density gradient of taxa for Quercus within the US (data 2011). Darkest green (26 spp. Berkeley County, SC; Tuscaloosa County AL) indicates the highest species concentration. ©BONAP |

Density gradient of taxa for Erigeron within the US (data 2011). Darkest green (34 spp. Gunnison County, CO) indicates the highest species concentration. ©BONAP |  Density gradient of taxa for Phacelia within the US (data 2011). Darkest green (43 spp. Inyo County, CA) indicates the highest species concentration. ©BONAP |  Density gradient of taxa for Cratageus within the US (data 2011). Darkest green (24 spp. Kent County, MI; St. Clair County, MI) indicates the highest species concentration. ©BONAP |

Density gradient of taxa for Lupinus within the US (data 2011). Darkest green (39 spp. Inyo County, CA) indicates the highest species concentration. ©BONAP |  Density gradient of taxa for Salix within the US (data 2011). Darkest green (39 spp. Inyo County, CA) indicates the highest species concentration. ©BONAP |  Density gradient of taxa for Cryptantha within the US (data 2011). Darkest green (39 spp. Inyo County, CA) indicates the highest species concentration. ©BONAP |
 Density gradient of taxa for Castilleja within the US (data 2011). Darkest green (39 spp. Inyo County, CA) indicates the highest species concentration. ©BONAP |  Density gradient of taxa for Draba within the US (data 2011). Darkest green (39 spp. Inyo County, CA) indicates the highest species concentration. ©BONAP | 
Density gradient of taxa for Juncus within the US (data 2011). Darkest green (39 spp. Inyo County, CA) indicates the highest species concentration. ©BONAP |
|
|
|
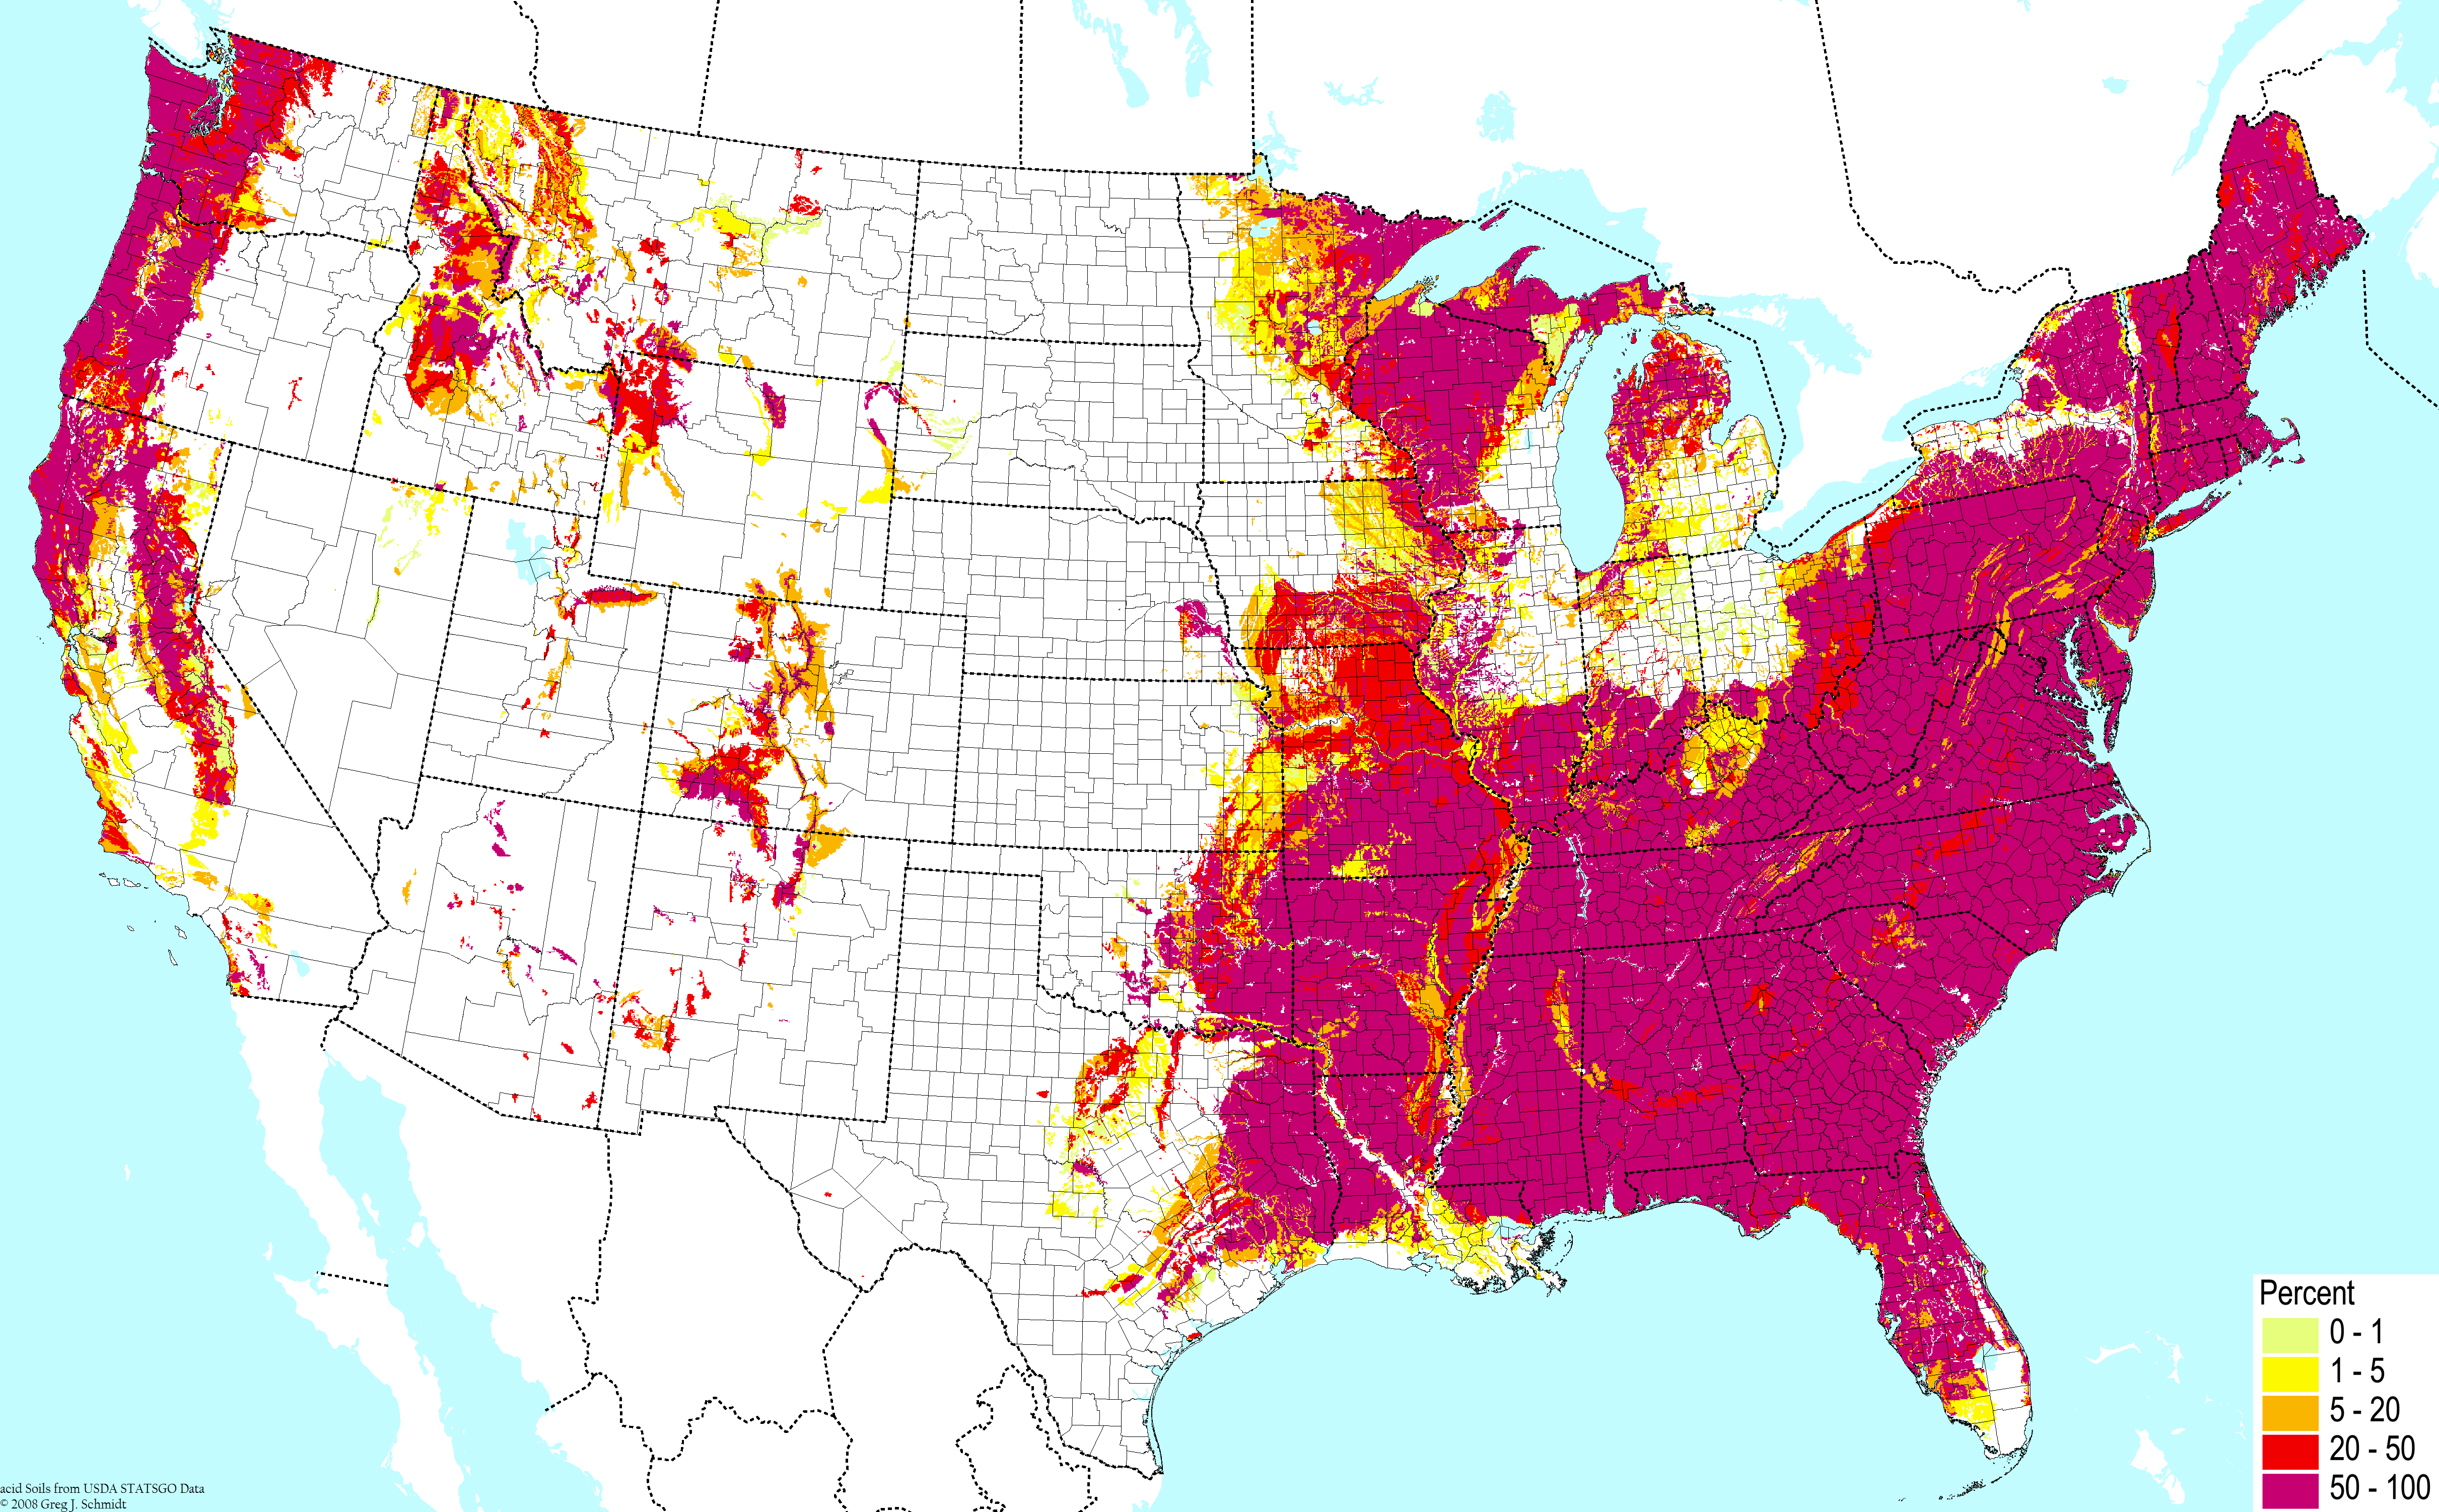
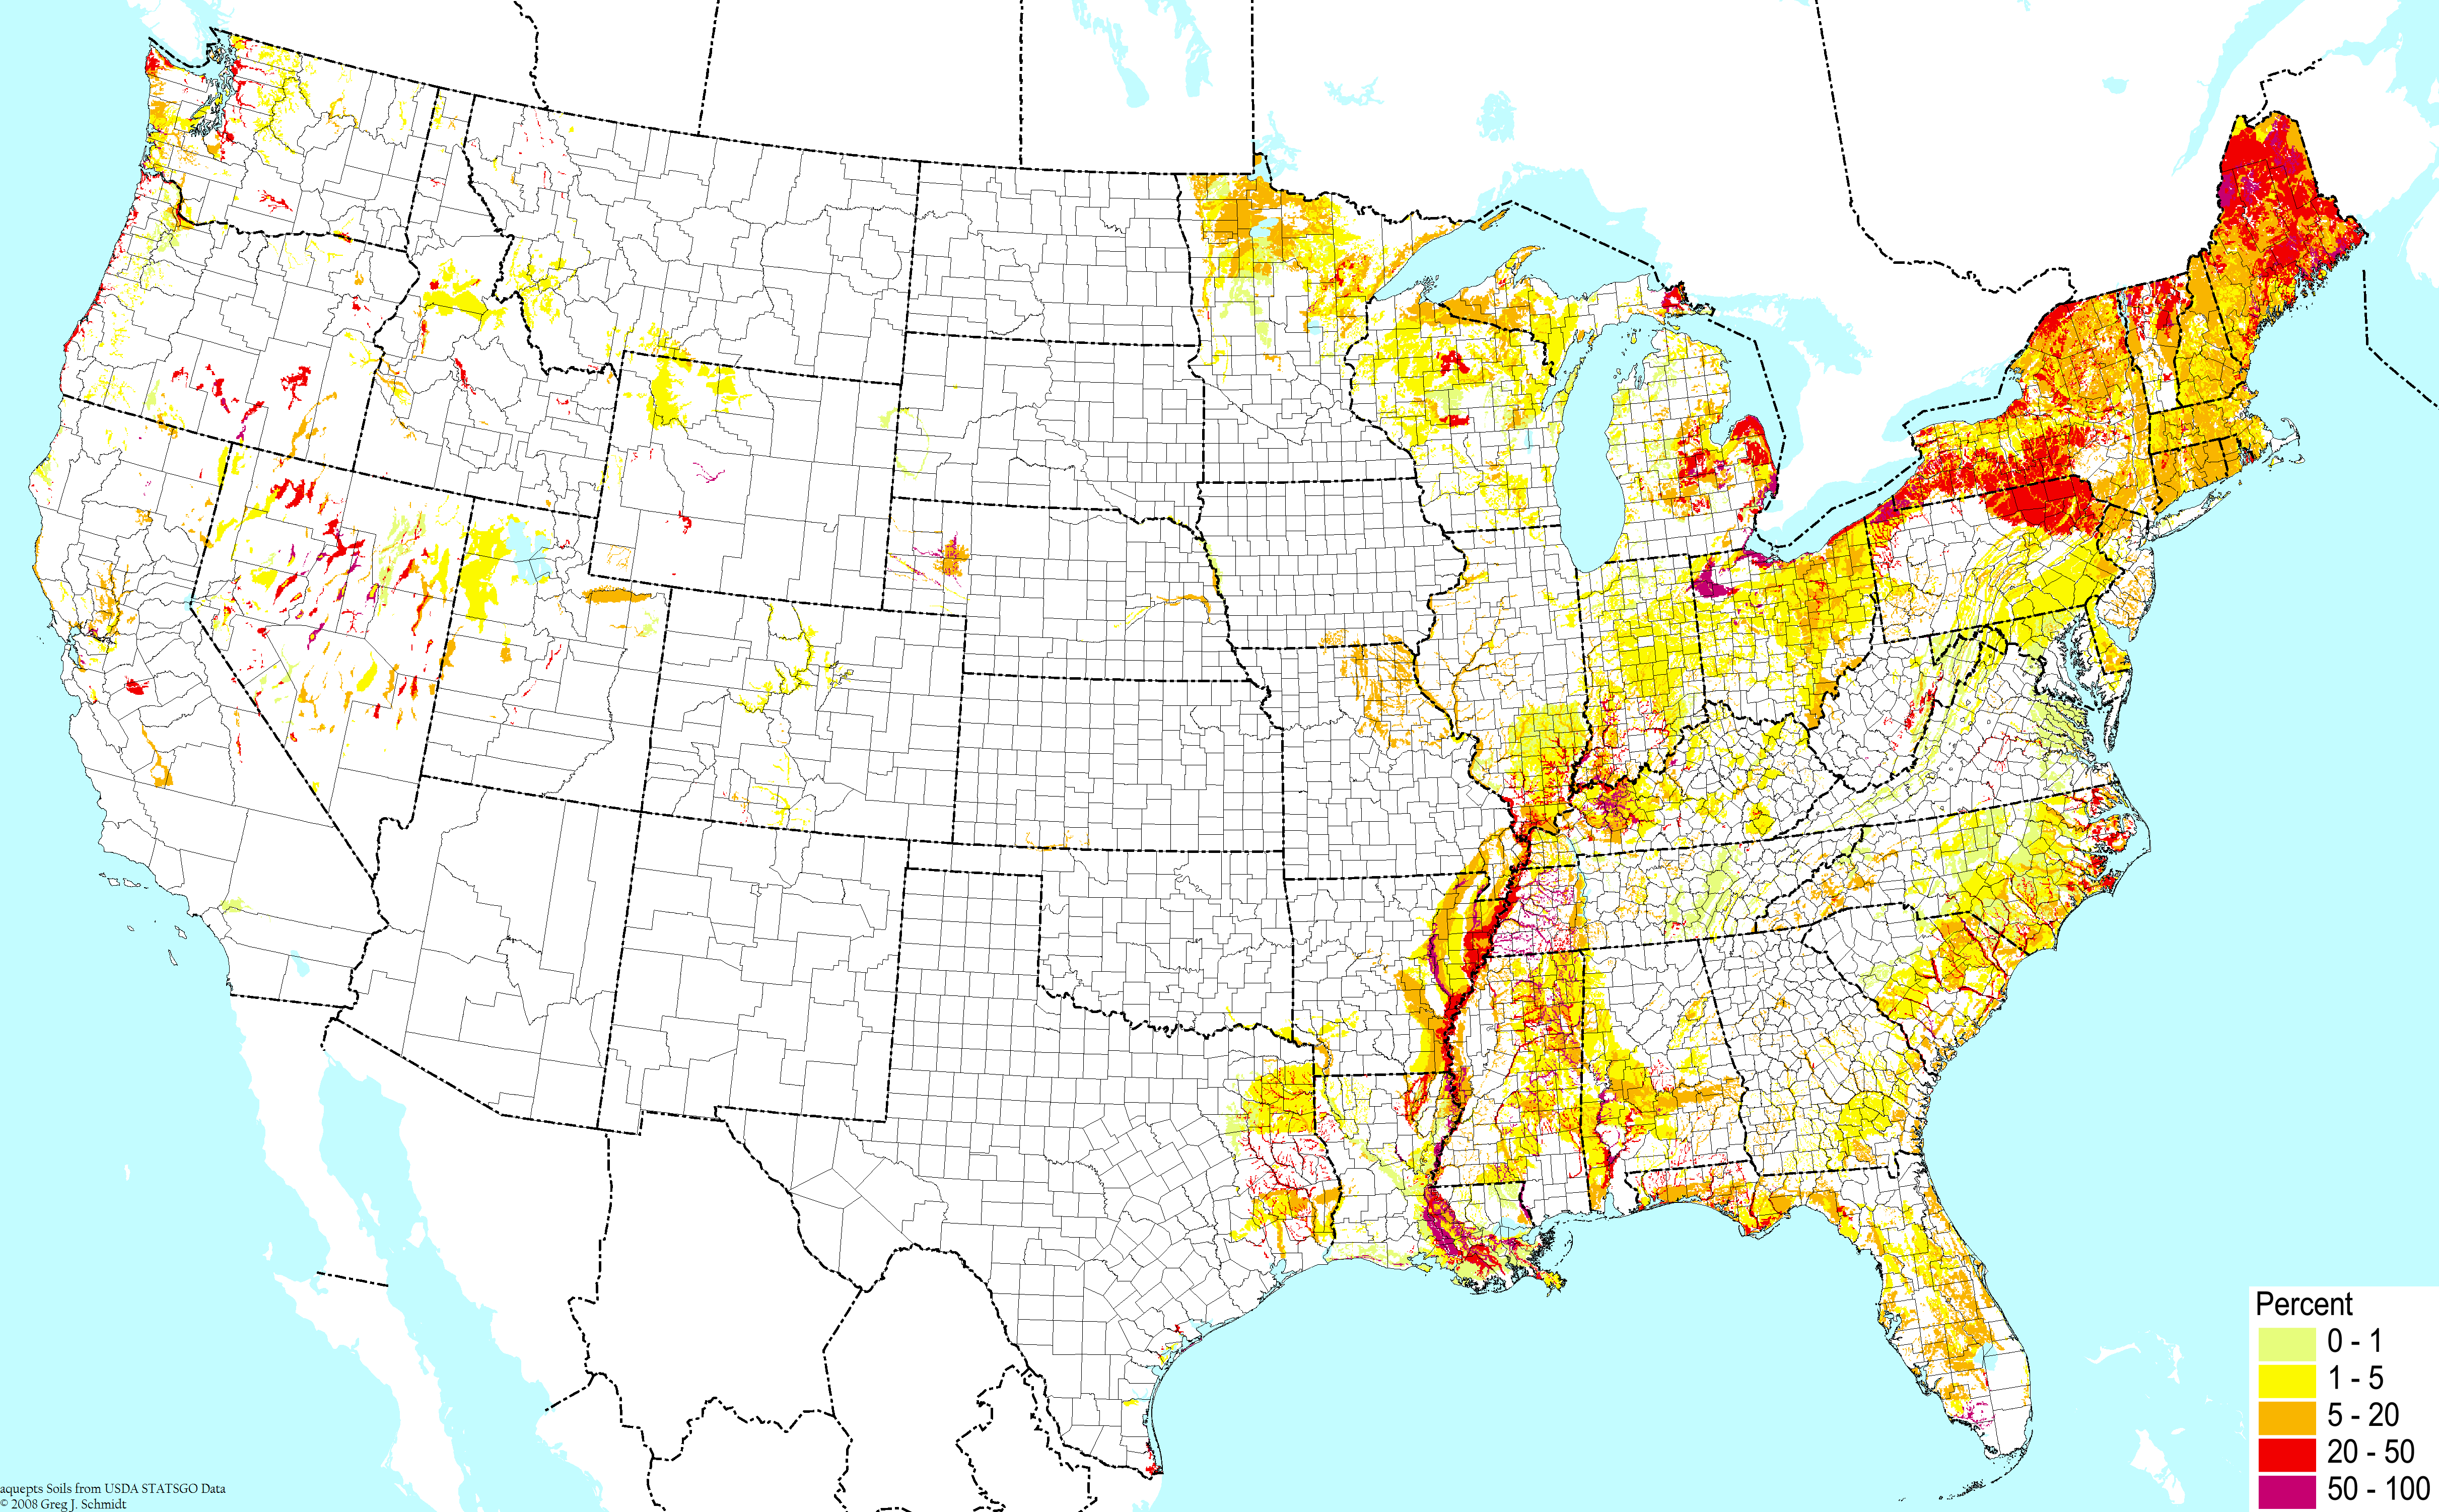
Upland acidic clays ©BONAP | 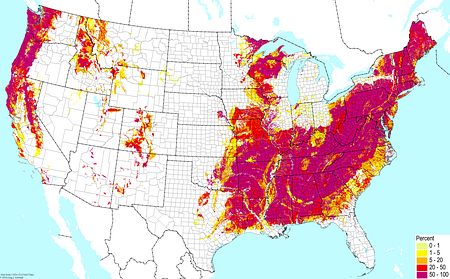
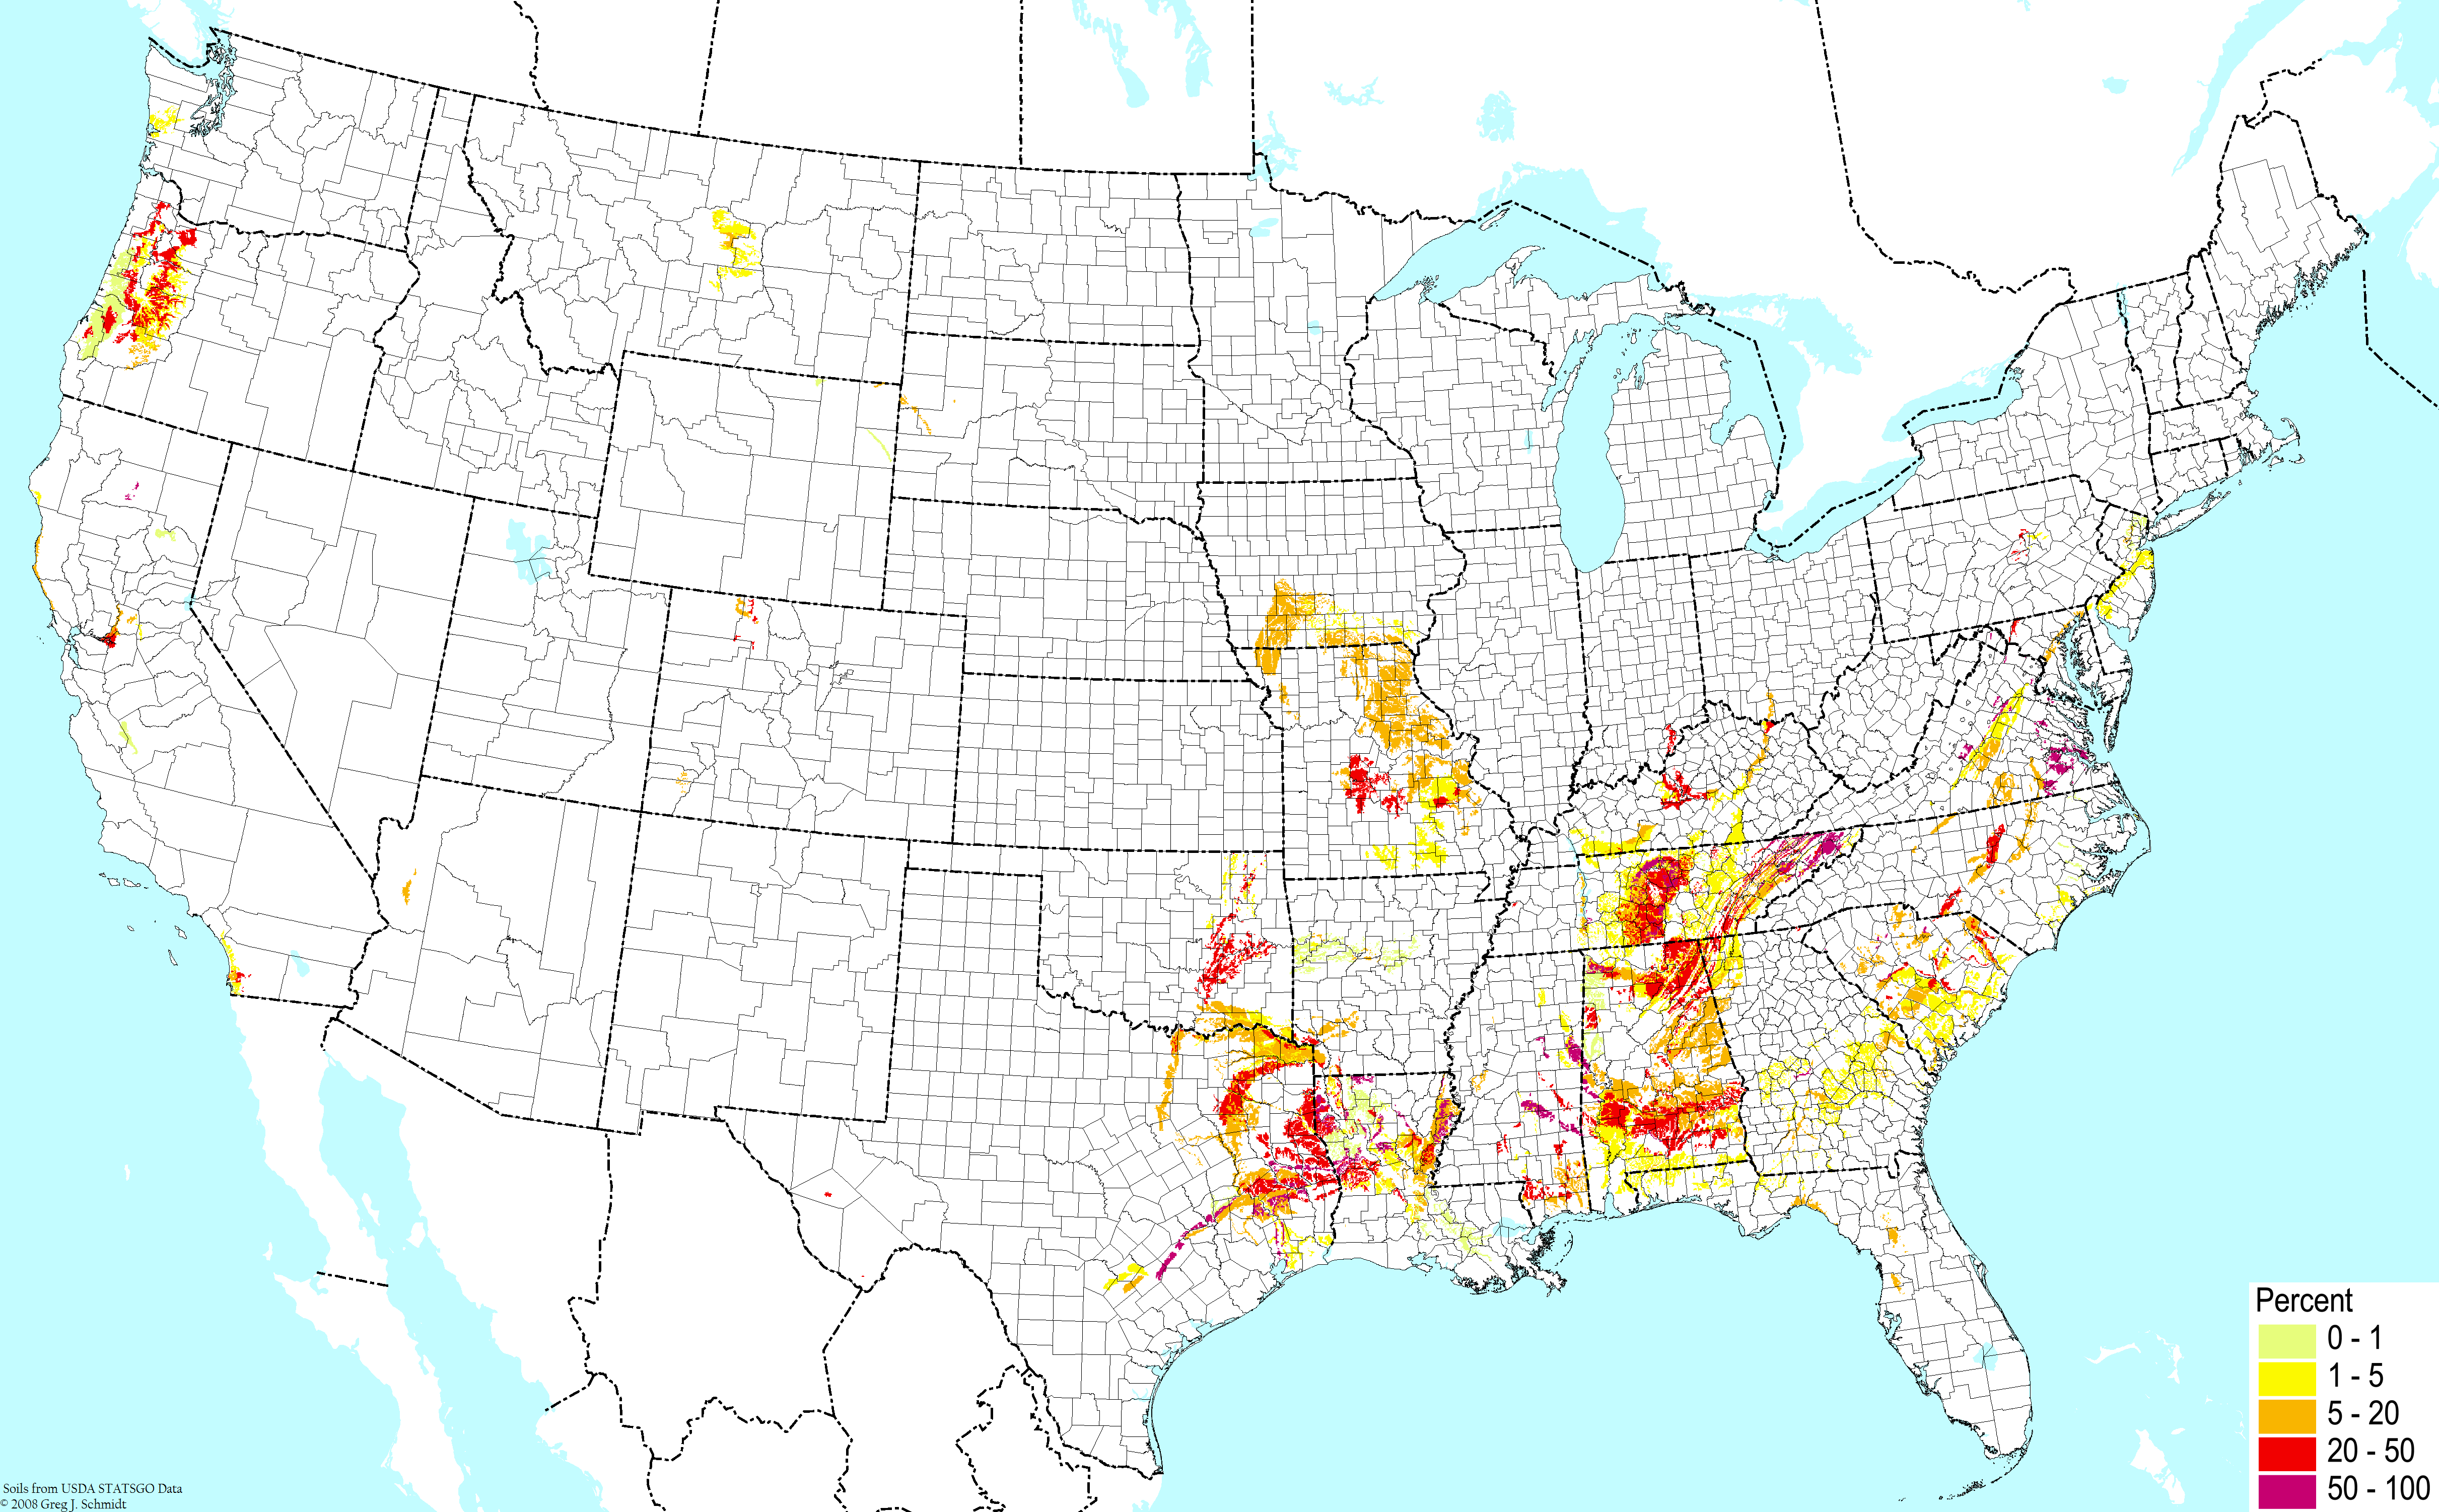
Upland acidic silts/loams ©BONAP | 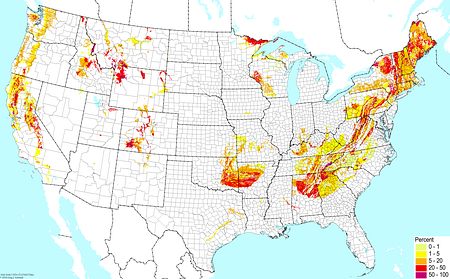
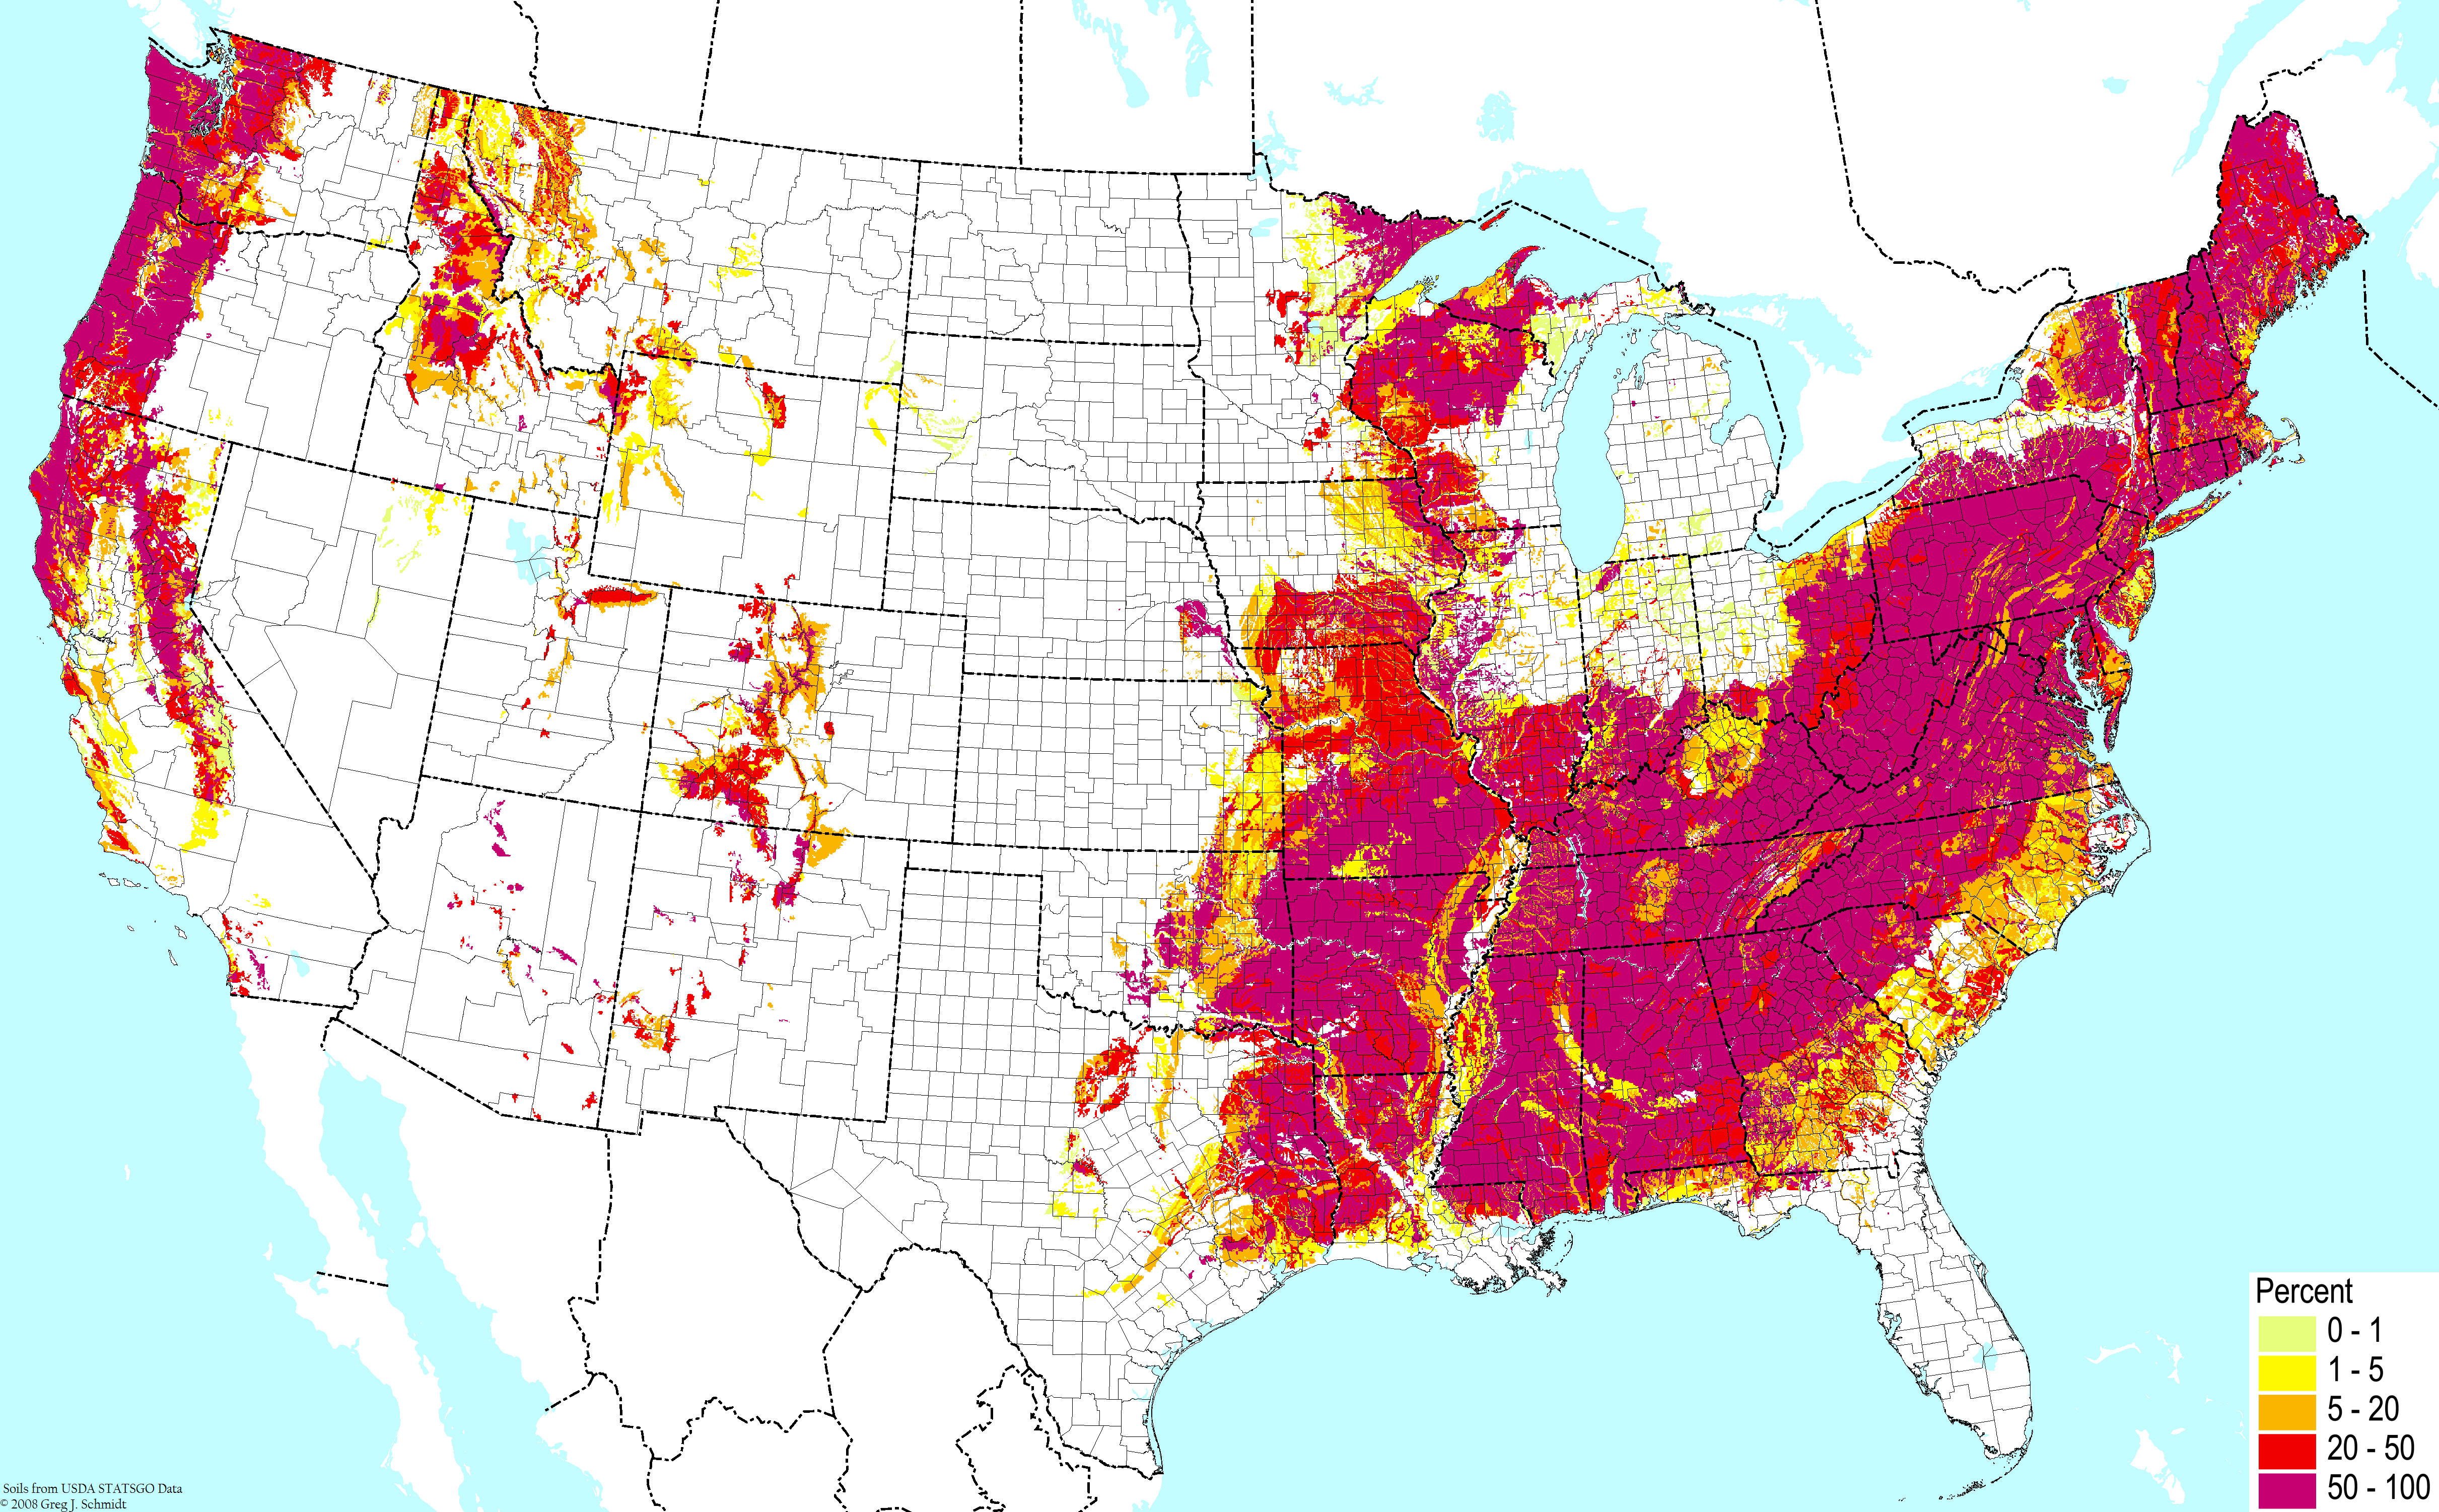
Upland acidic shallow ©BONAP |
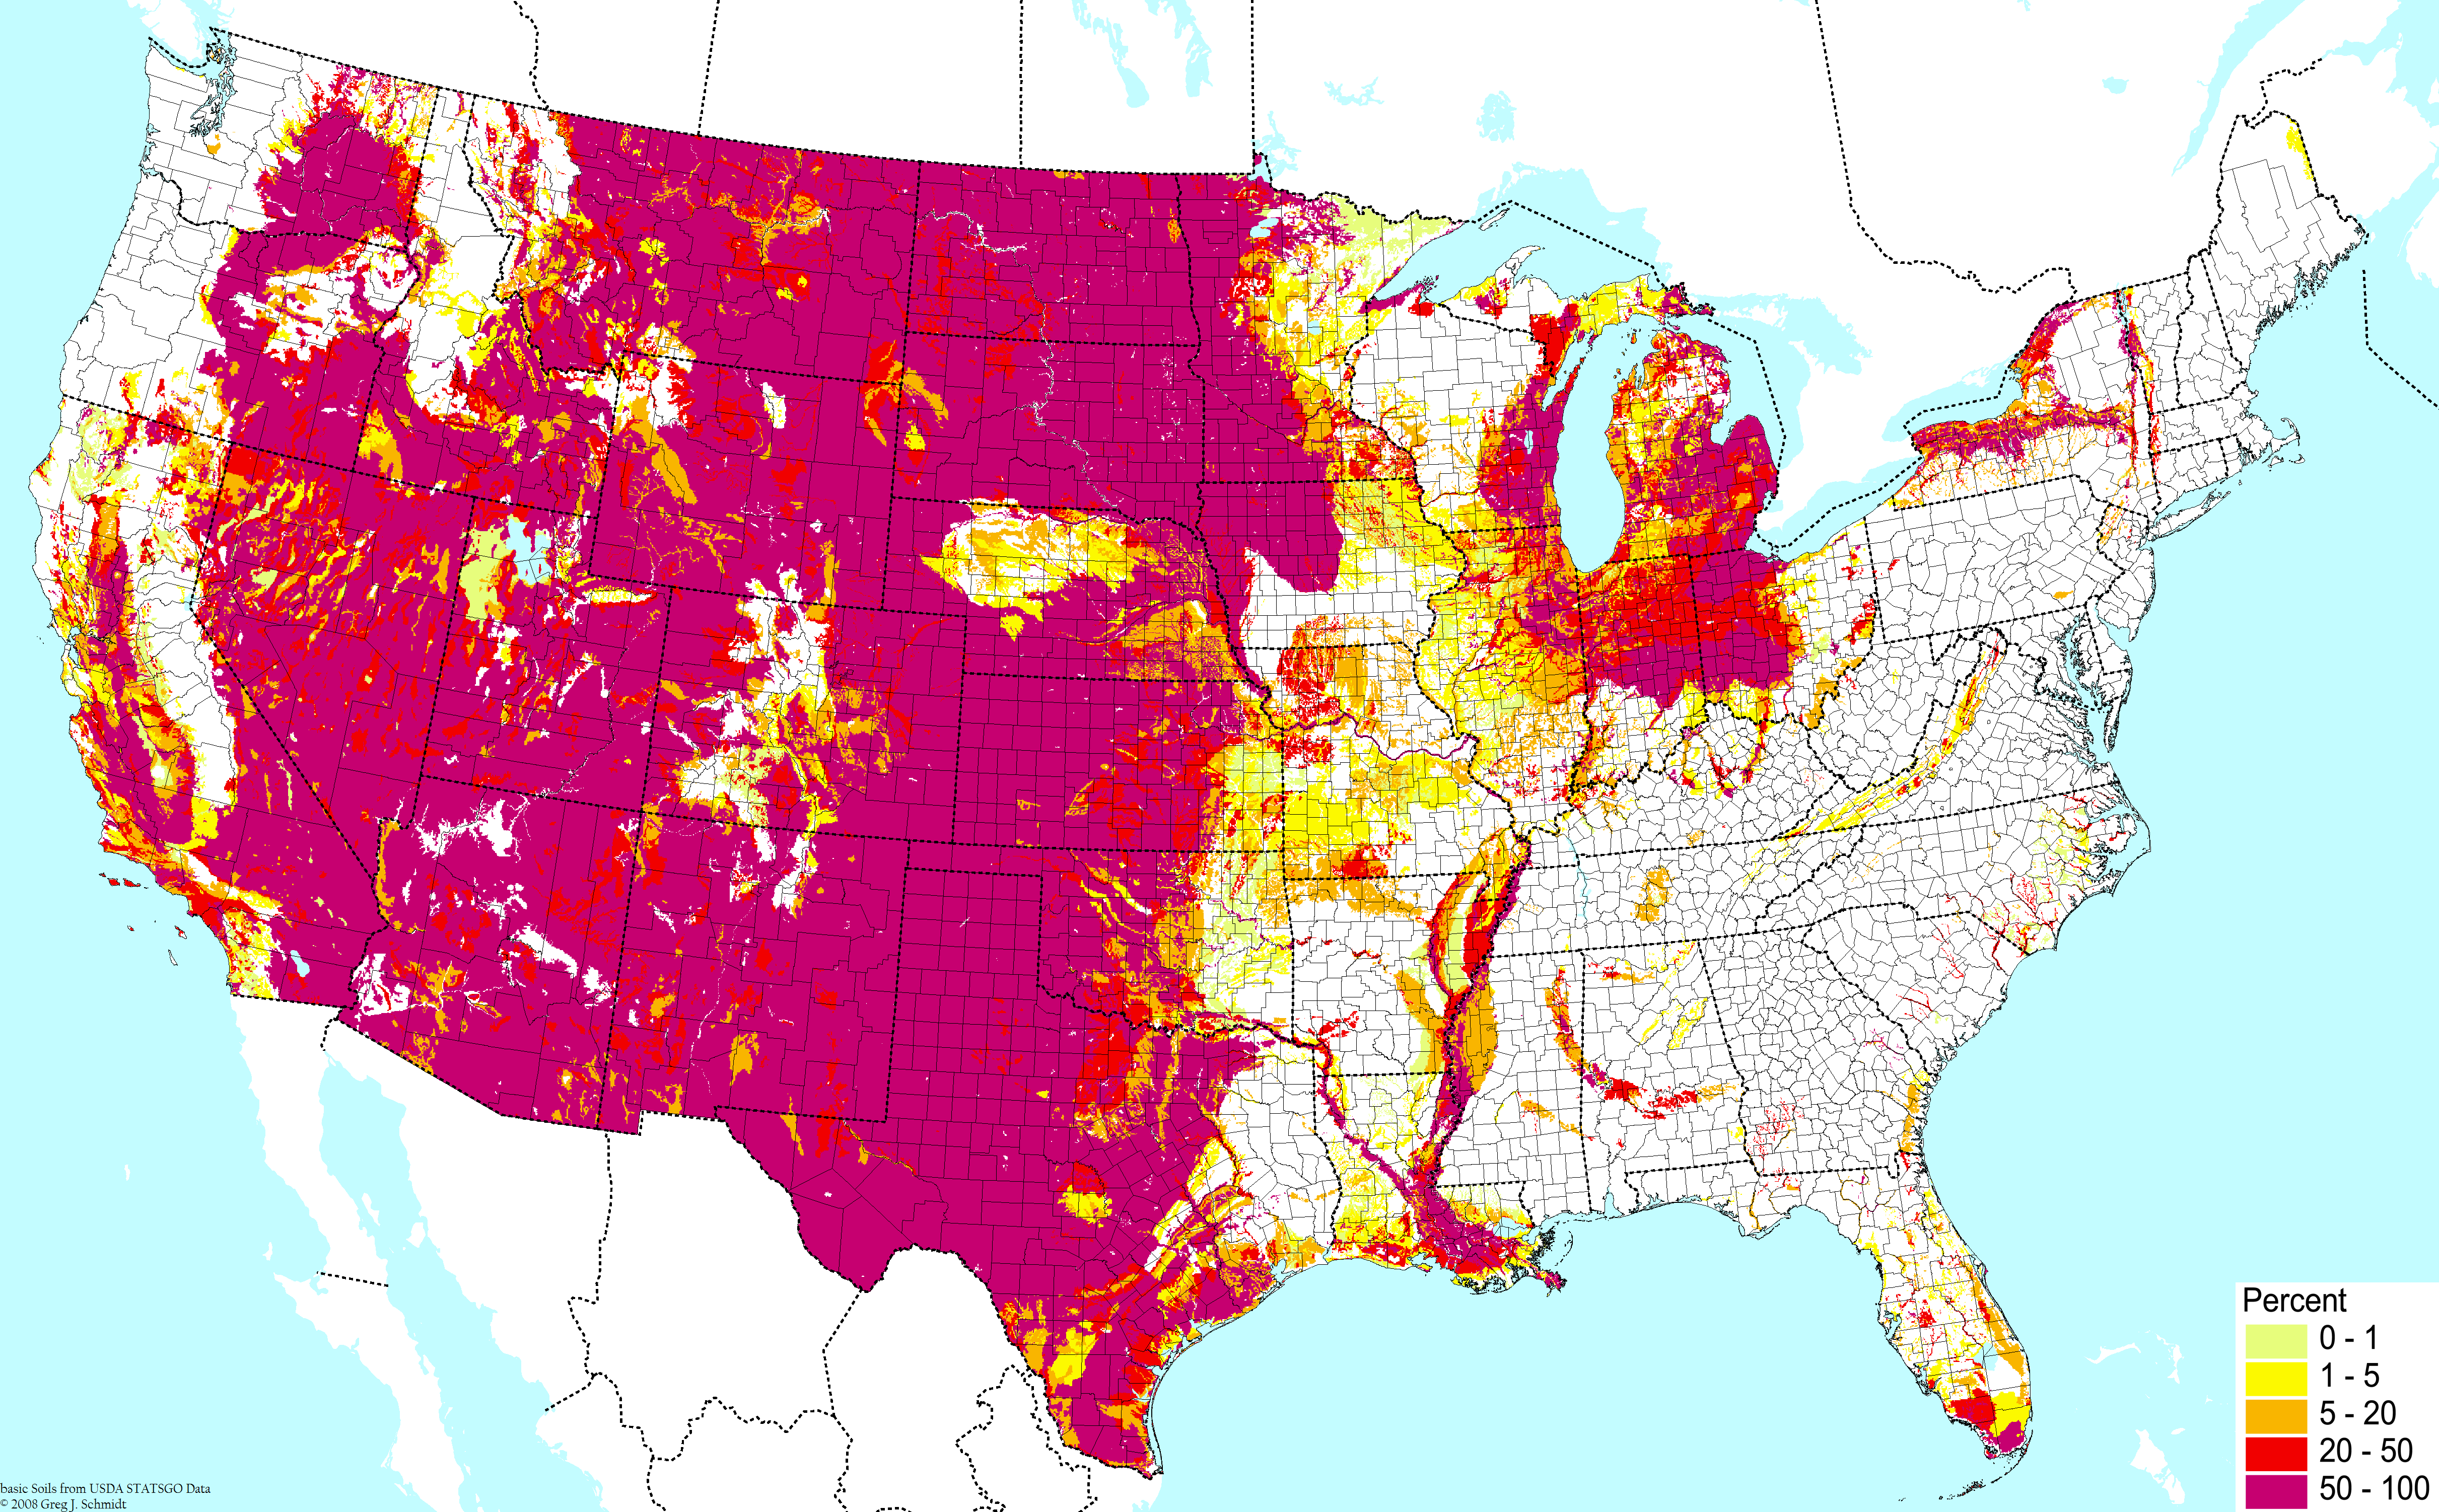
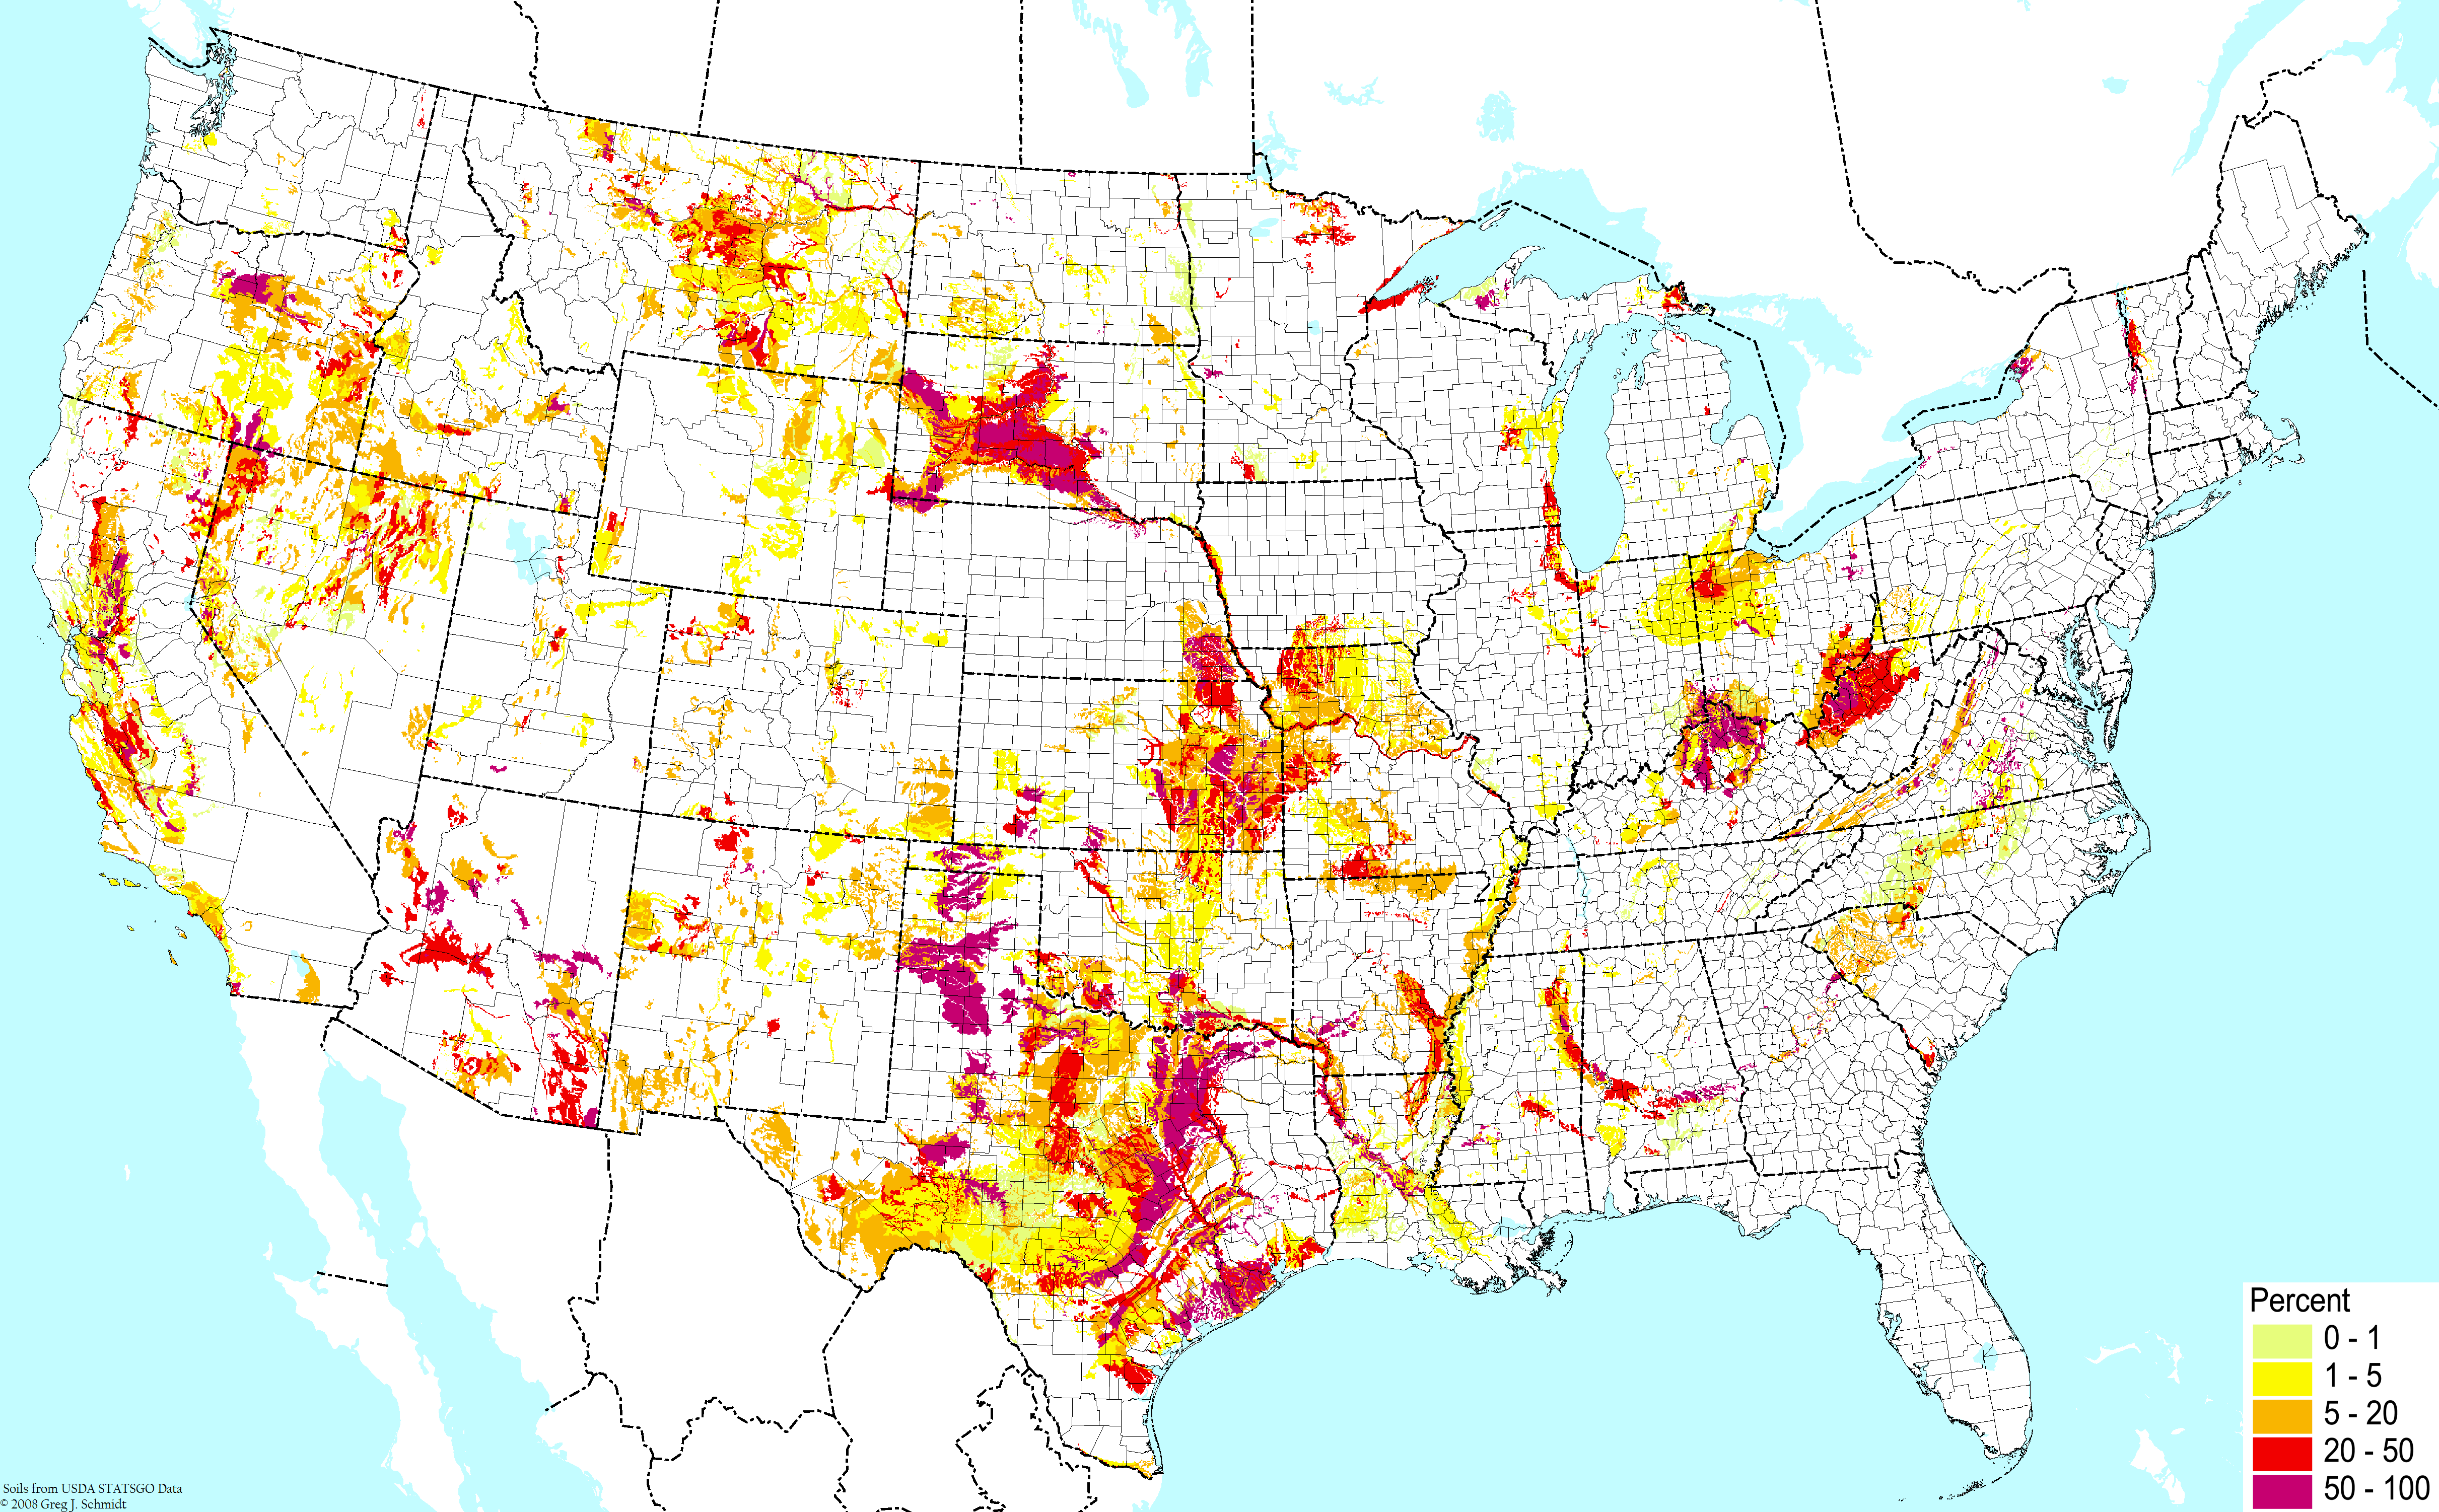
Upland non-acidic clays ©BONAP | 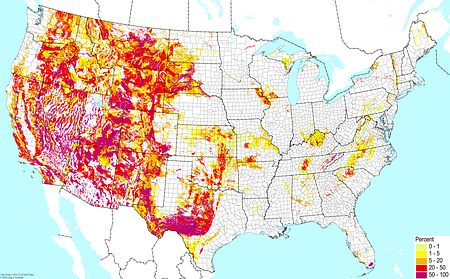
Upland non-acidic shallow soils ©BONAP | 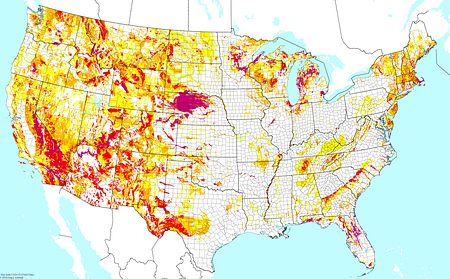
Excessively drained soils ©BONAP |
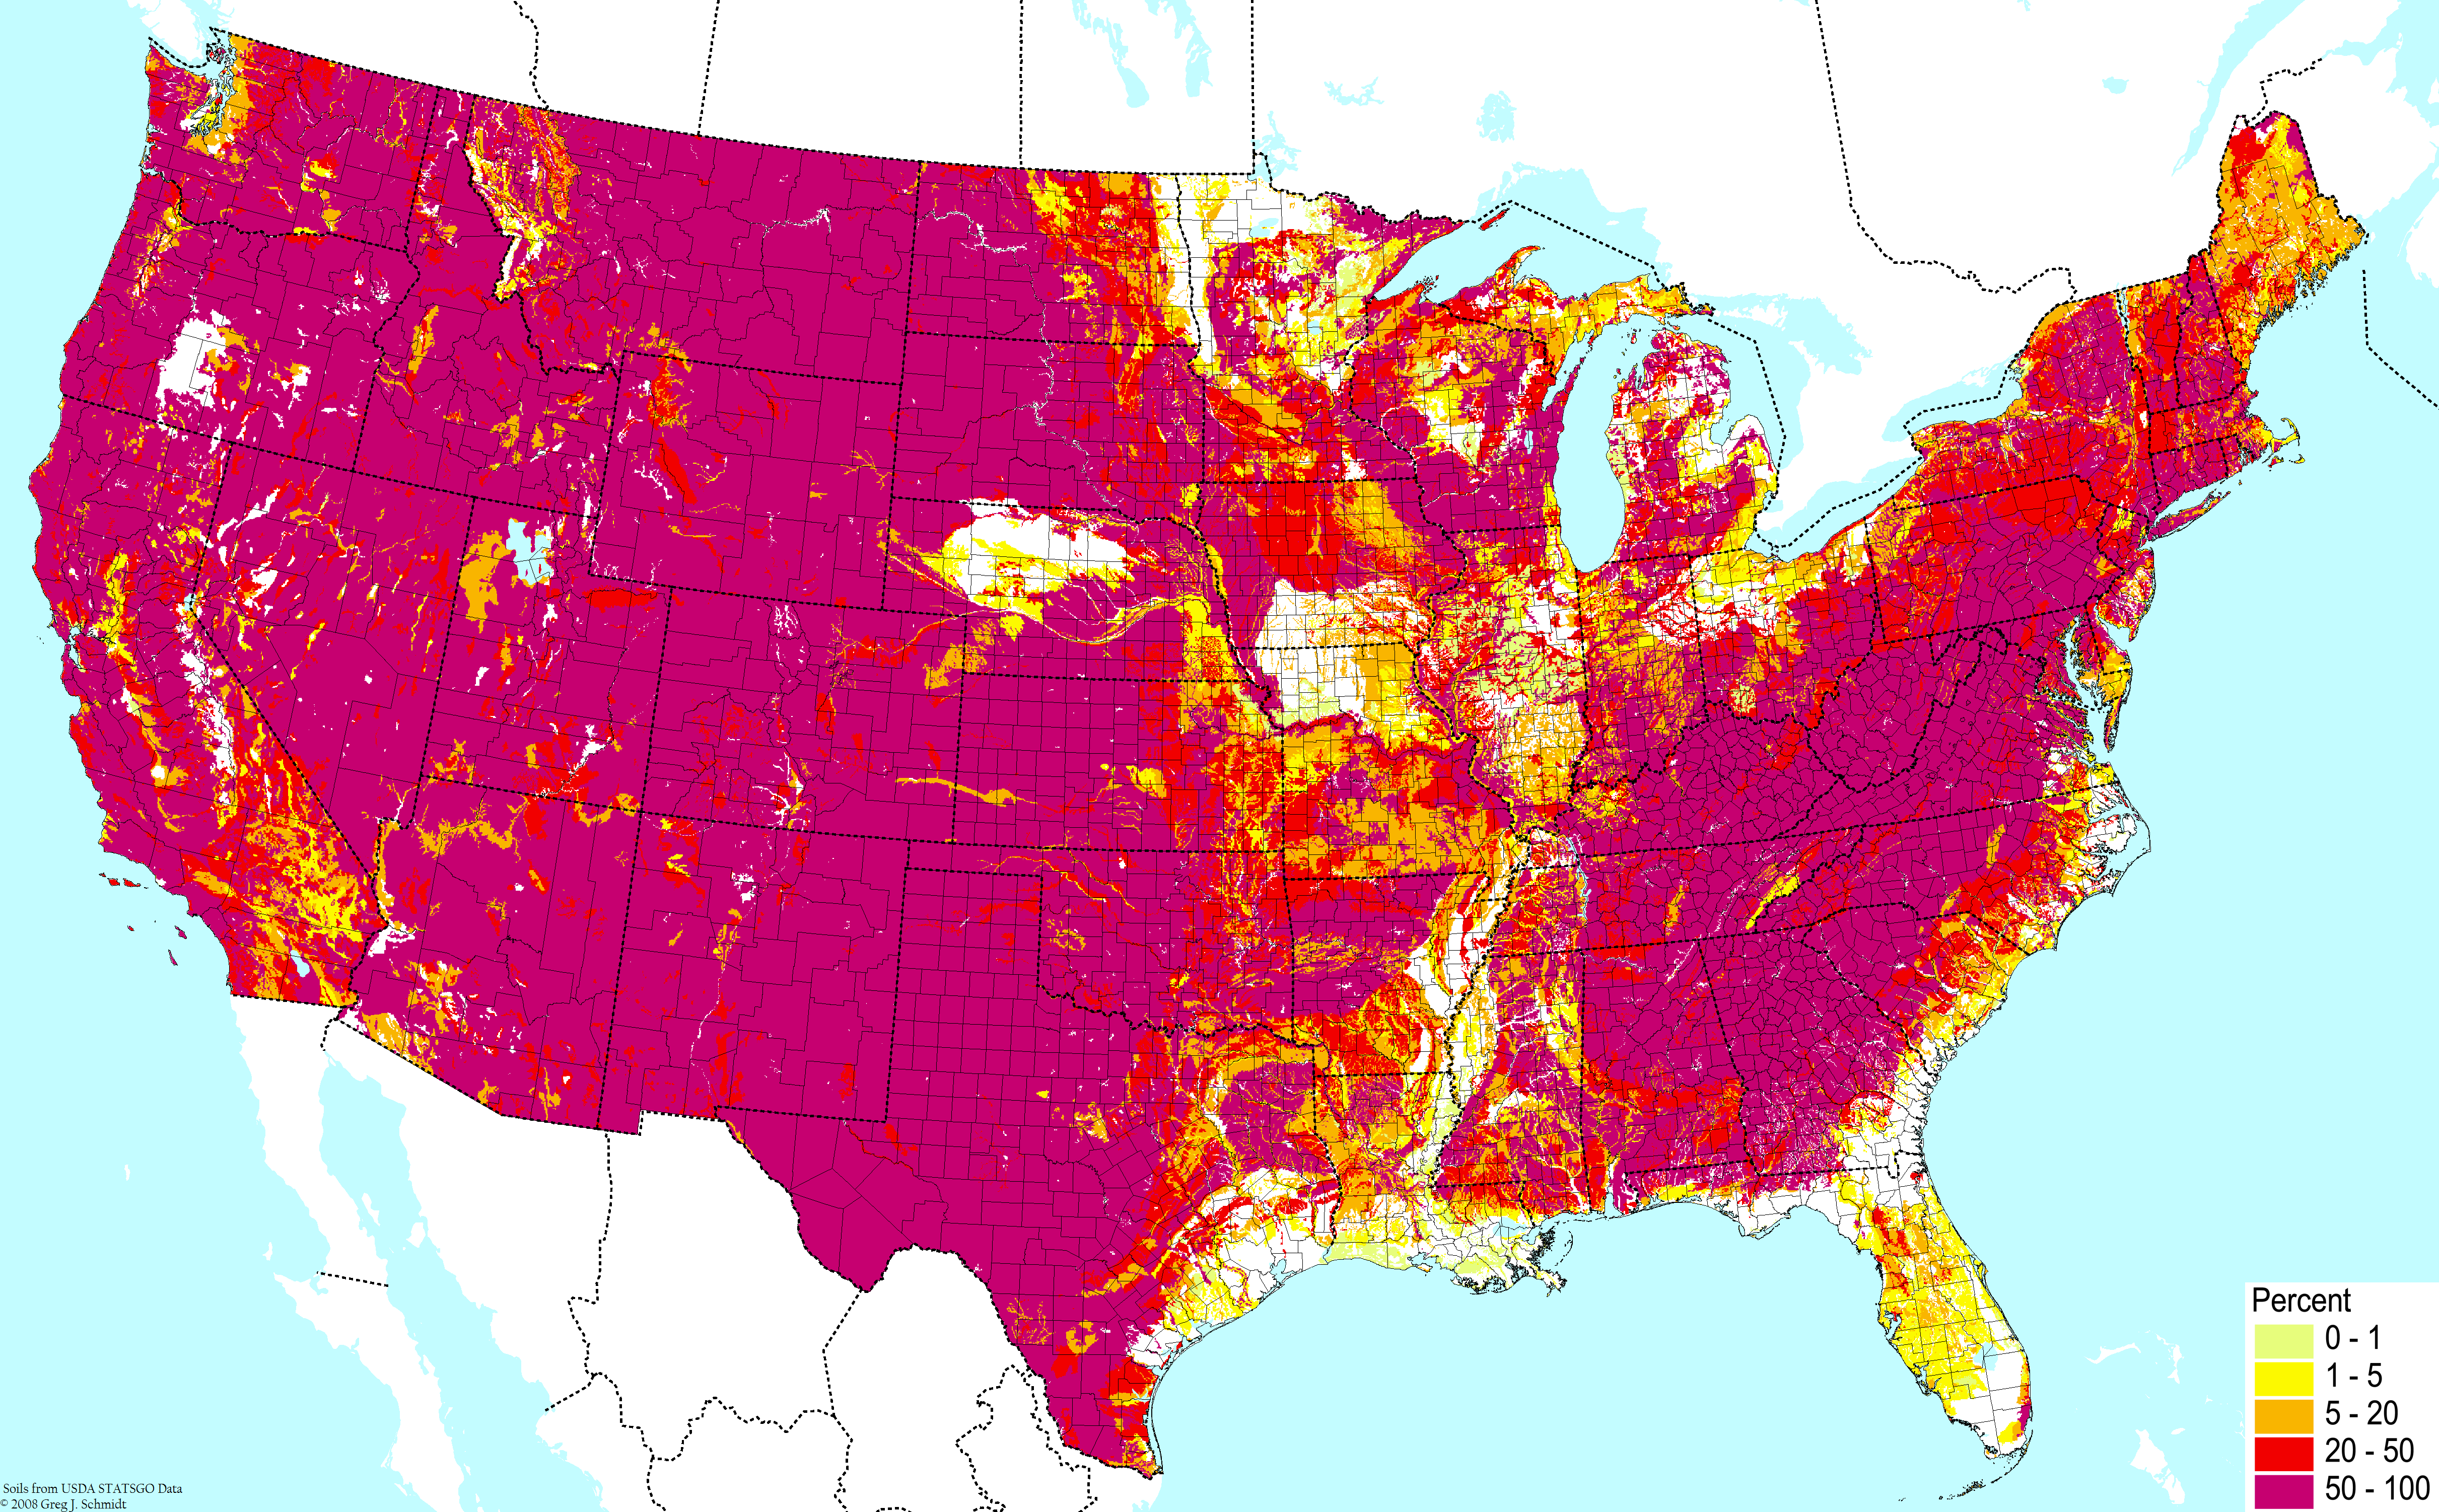
Well-drained soils ©BONAP | 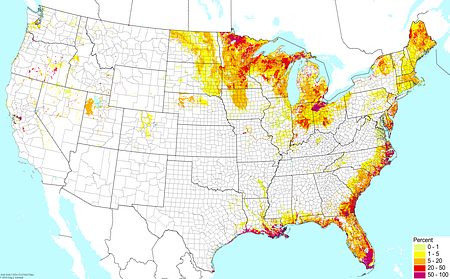
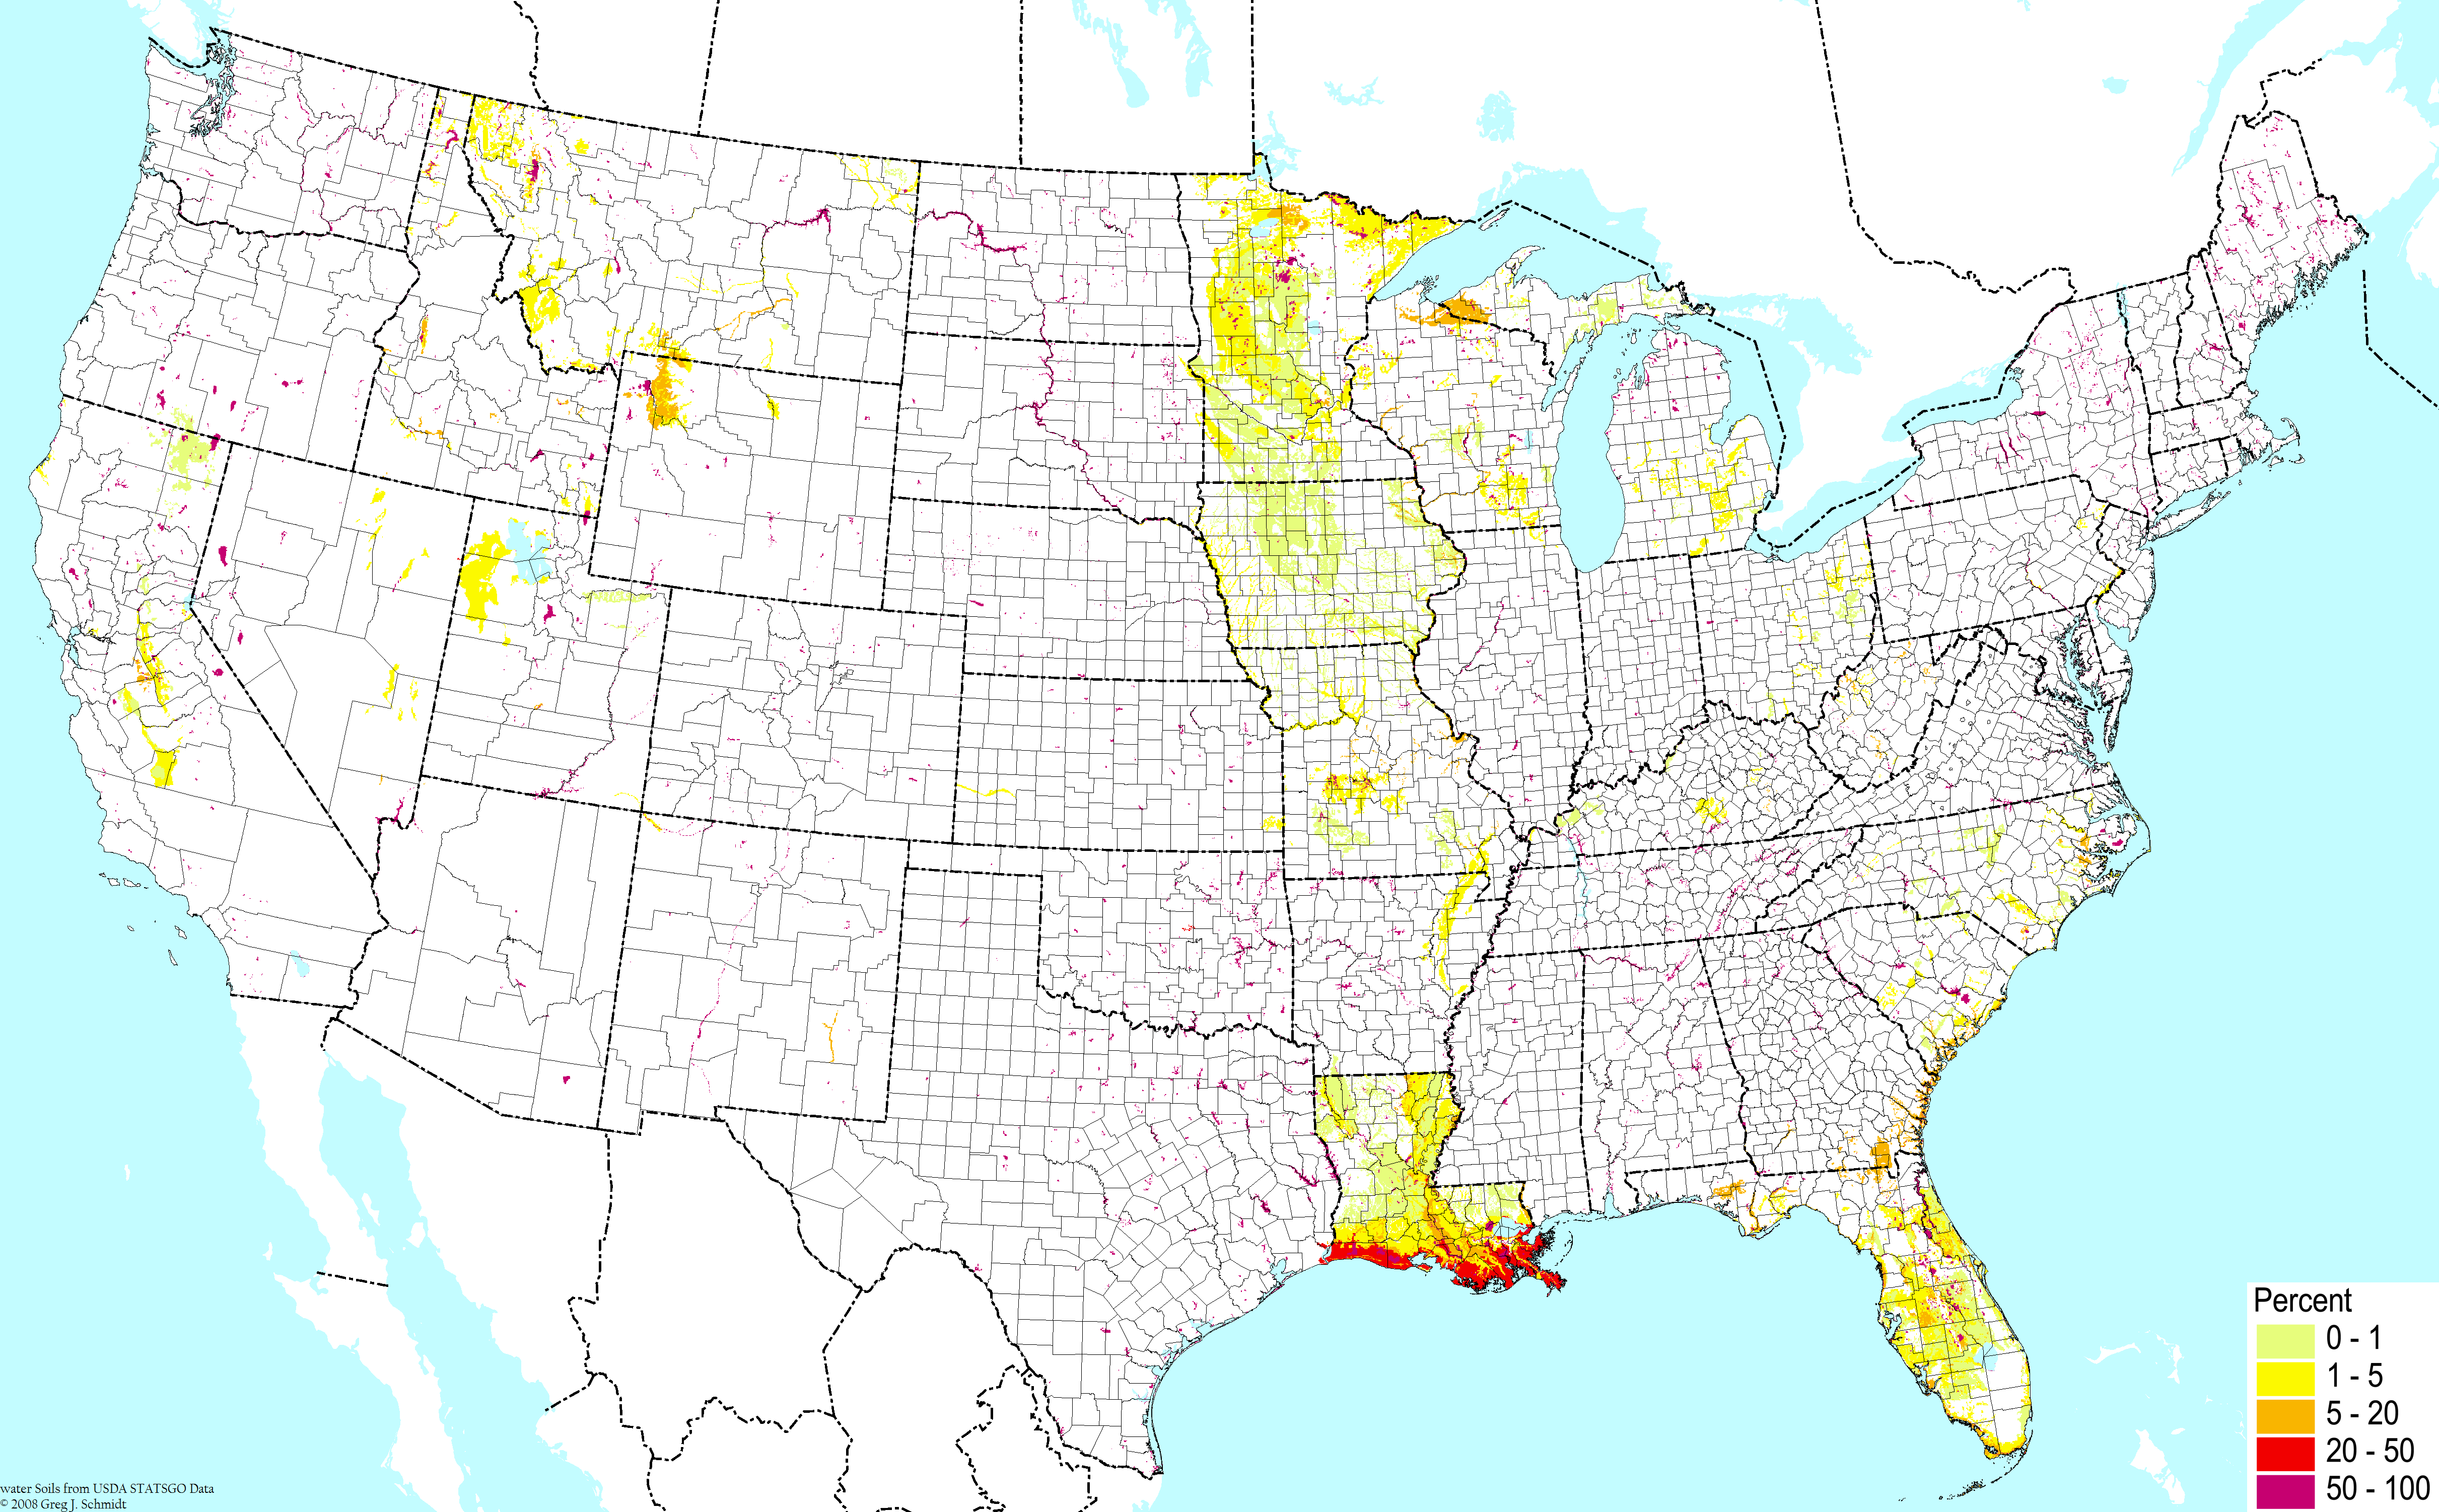
Very poorly-drained soils ©BONAP
| 
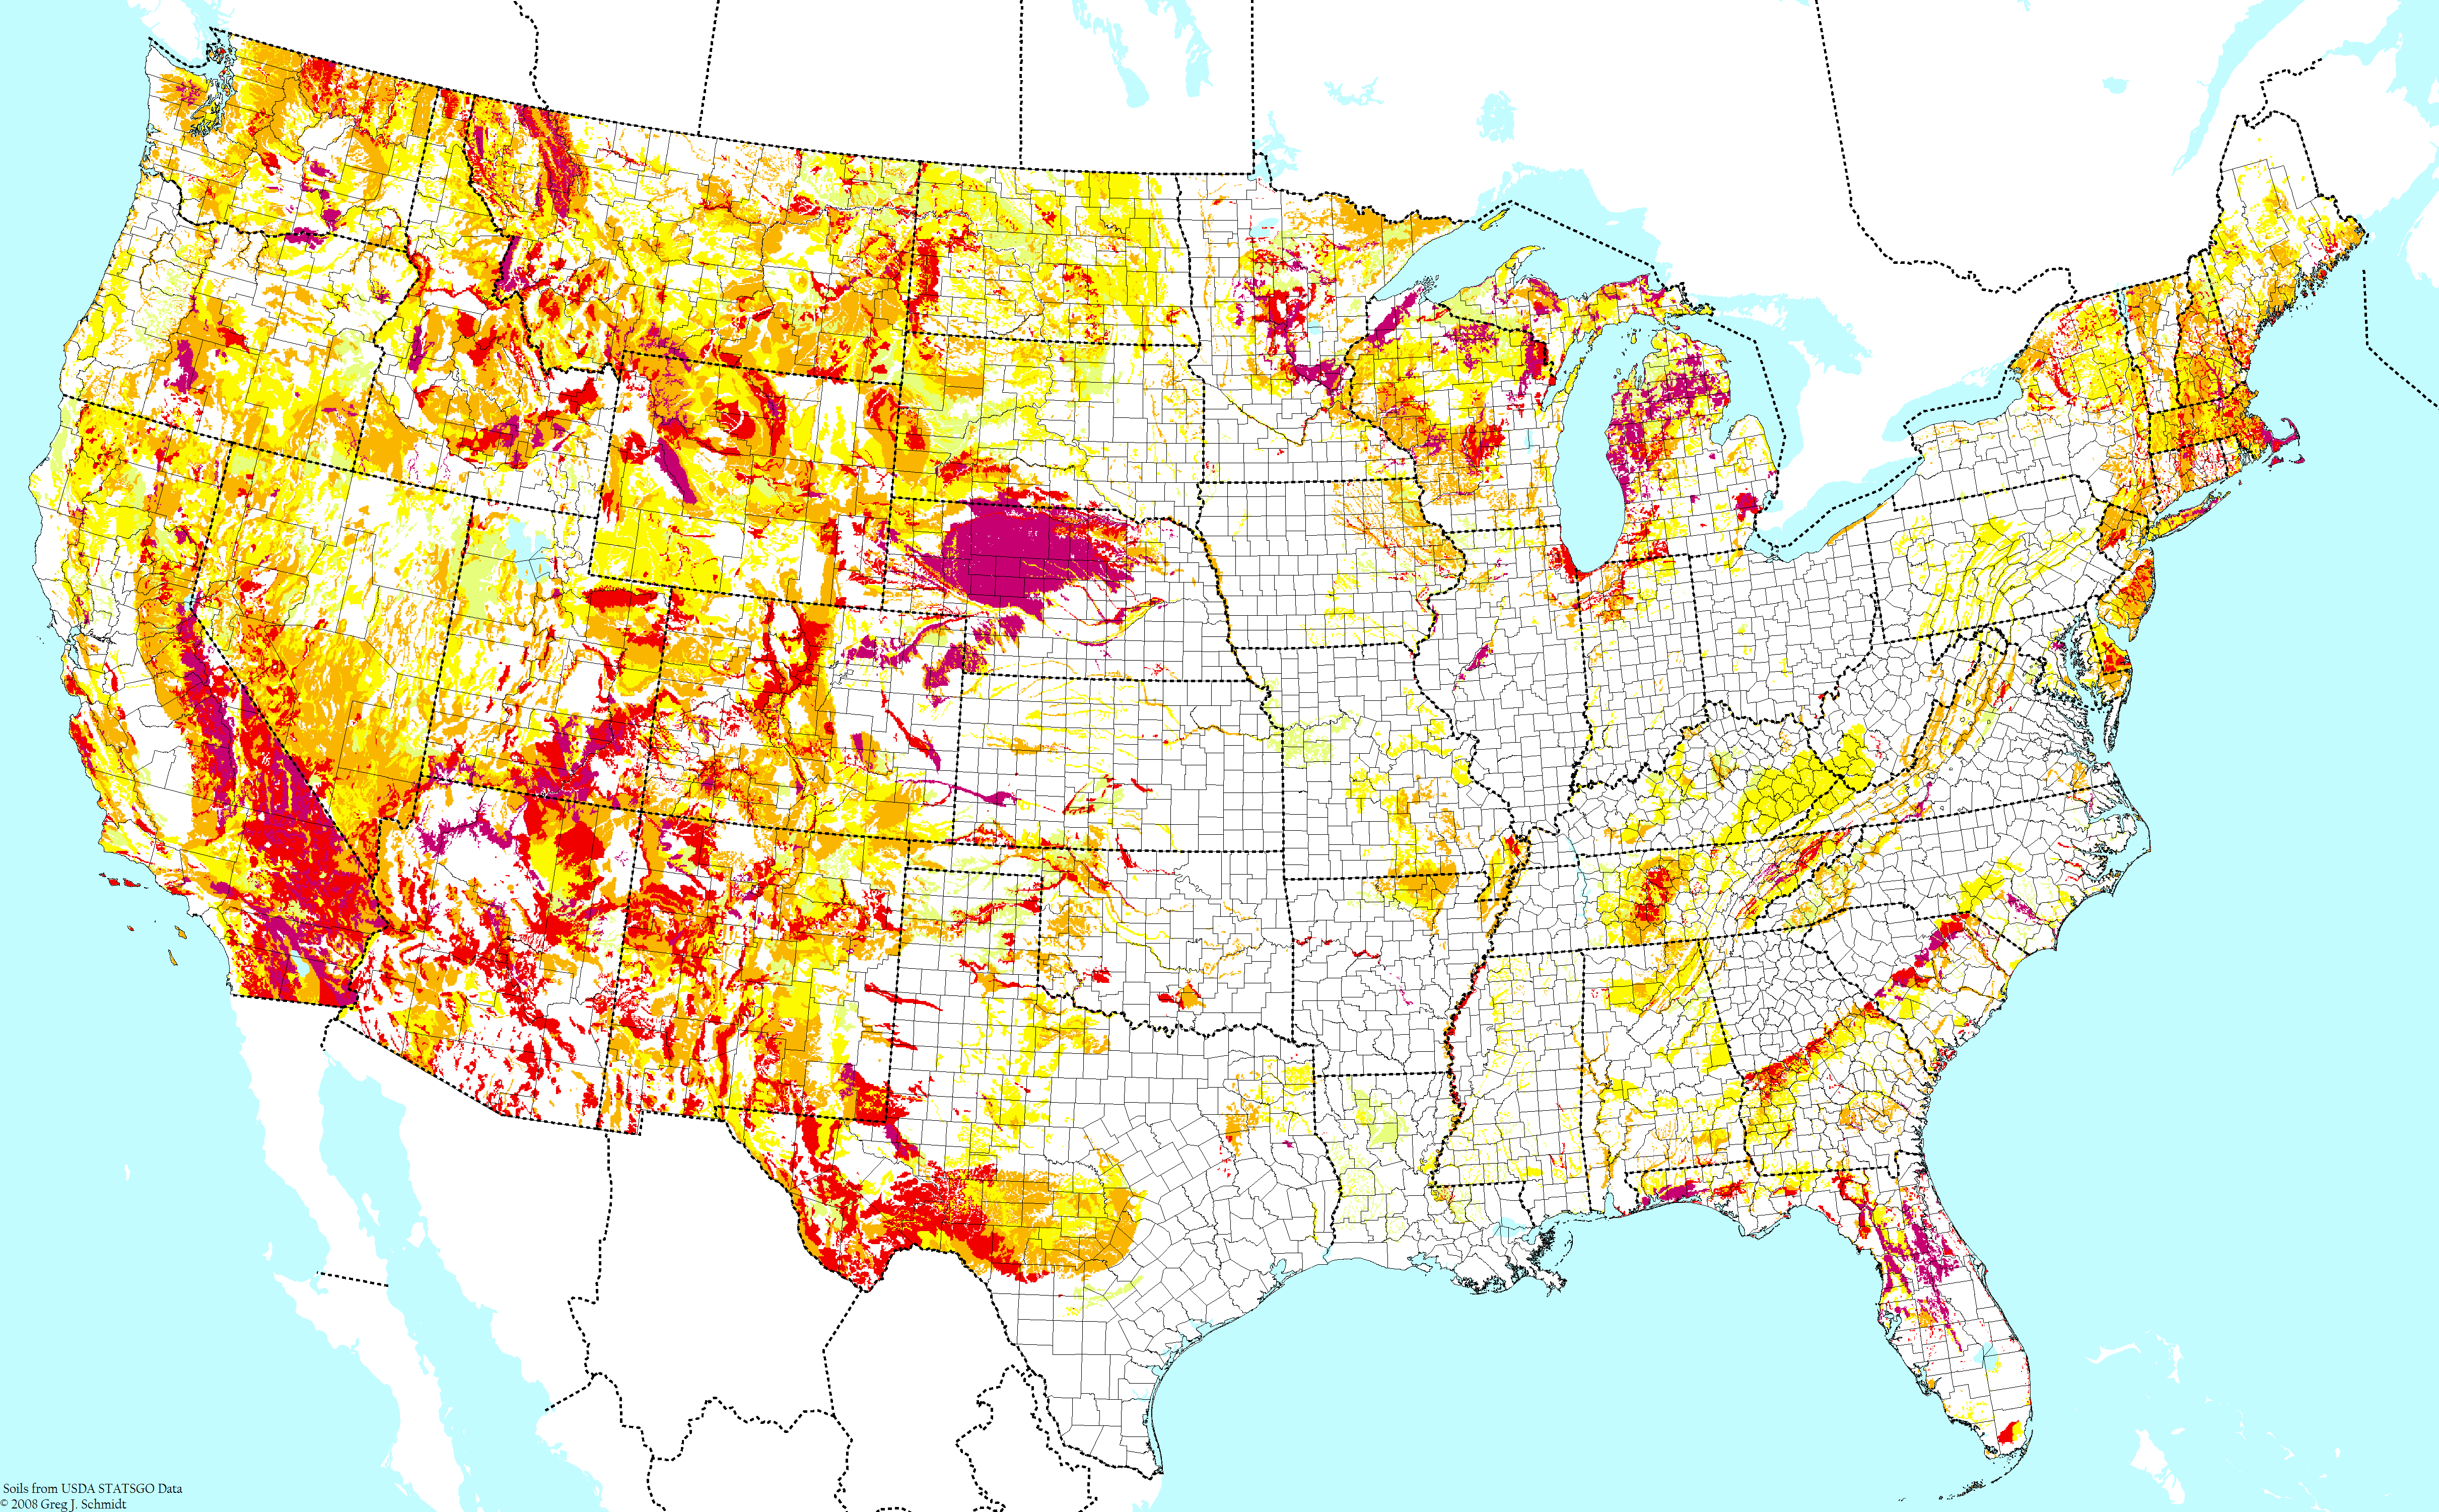
Soils with nutrient-rich clays (excluding wetlands) ©BONAP |
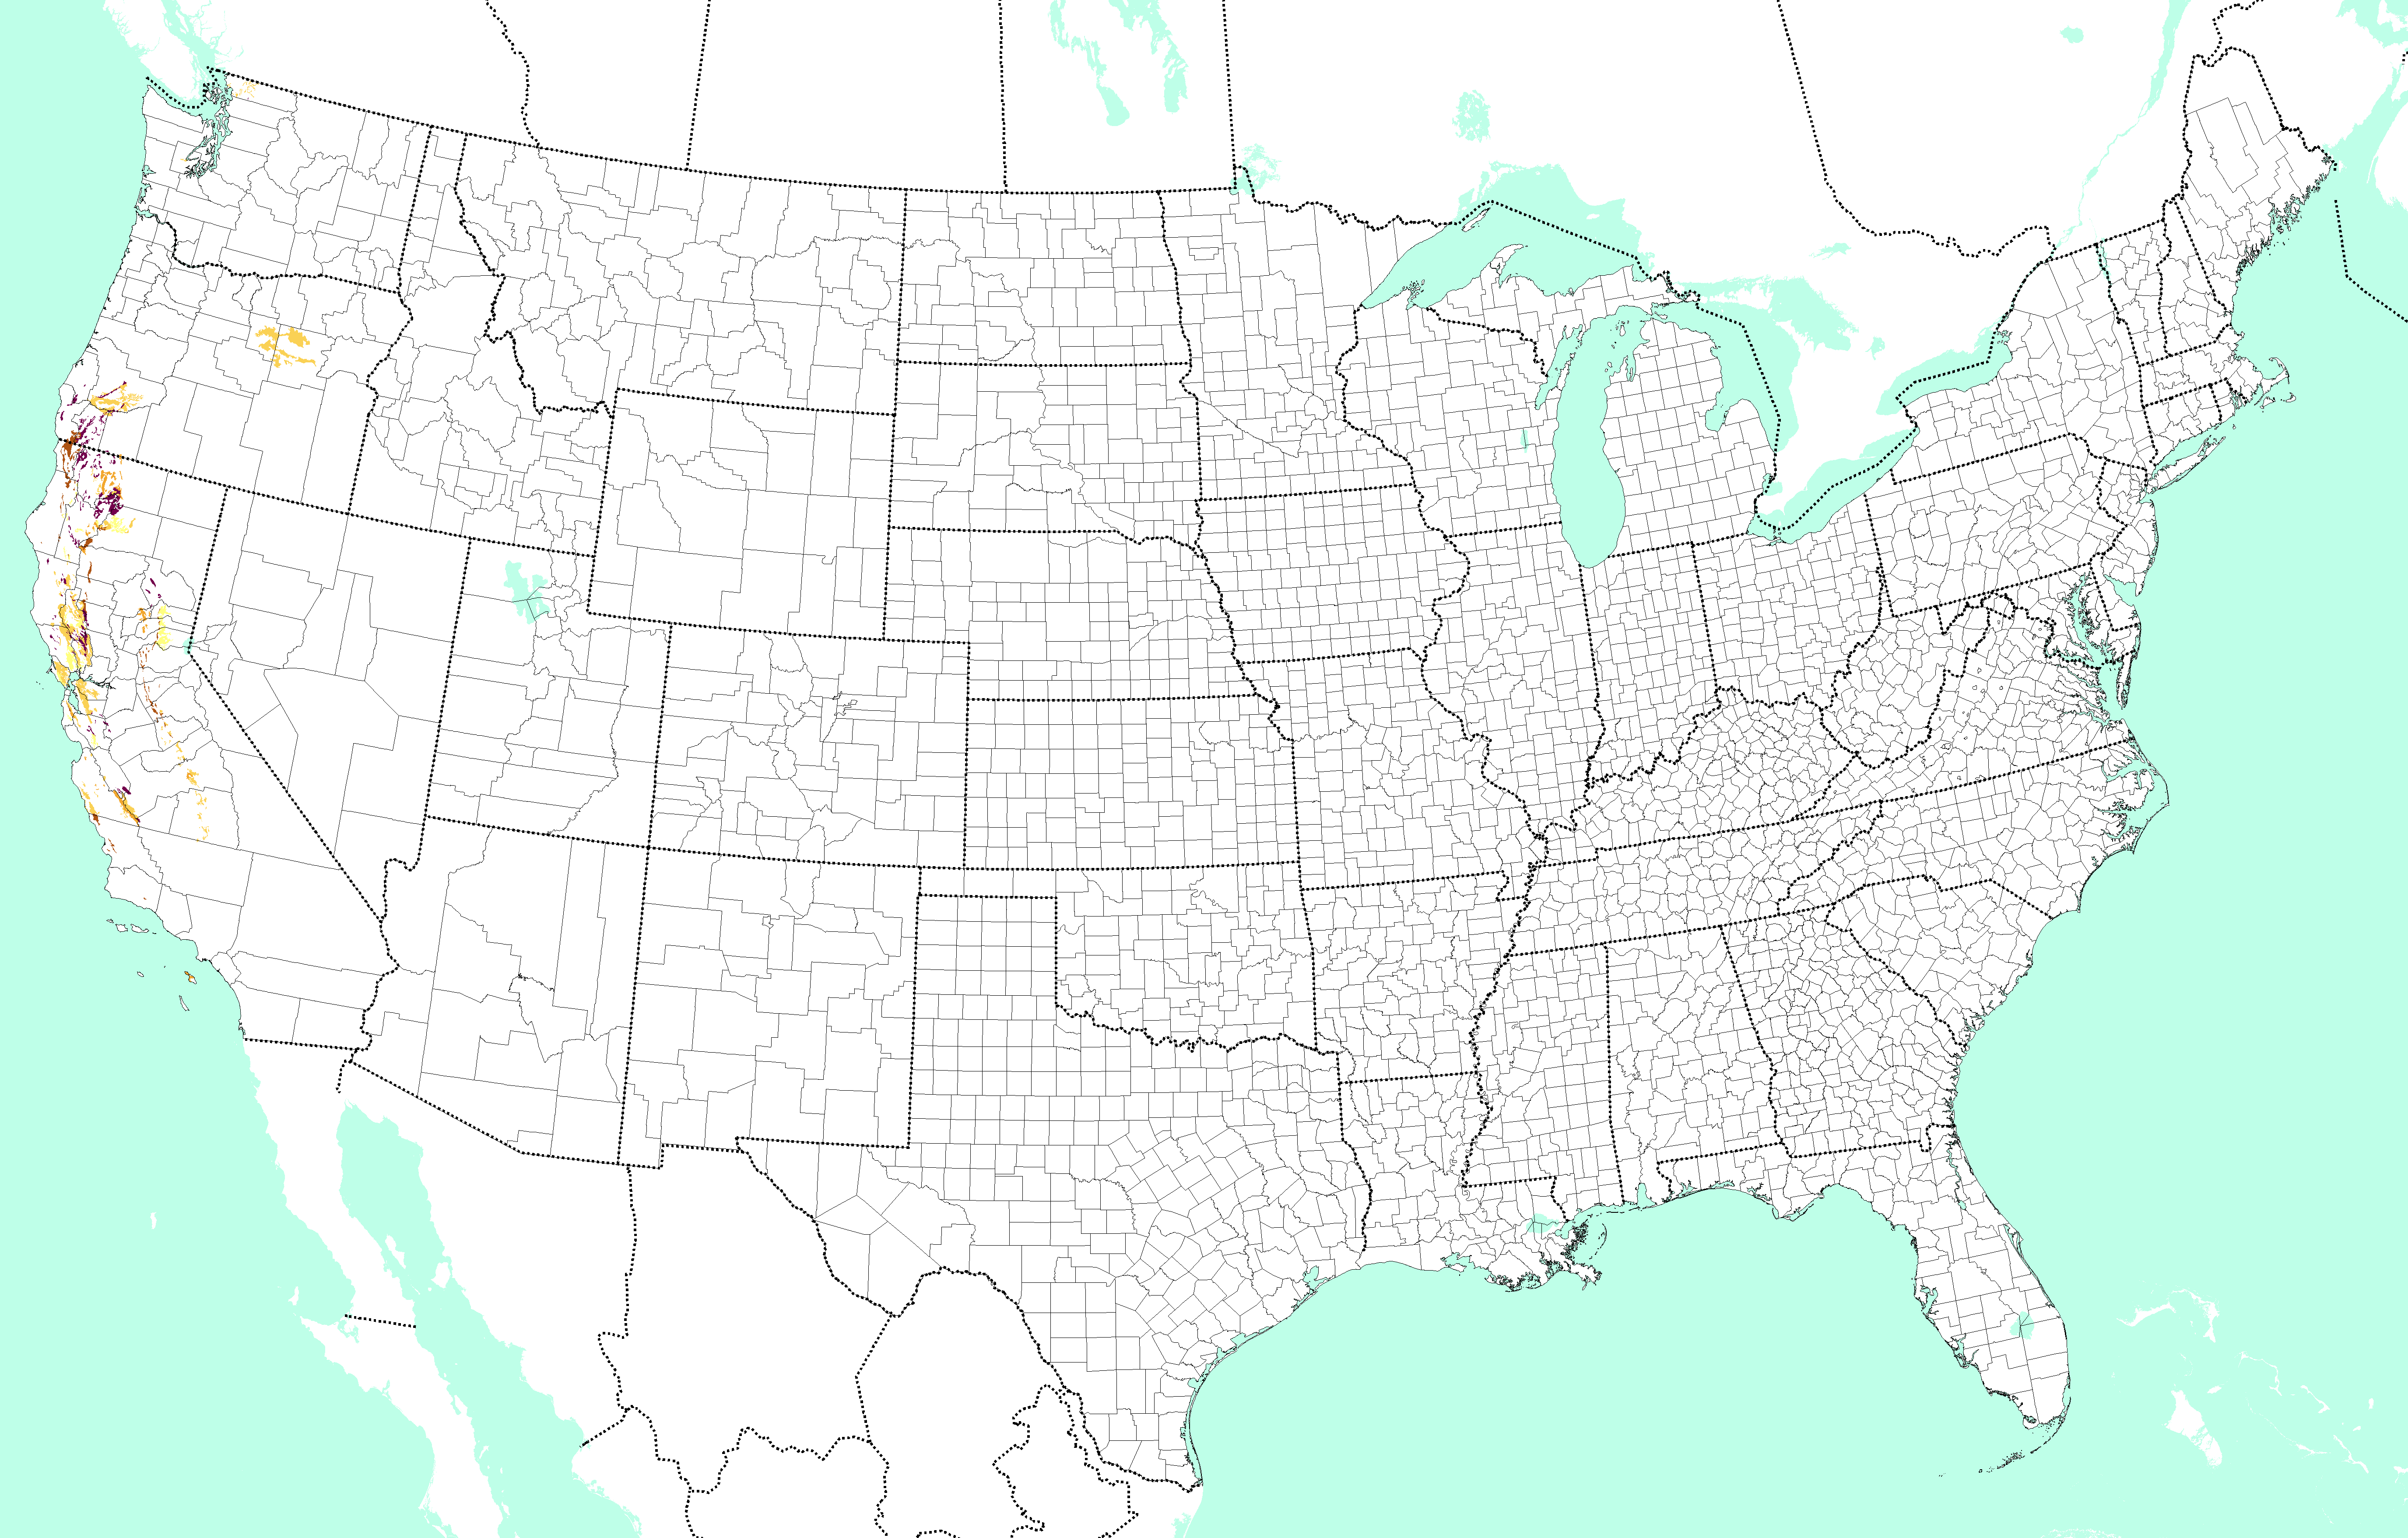
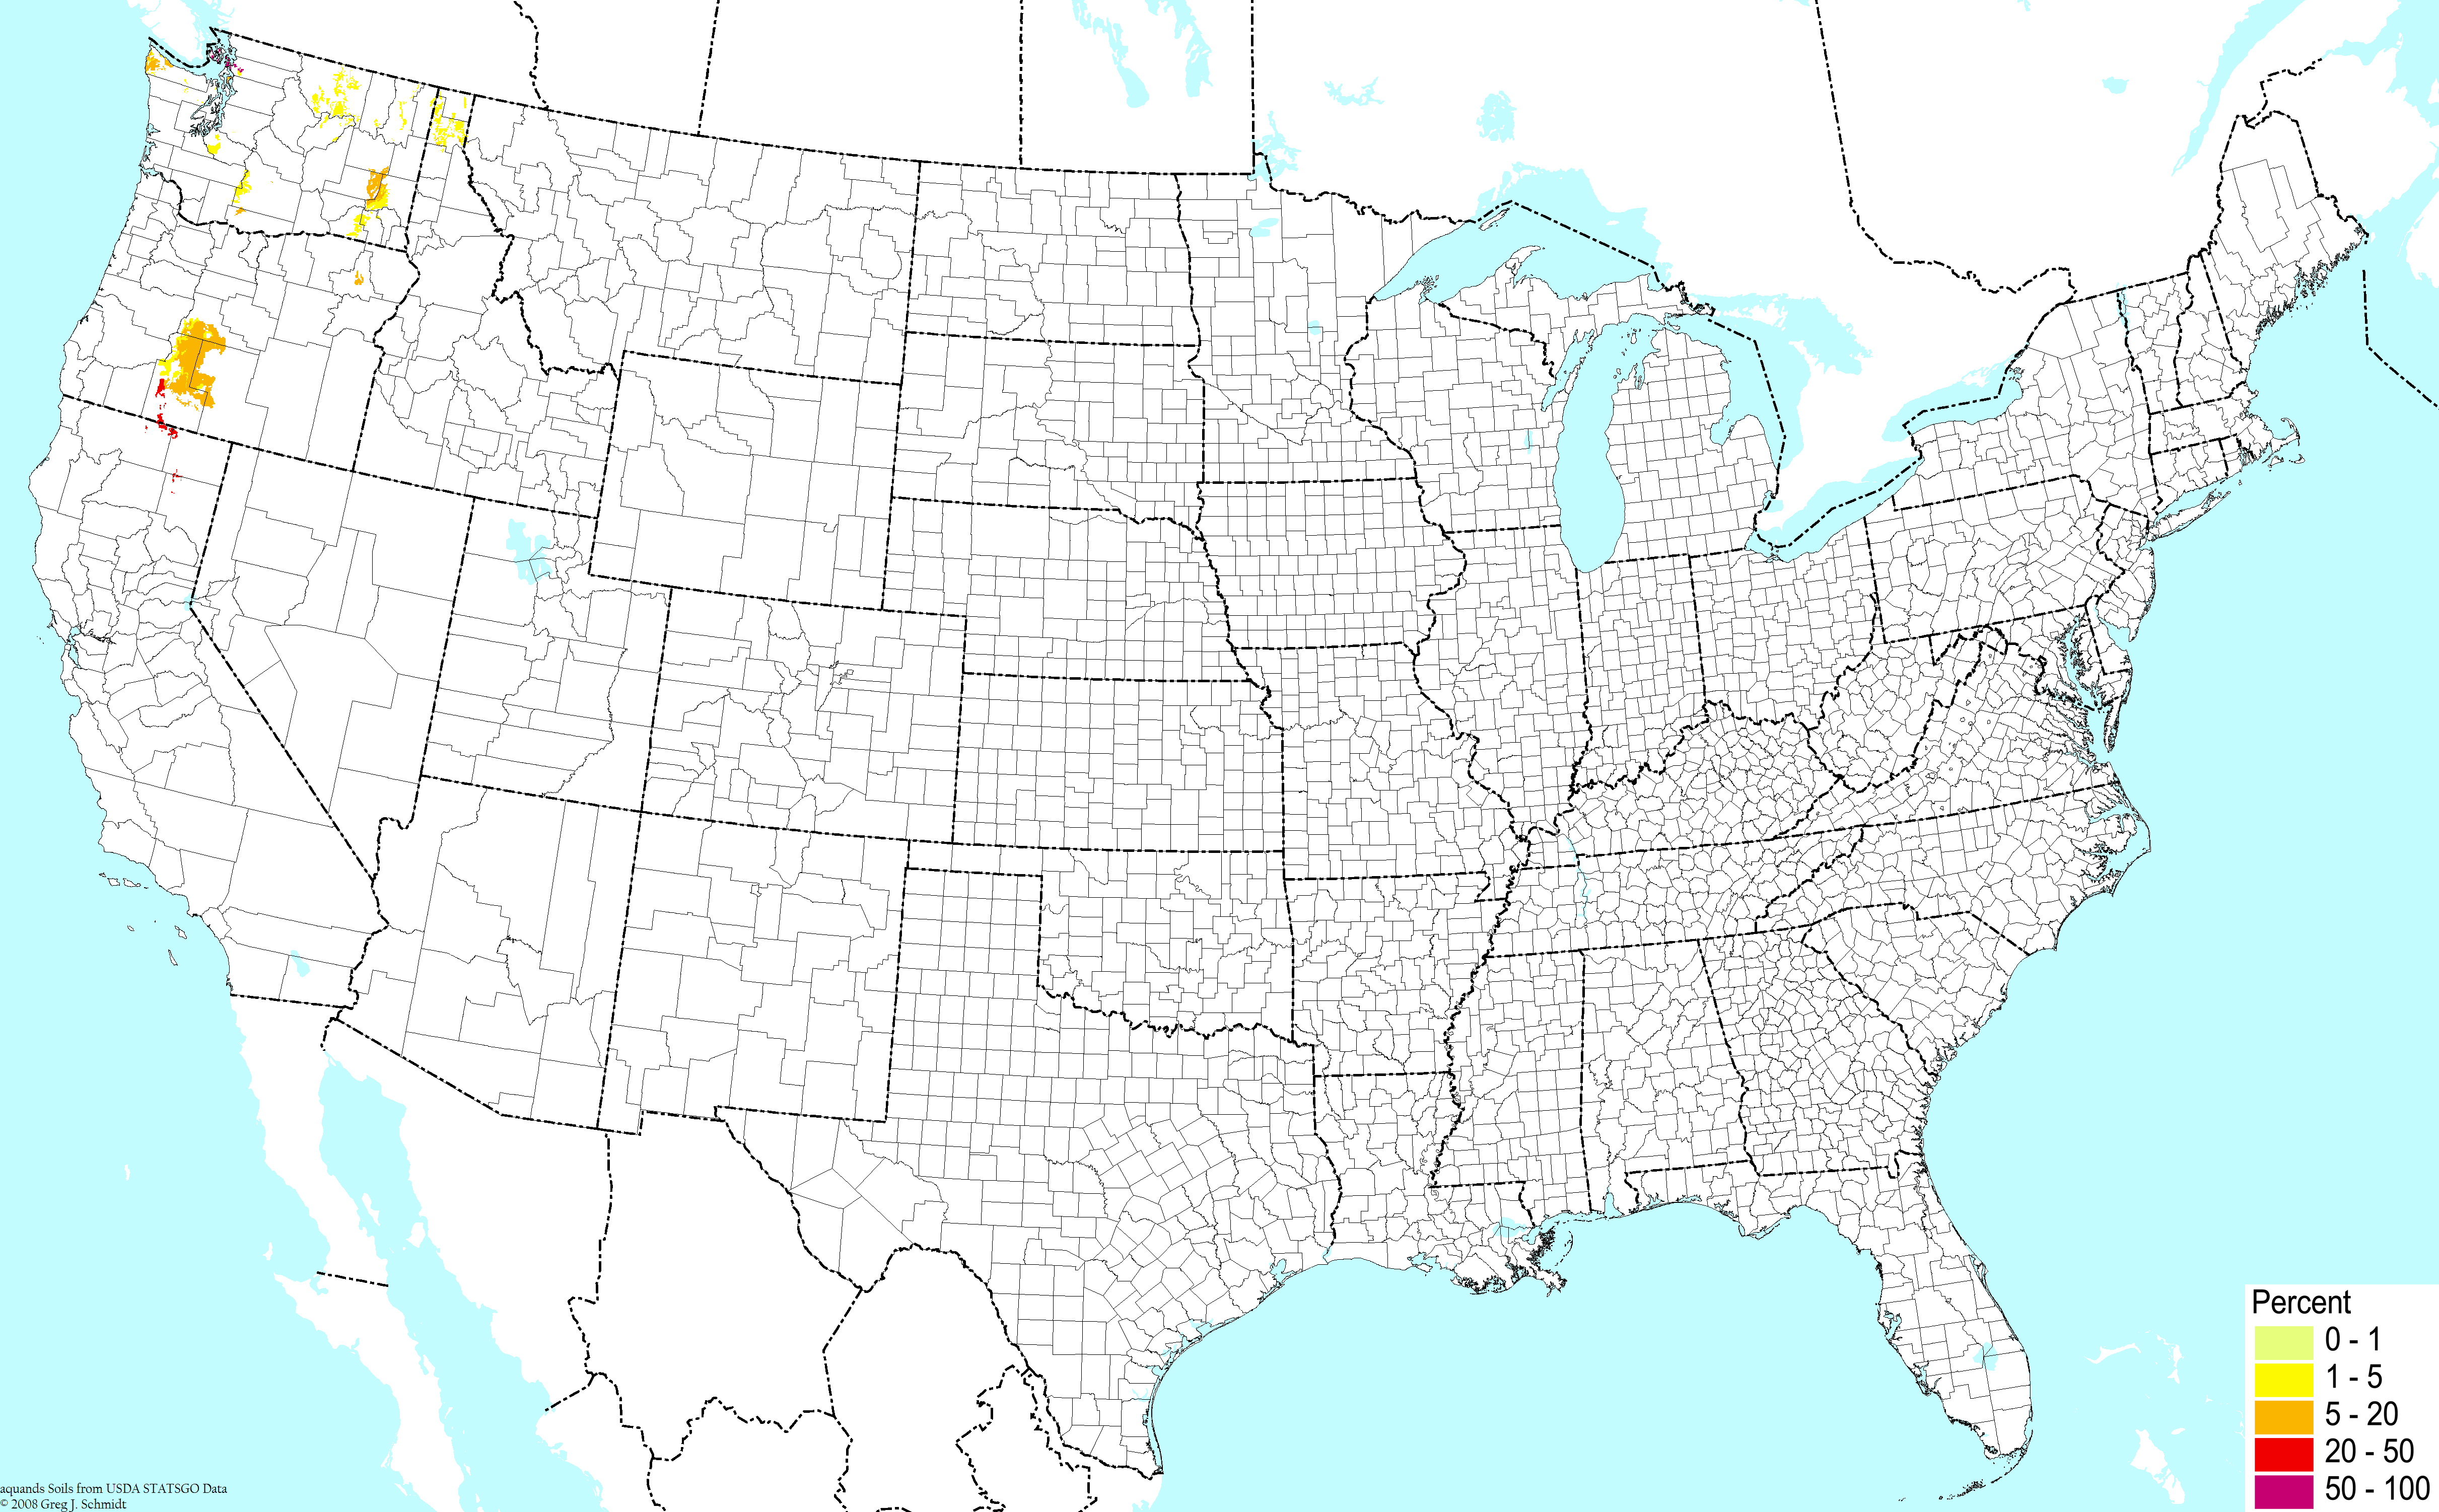
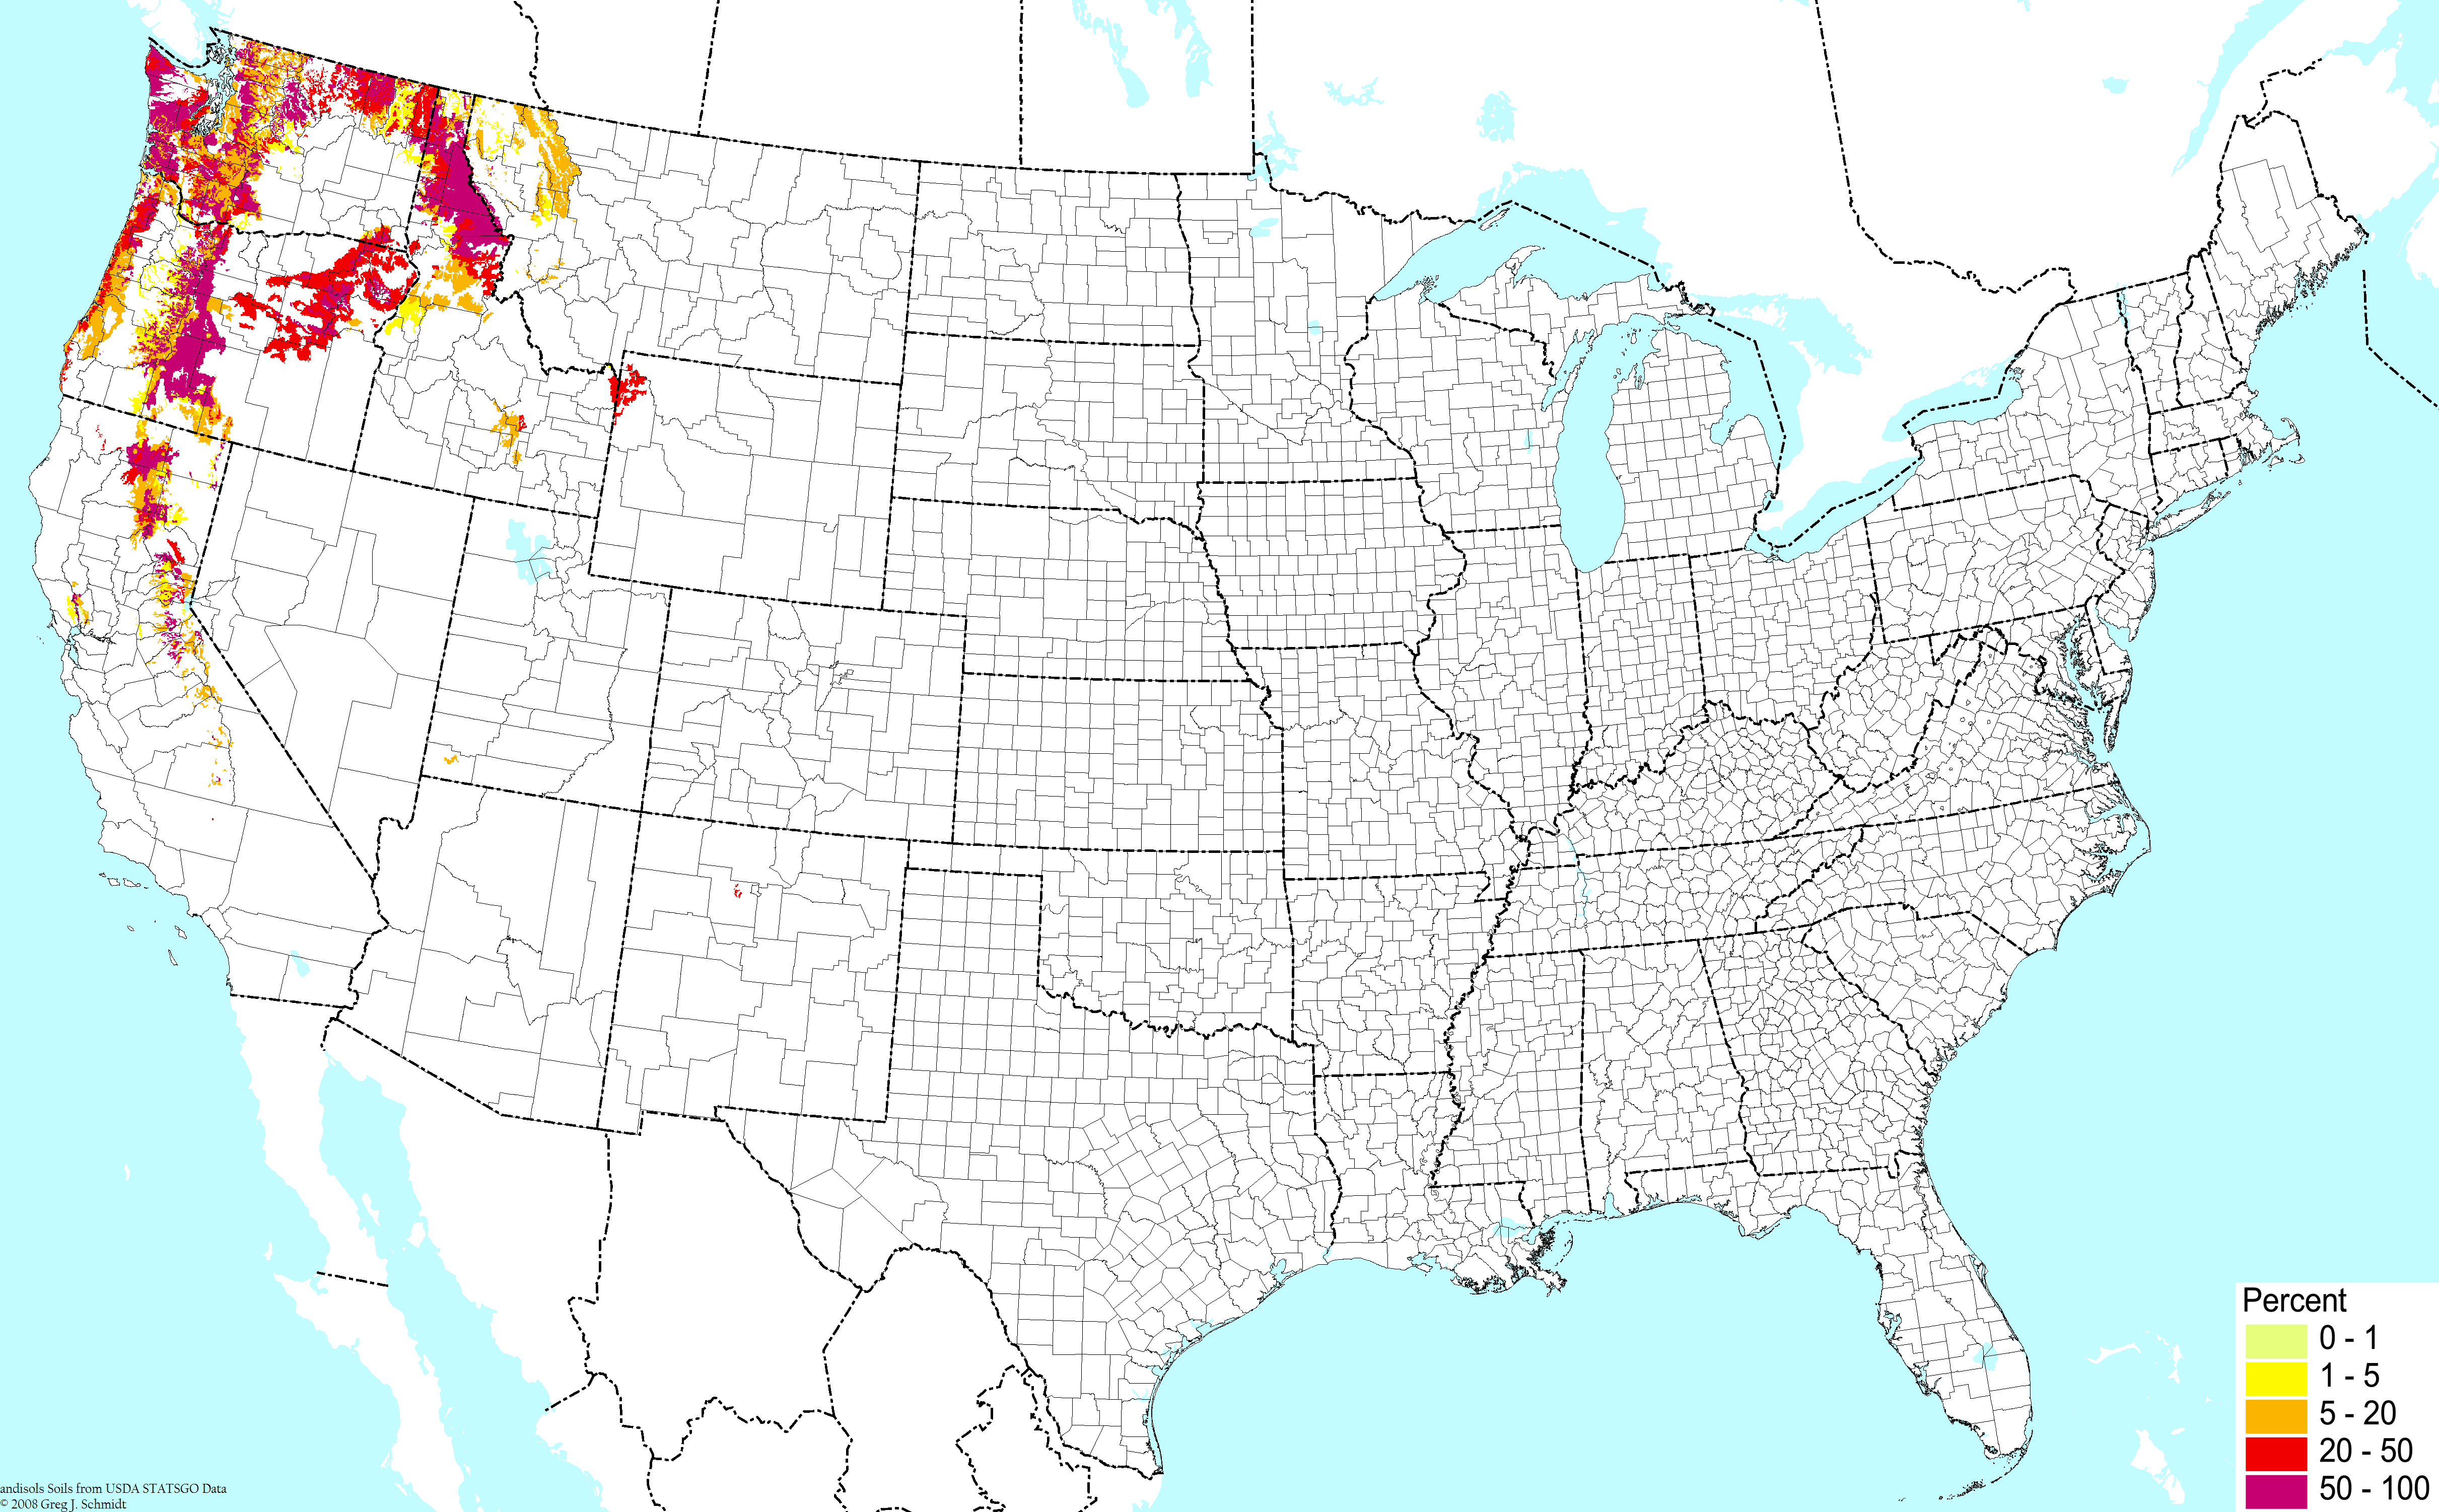
Volcanic soils (excluding wetlands) ©BONAP | 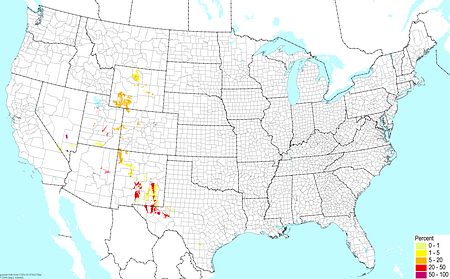
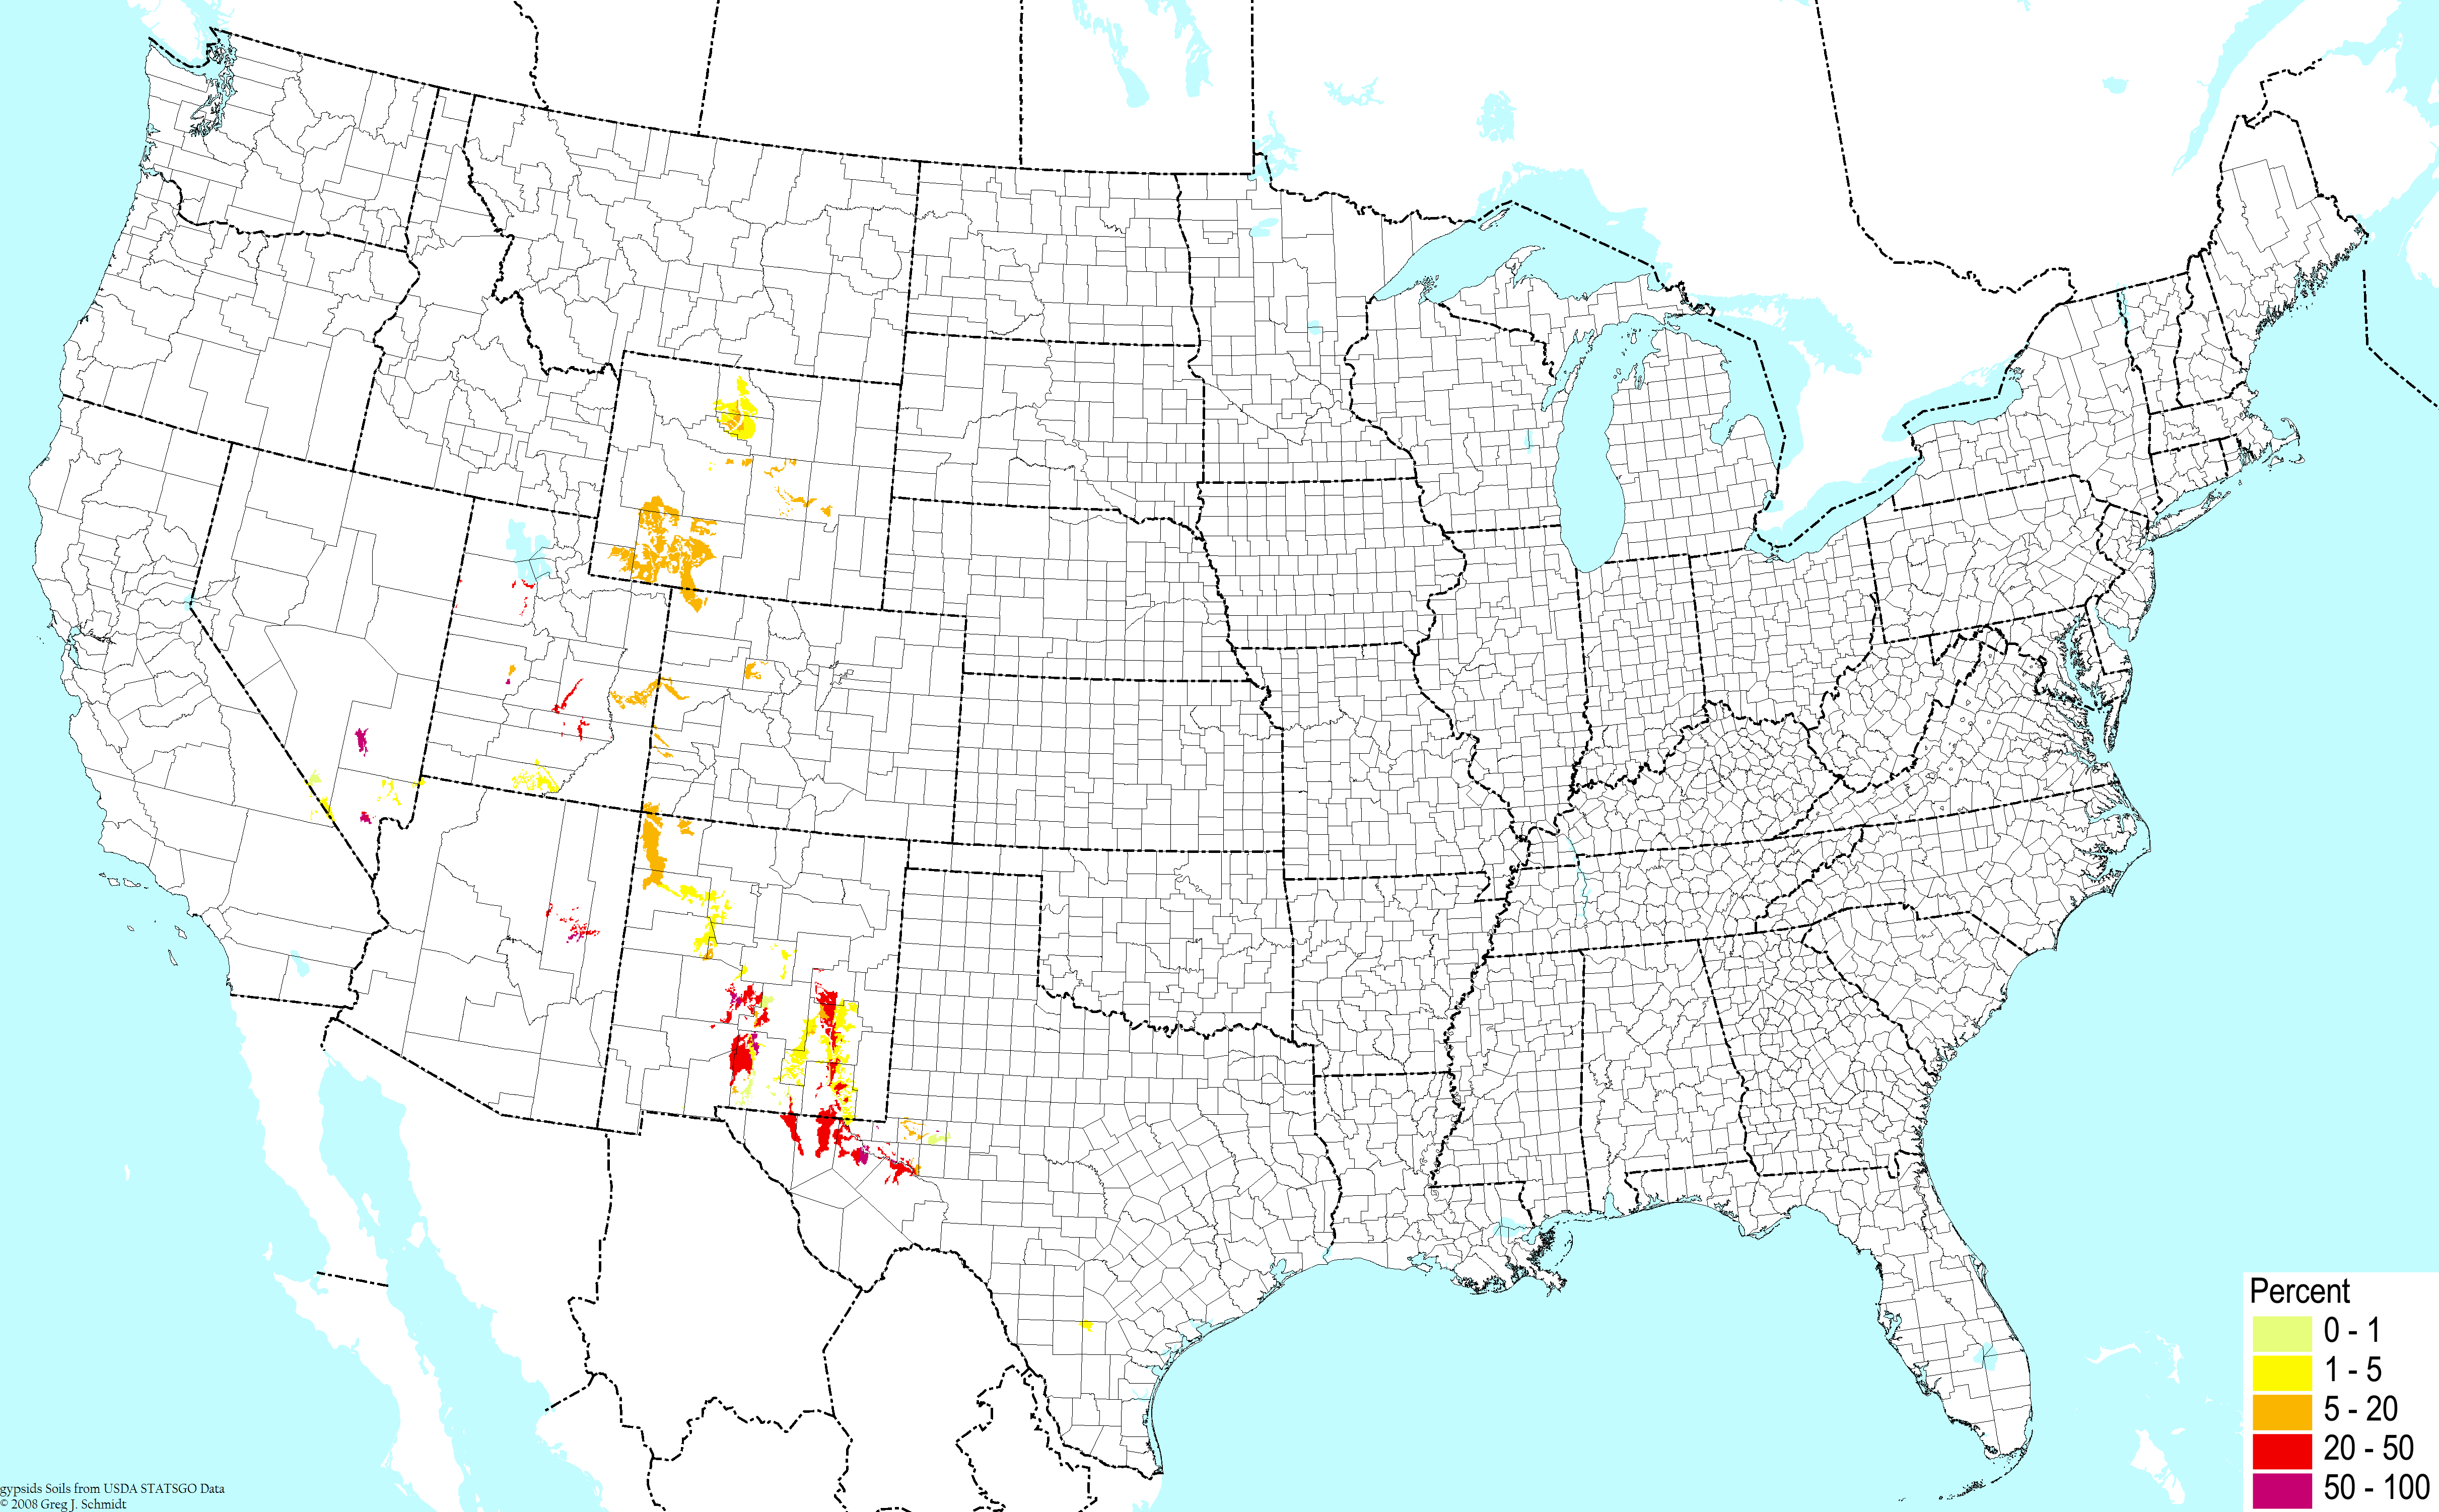
Gypsum soils ©BONAP | 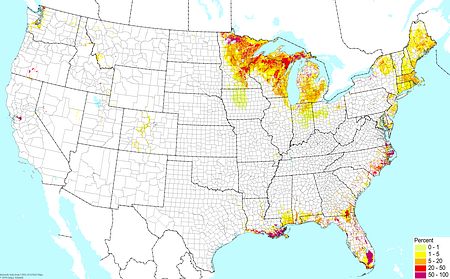
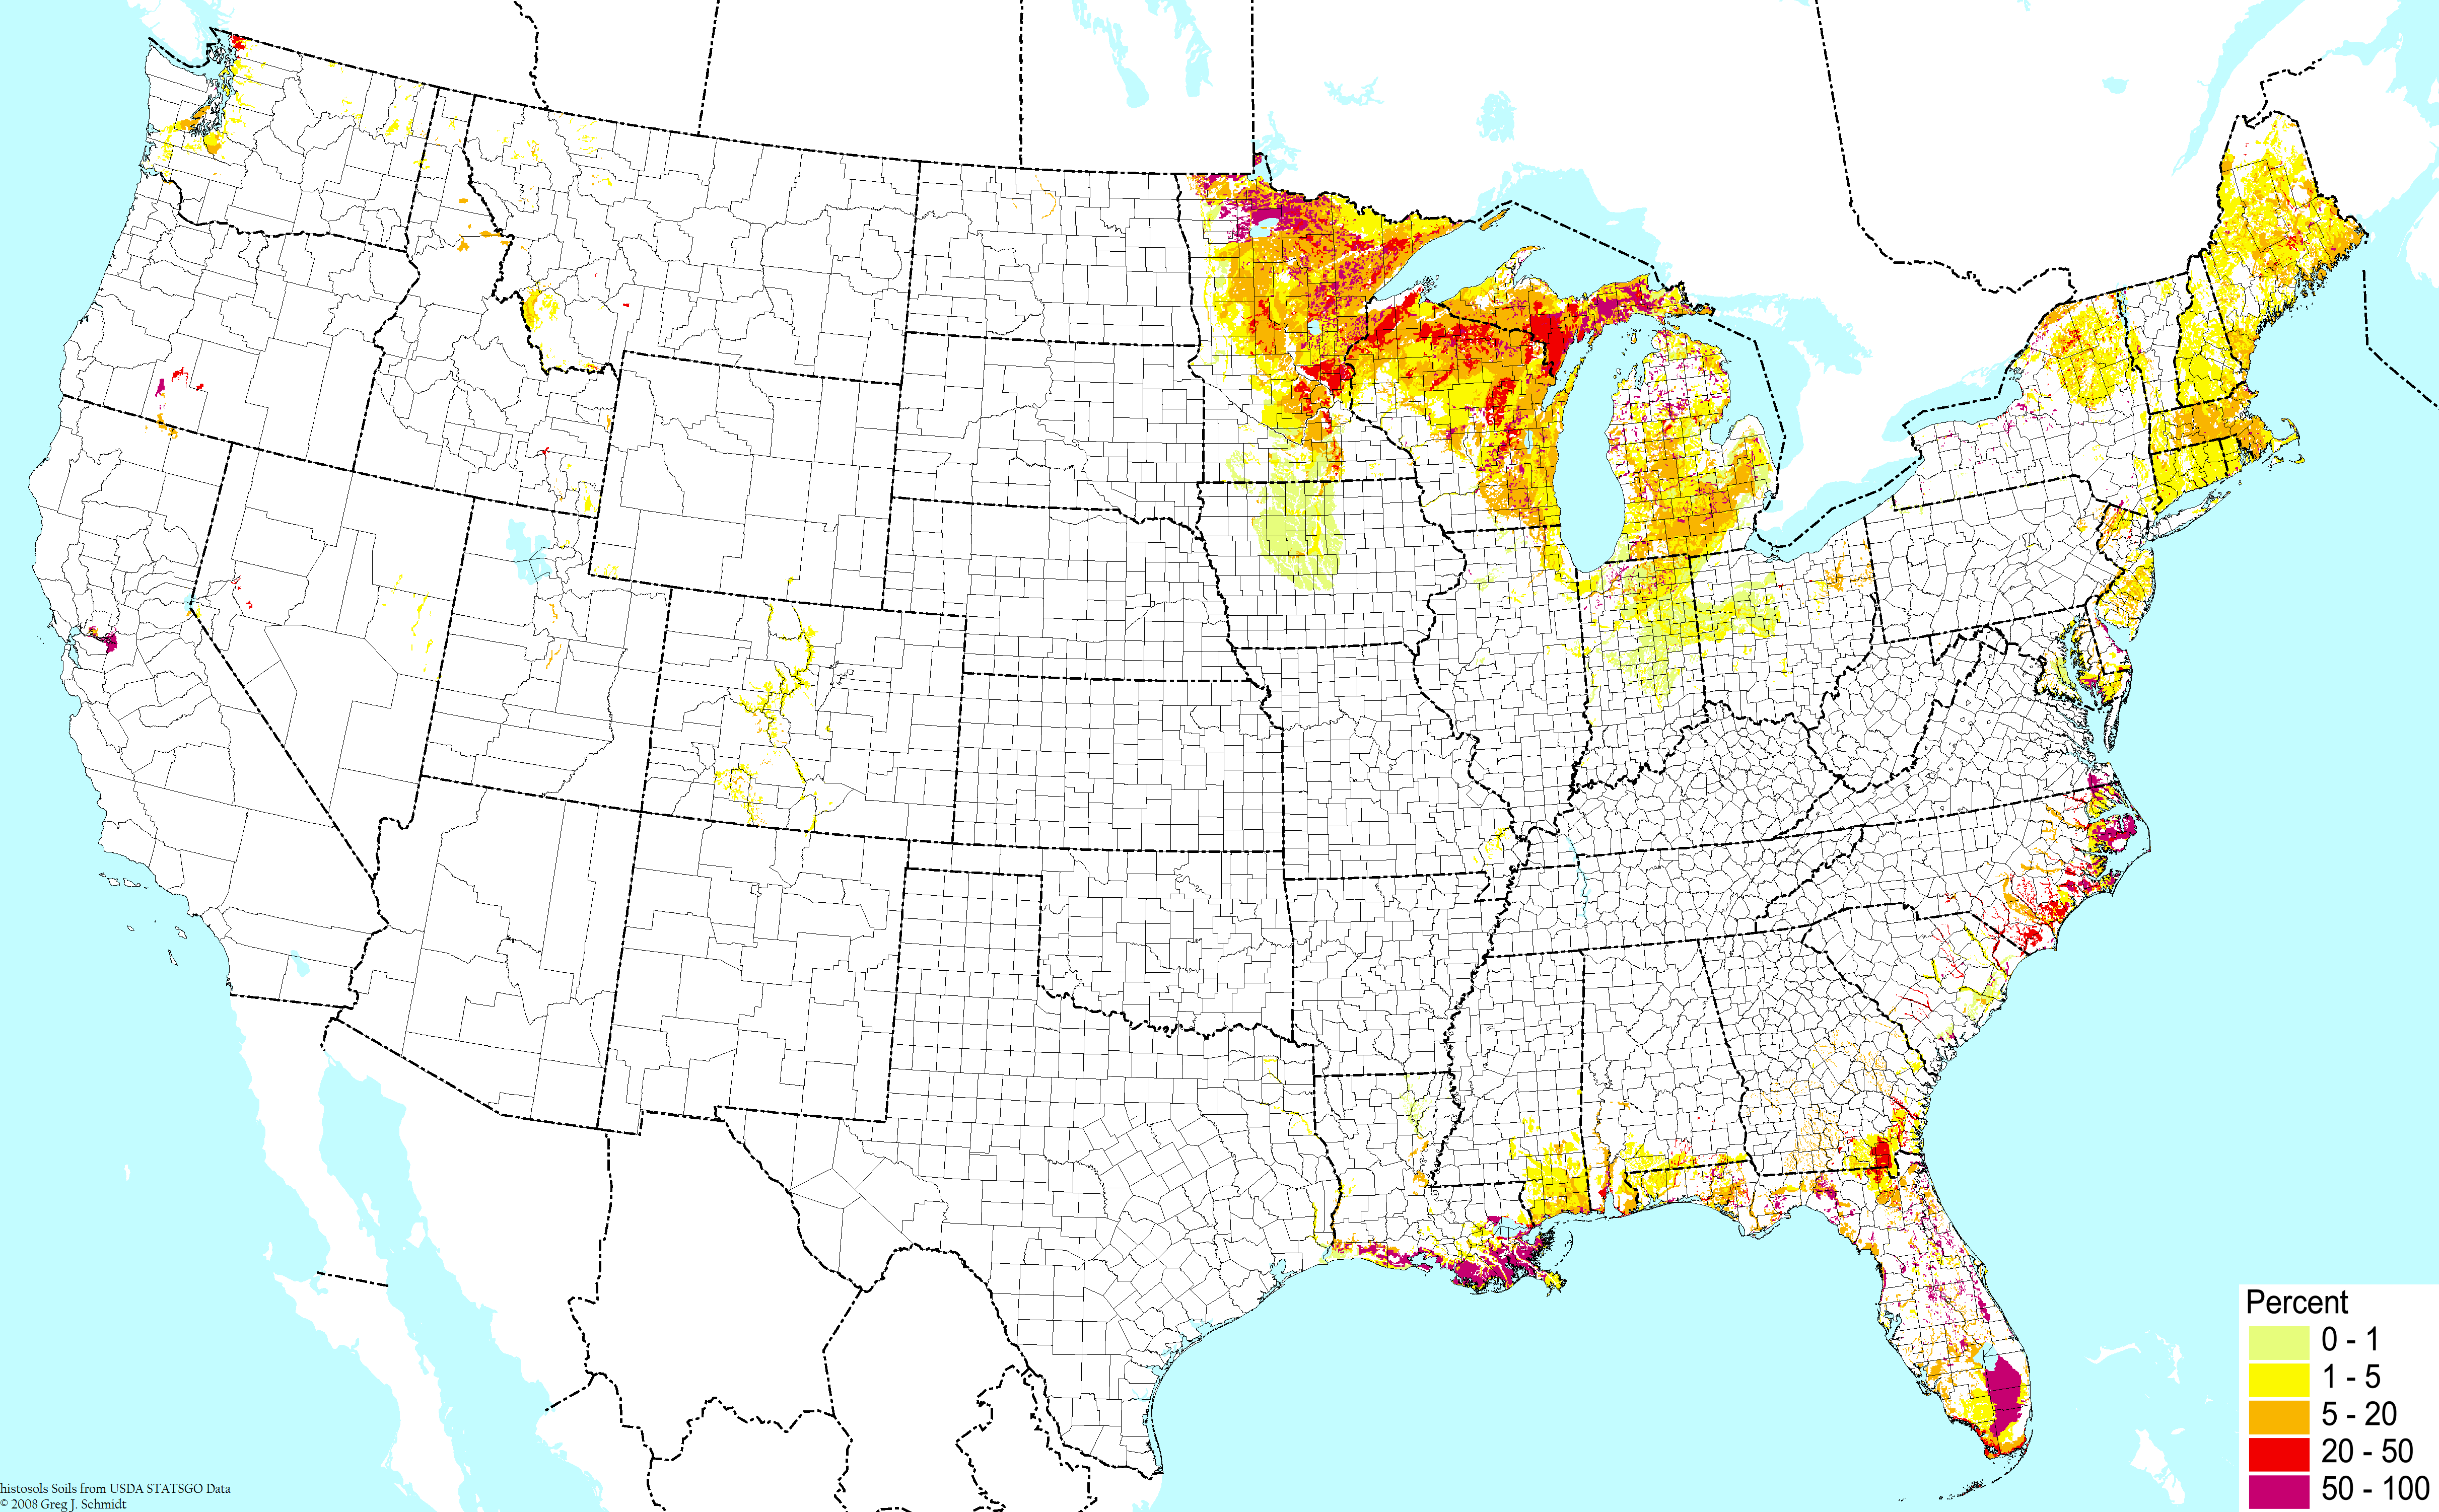
Organic soils (excluding uplands) ©BONAP
|
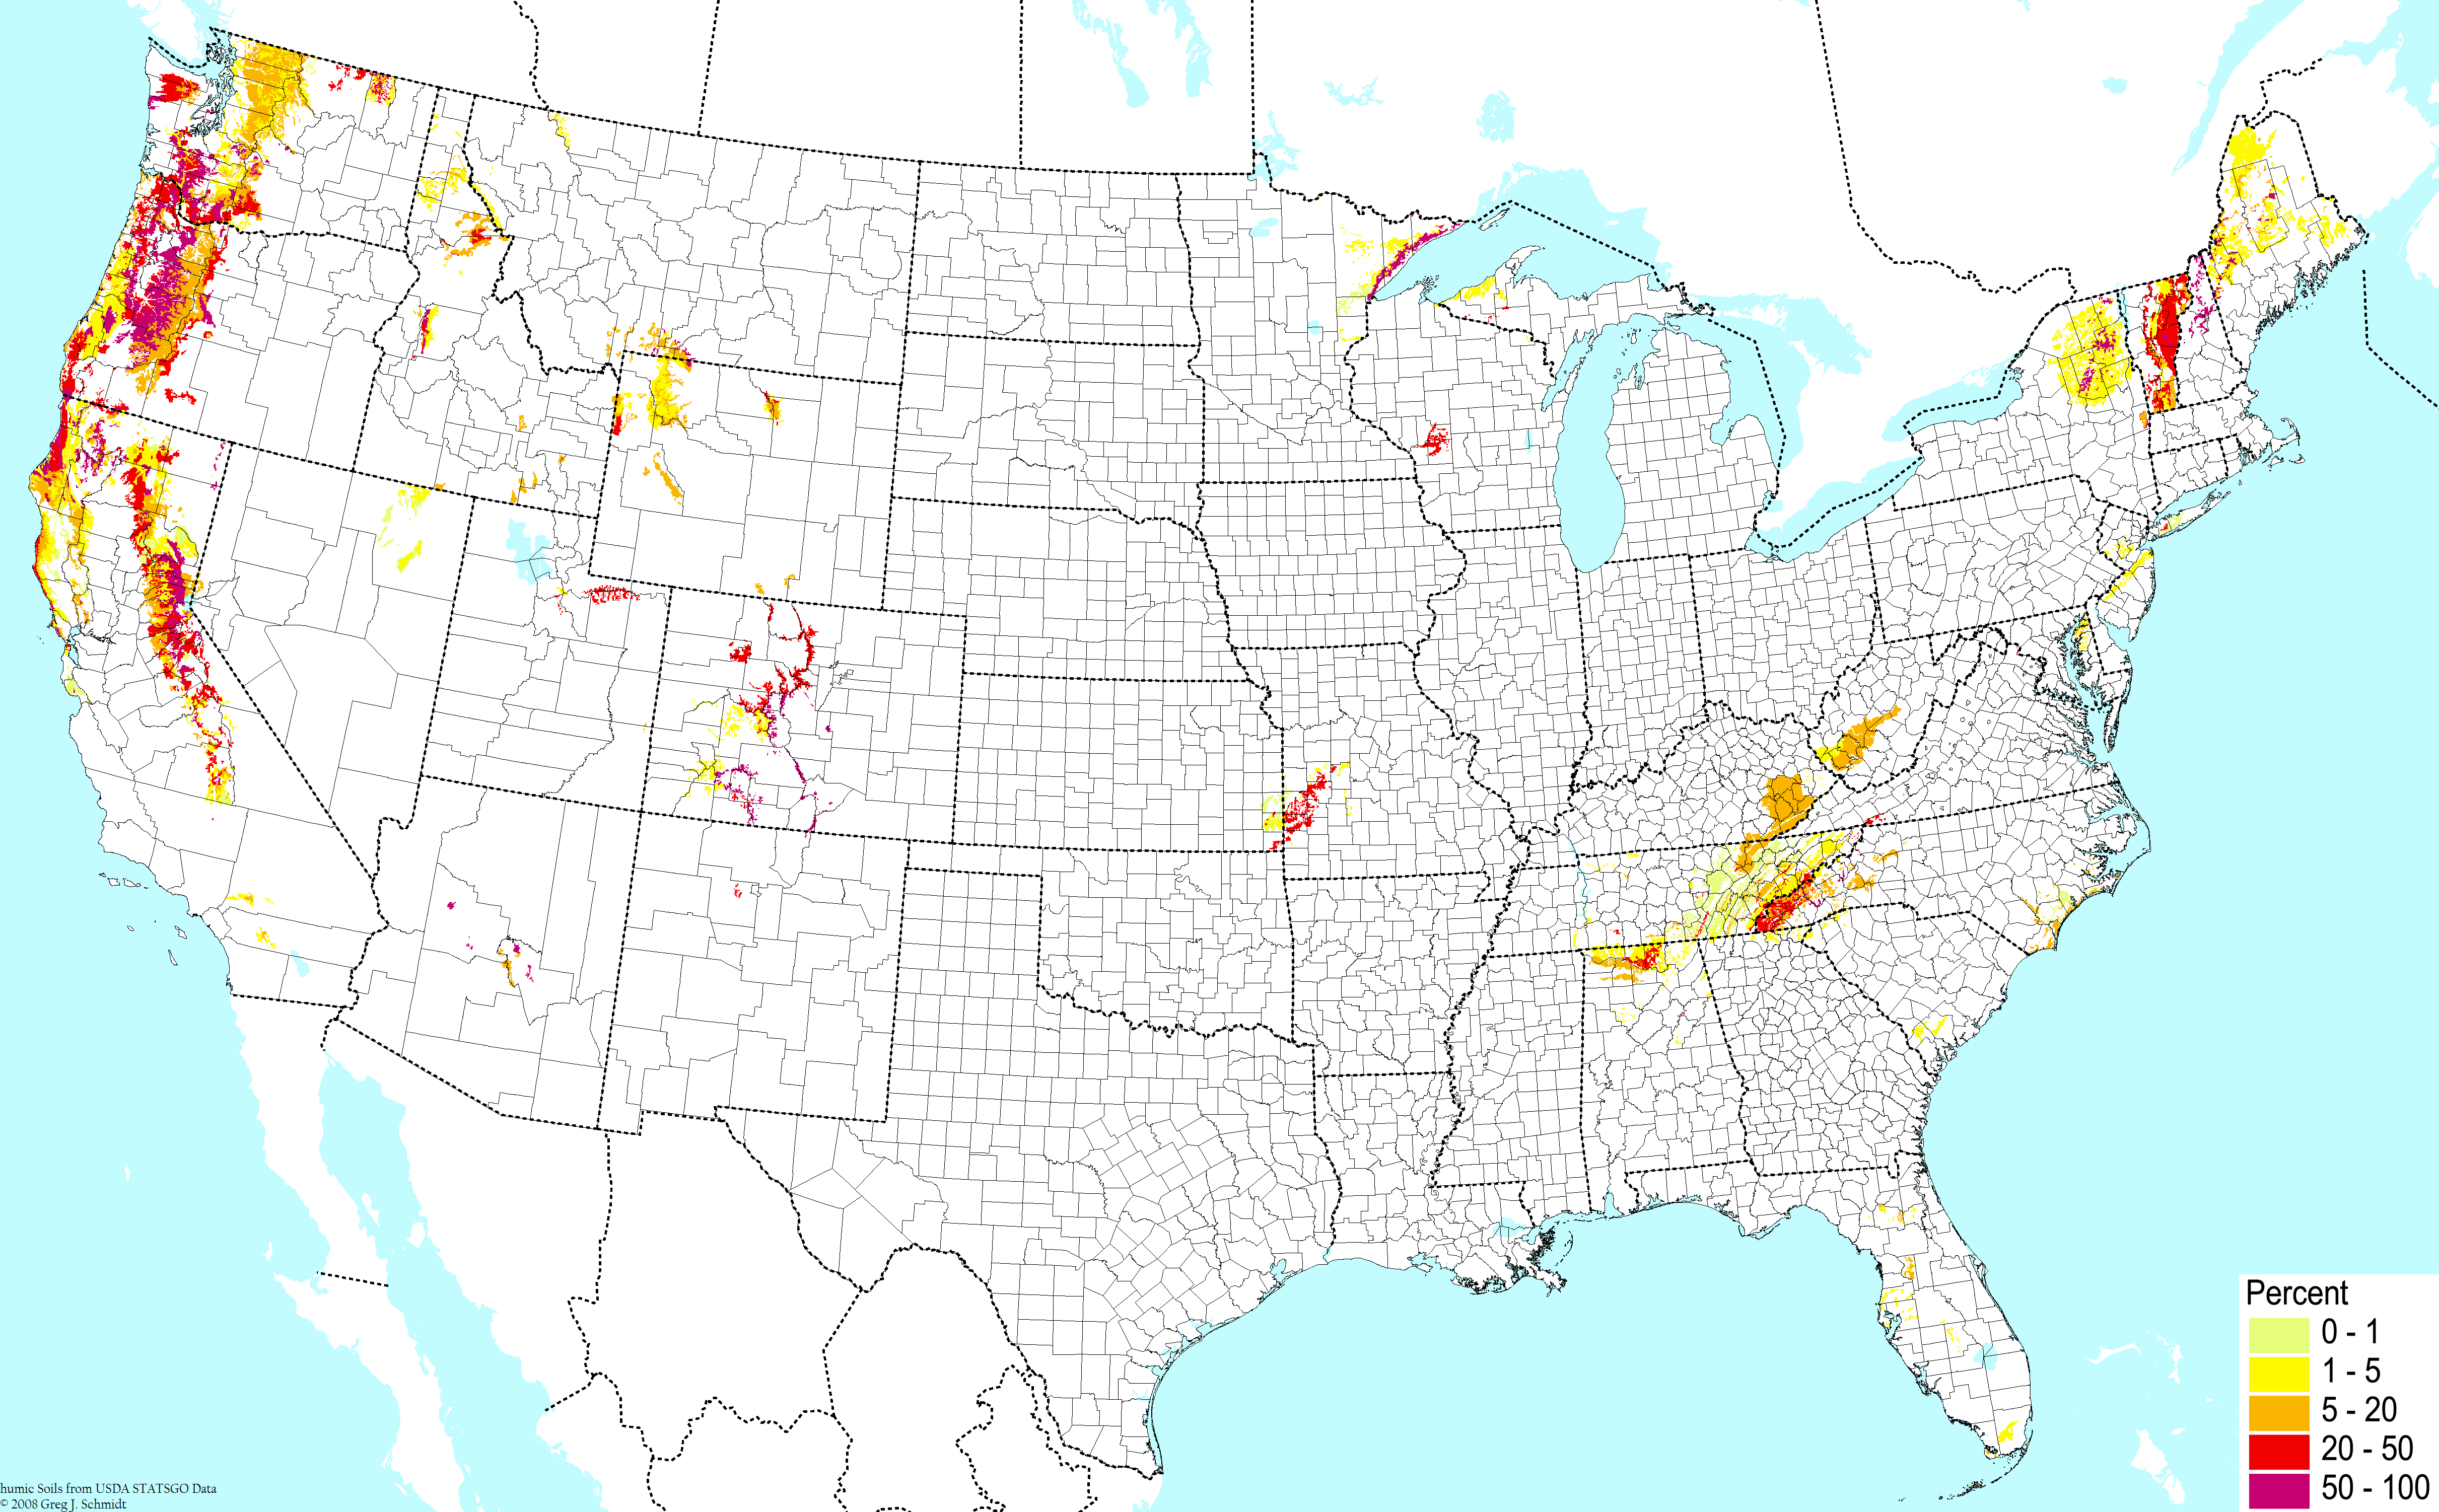
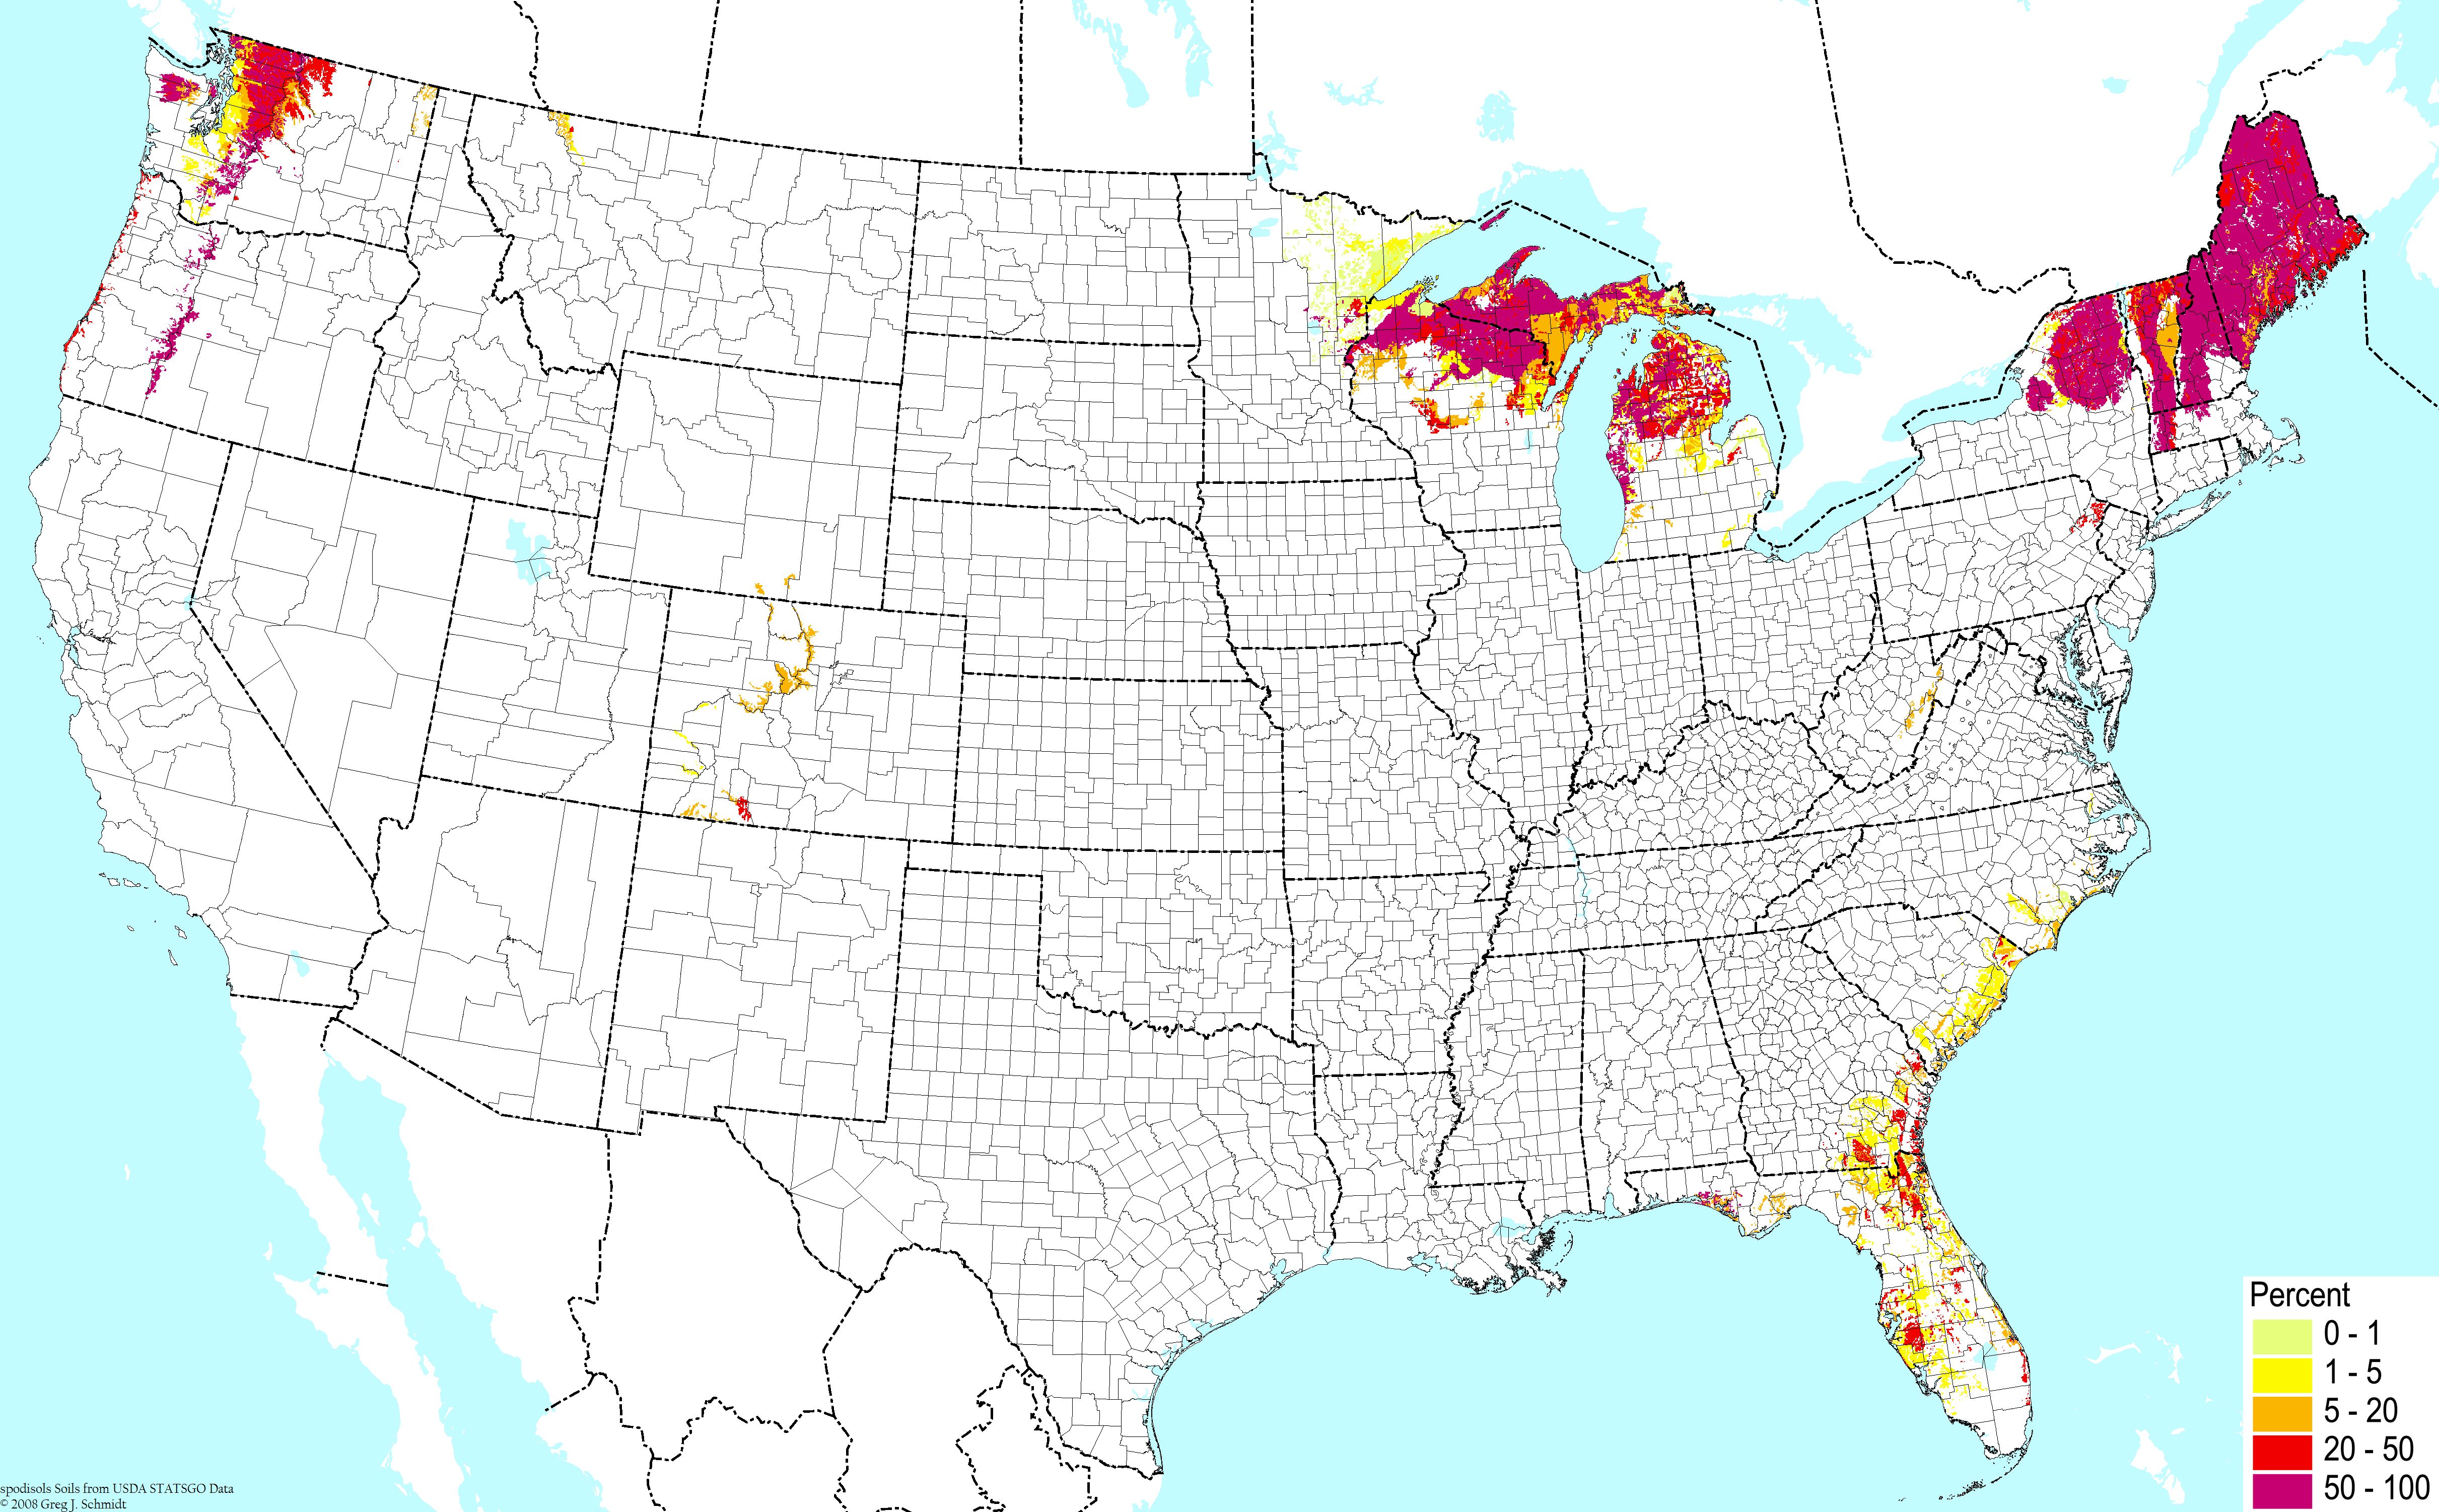
Mineral soils with high organic contect (excluding prairie soils) ©BONAP
| 
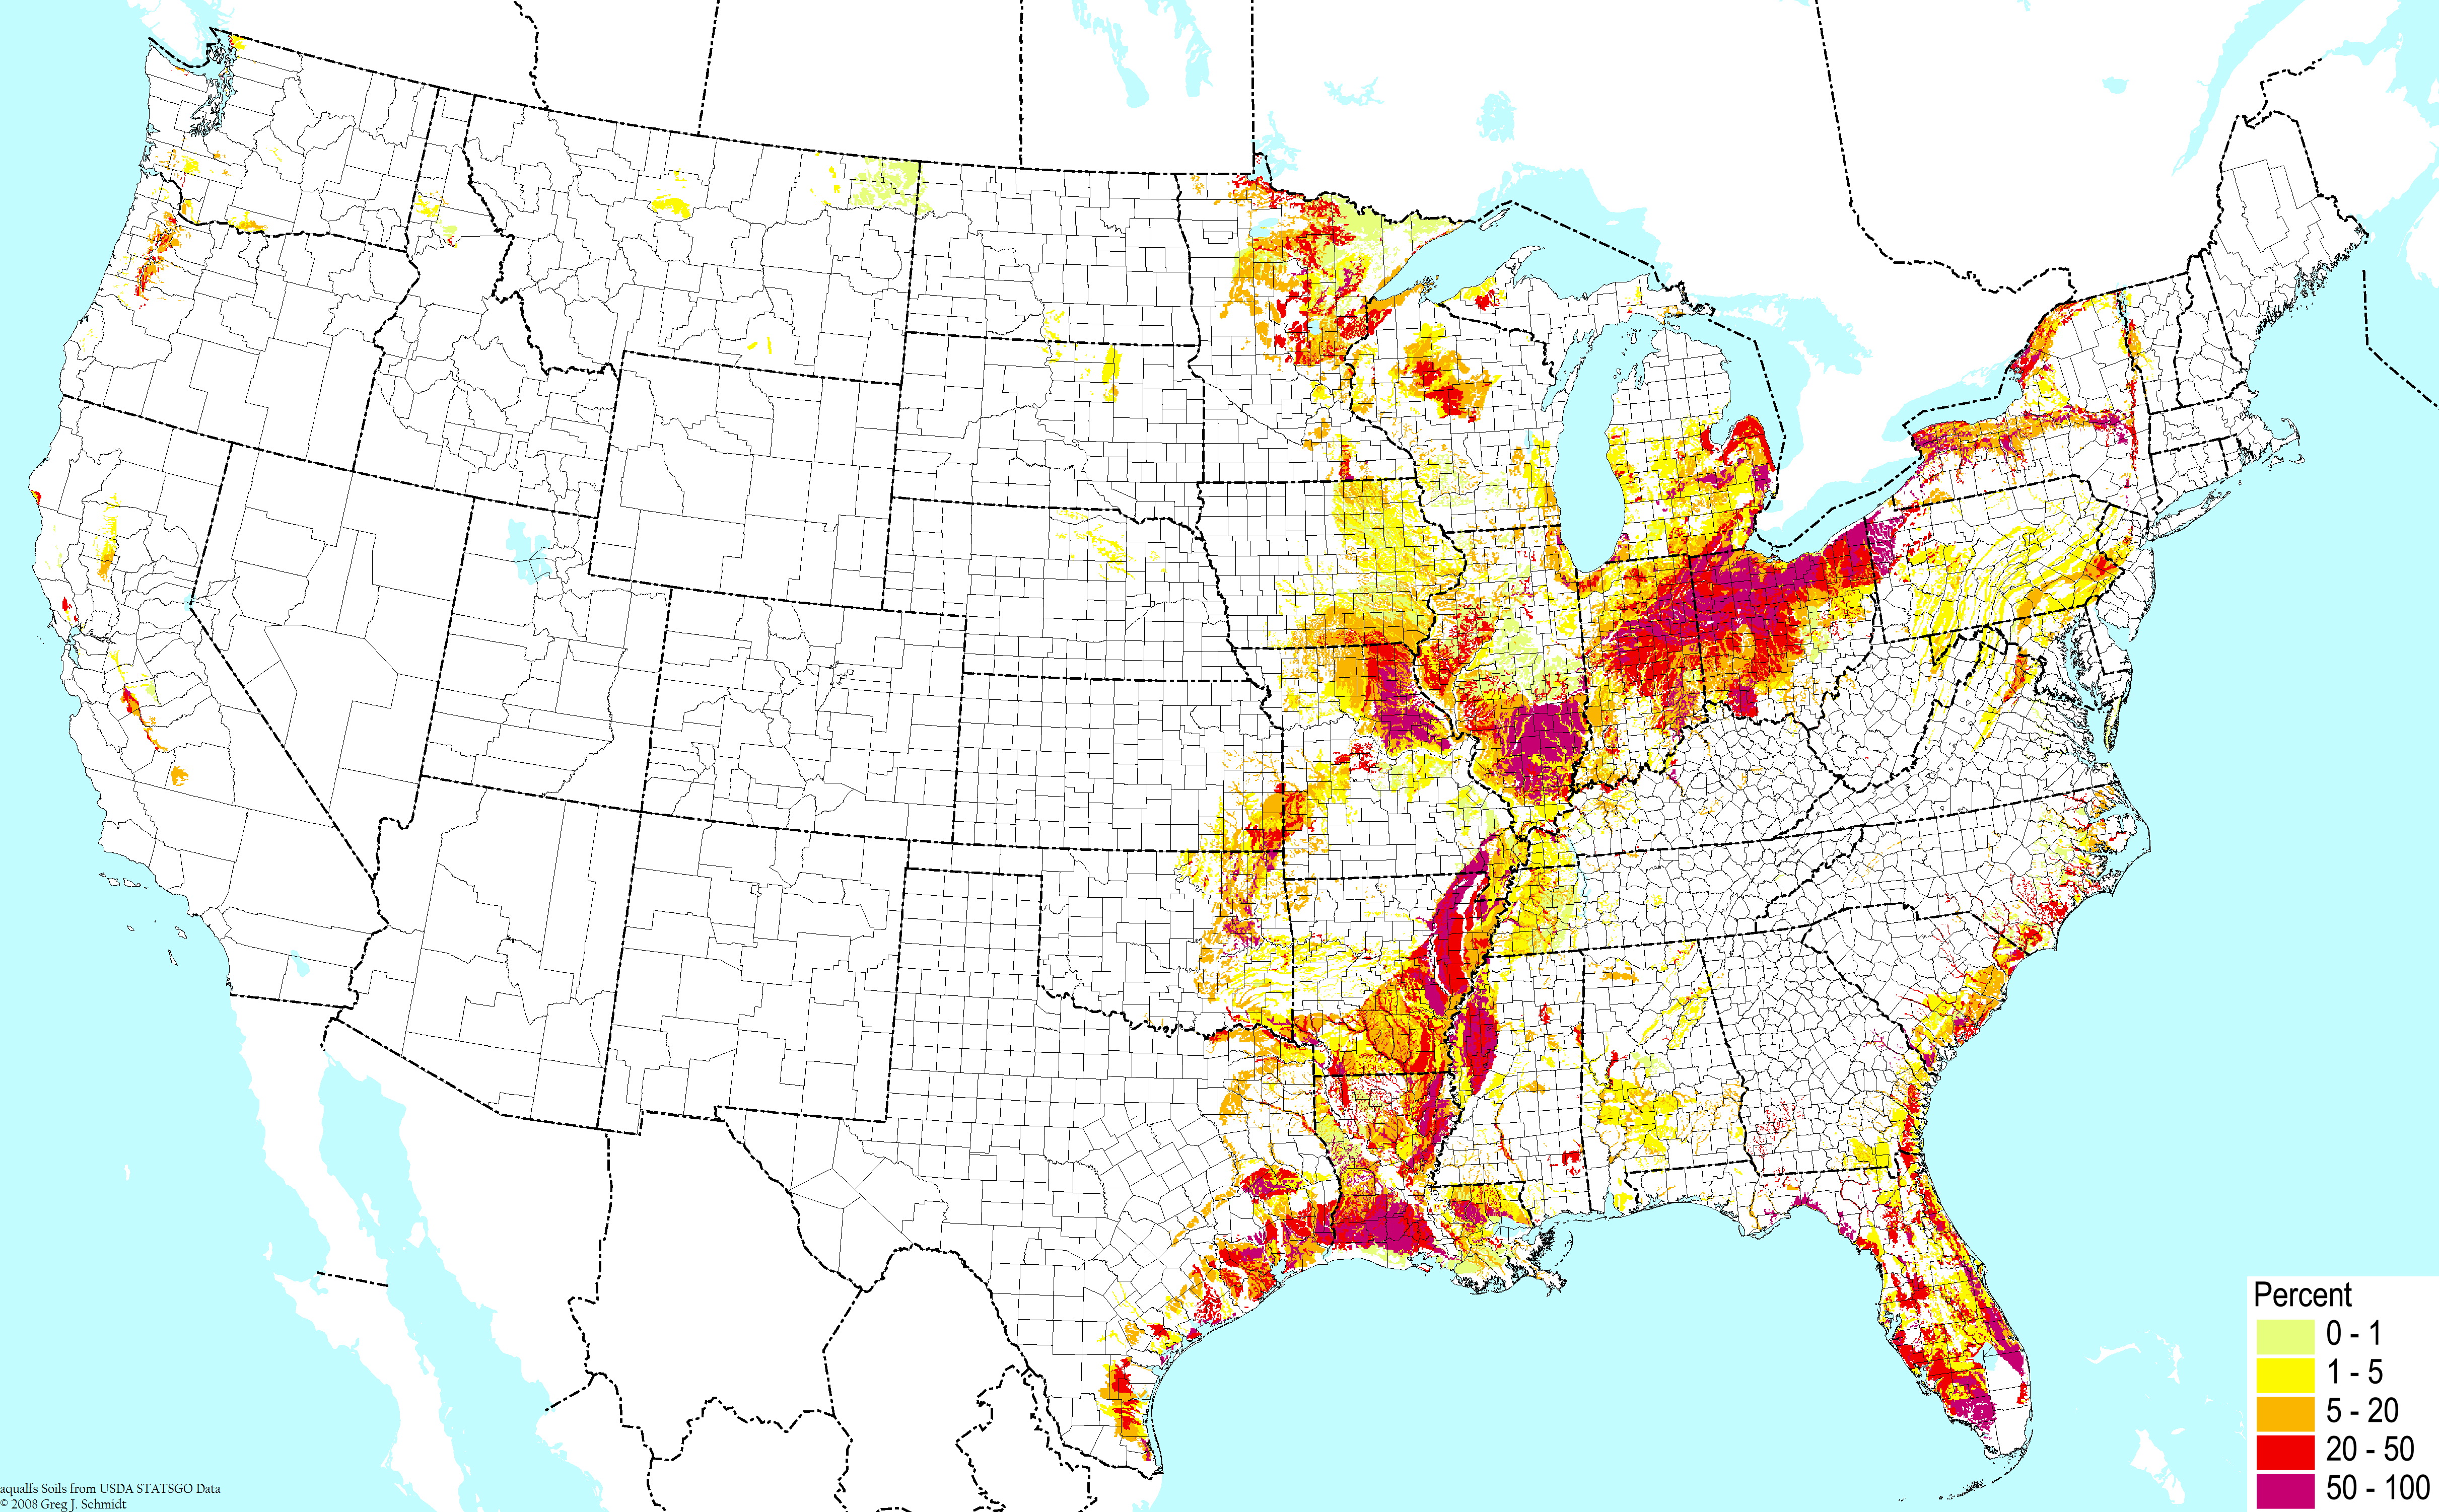
Mineral soils with high organic content ©BONAP | 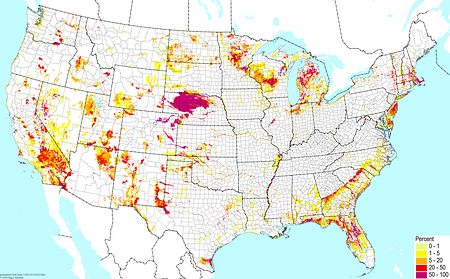
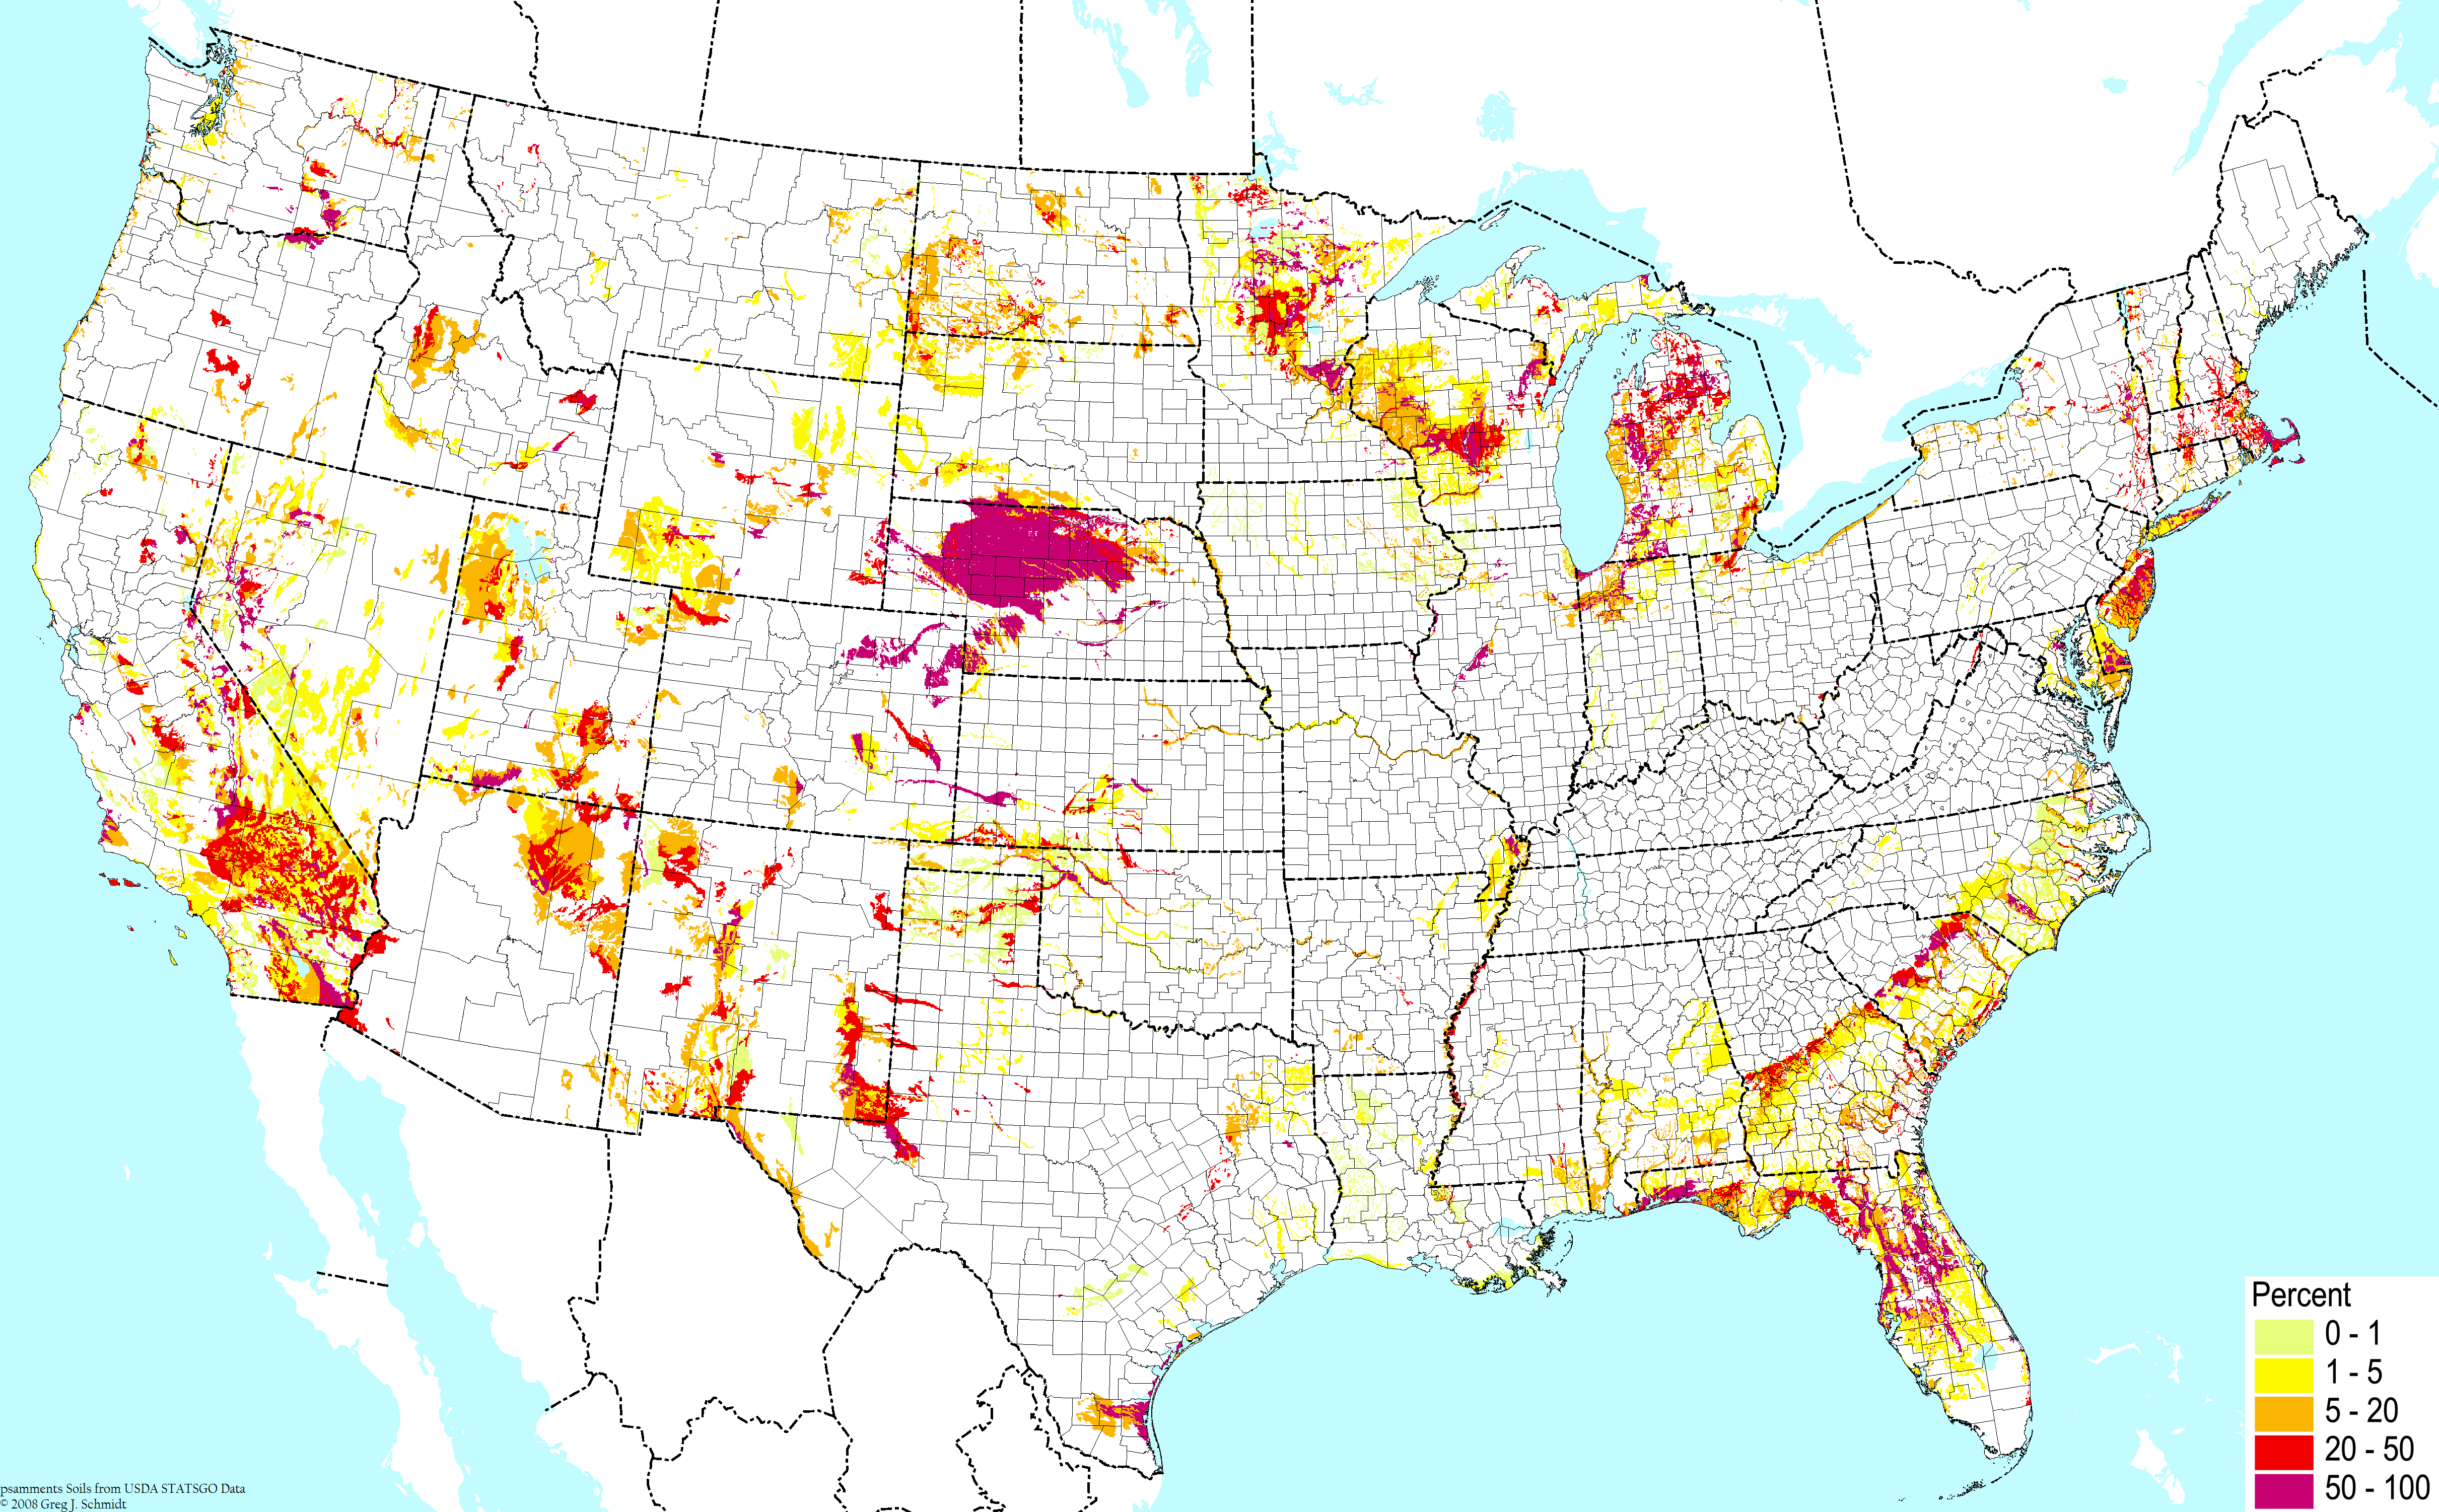
Deep sandy soil ©BONAP |
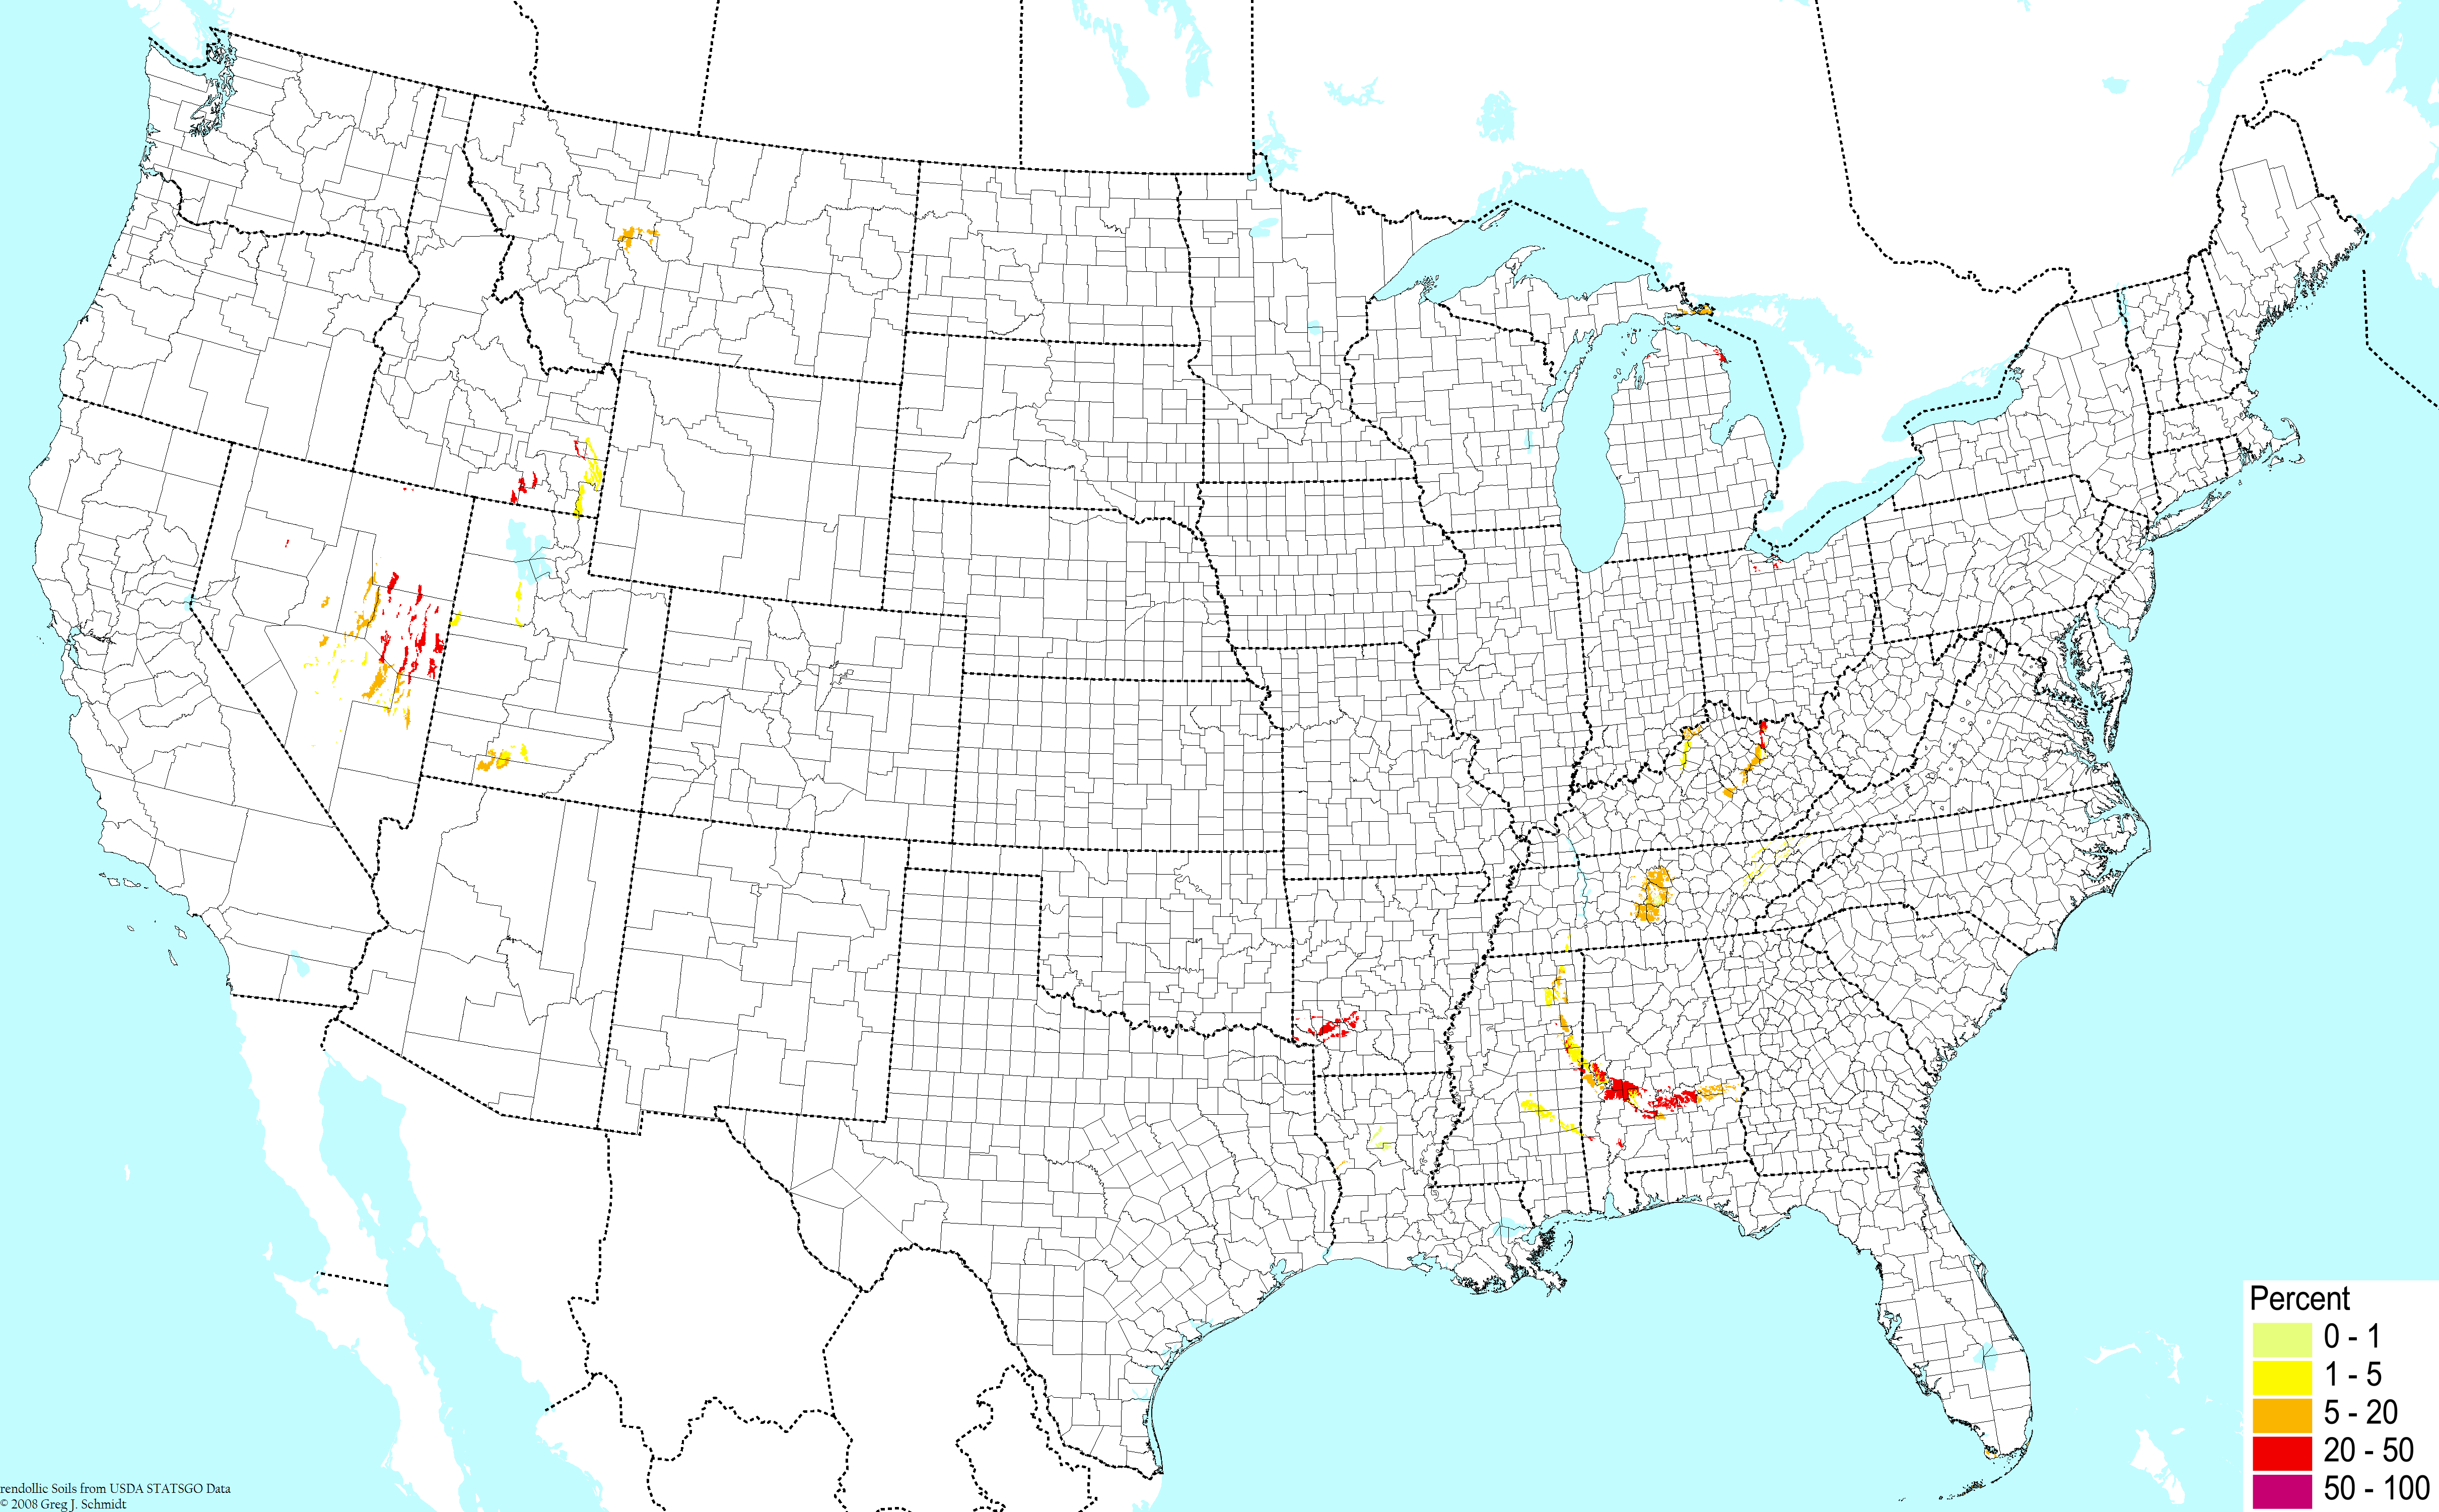
Limestone praire soils ©BONAP | 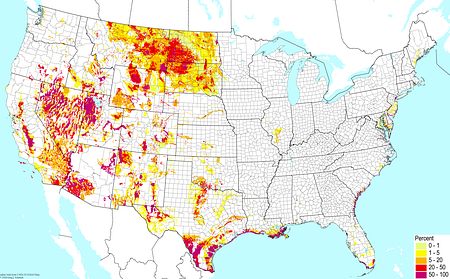
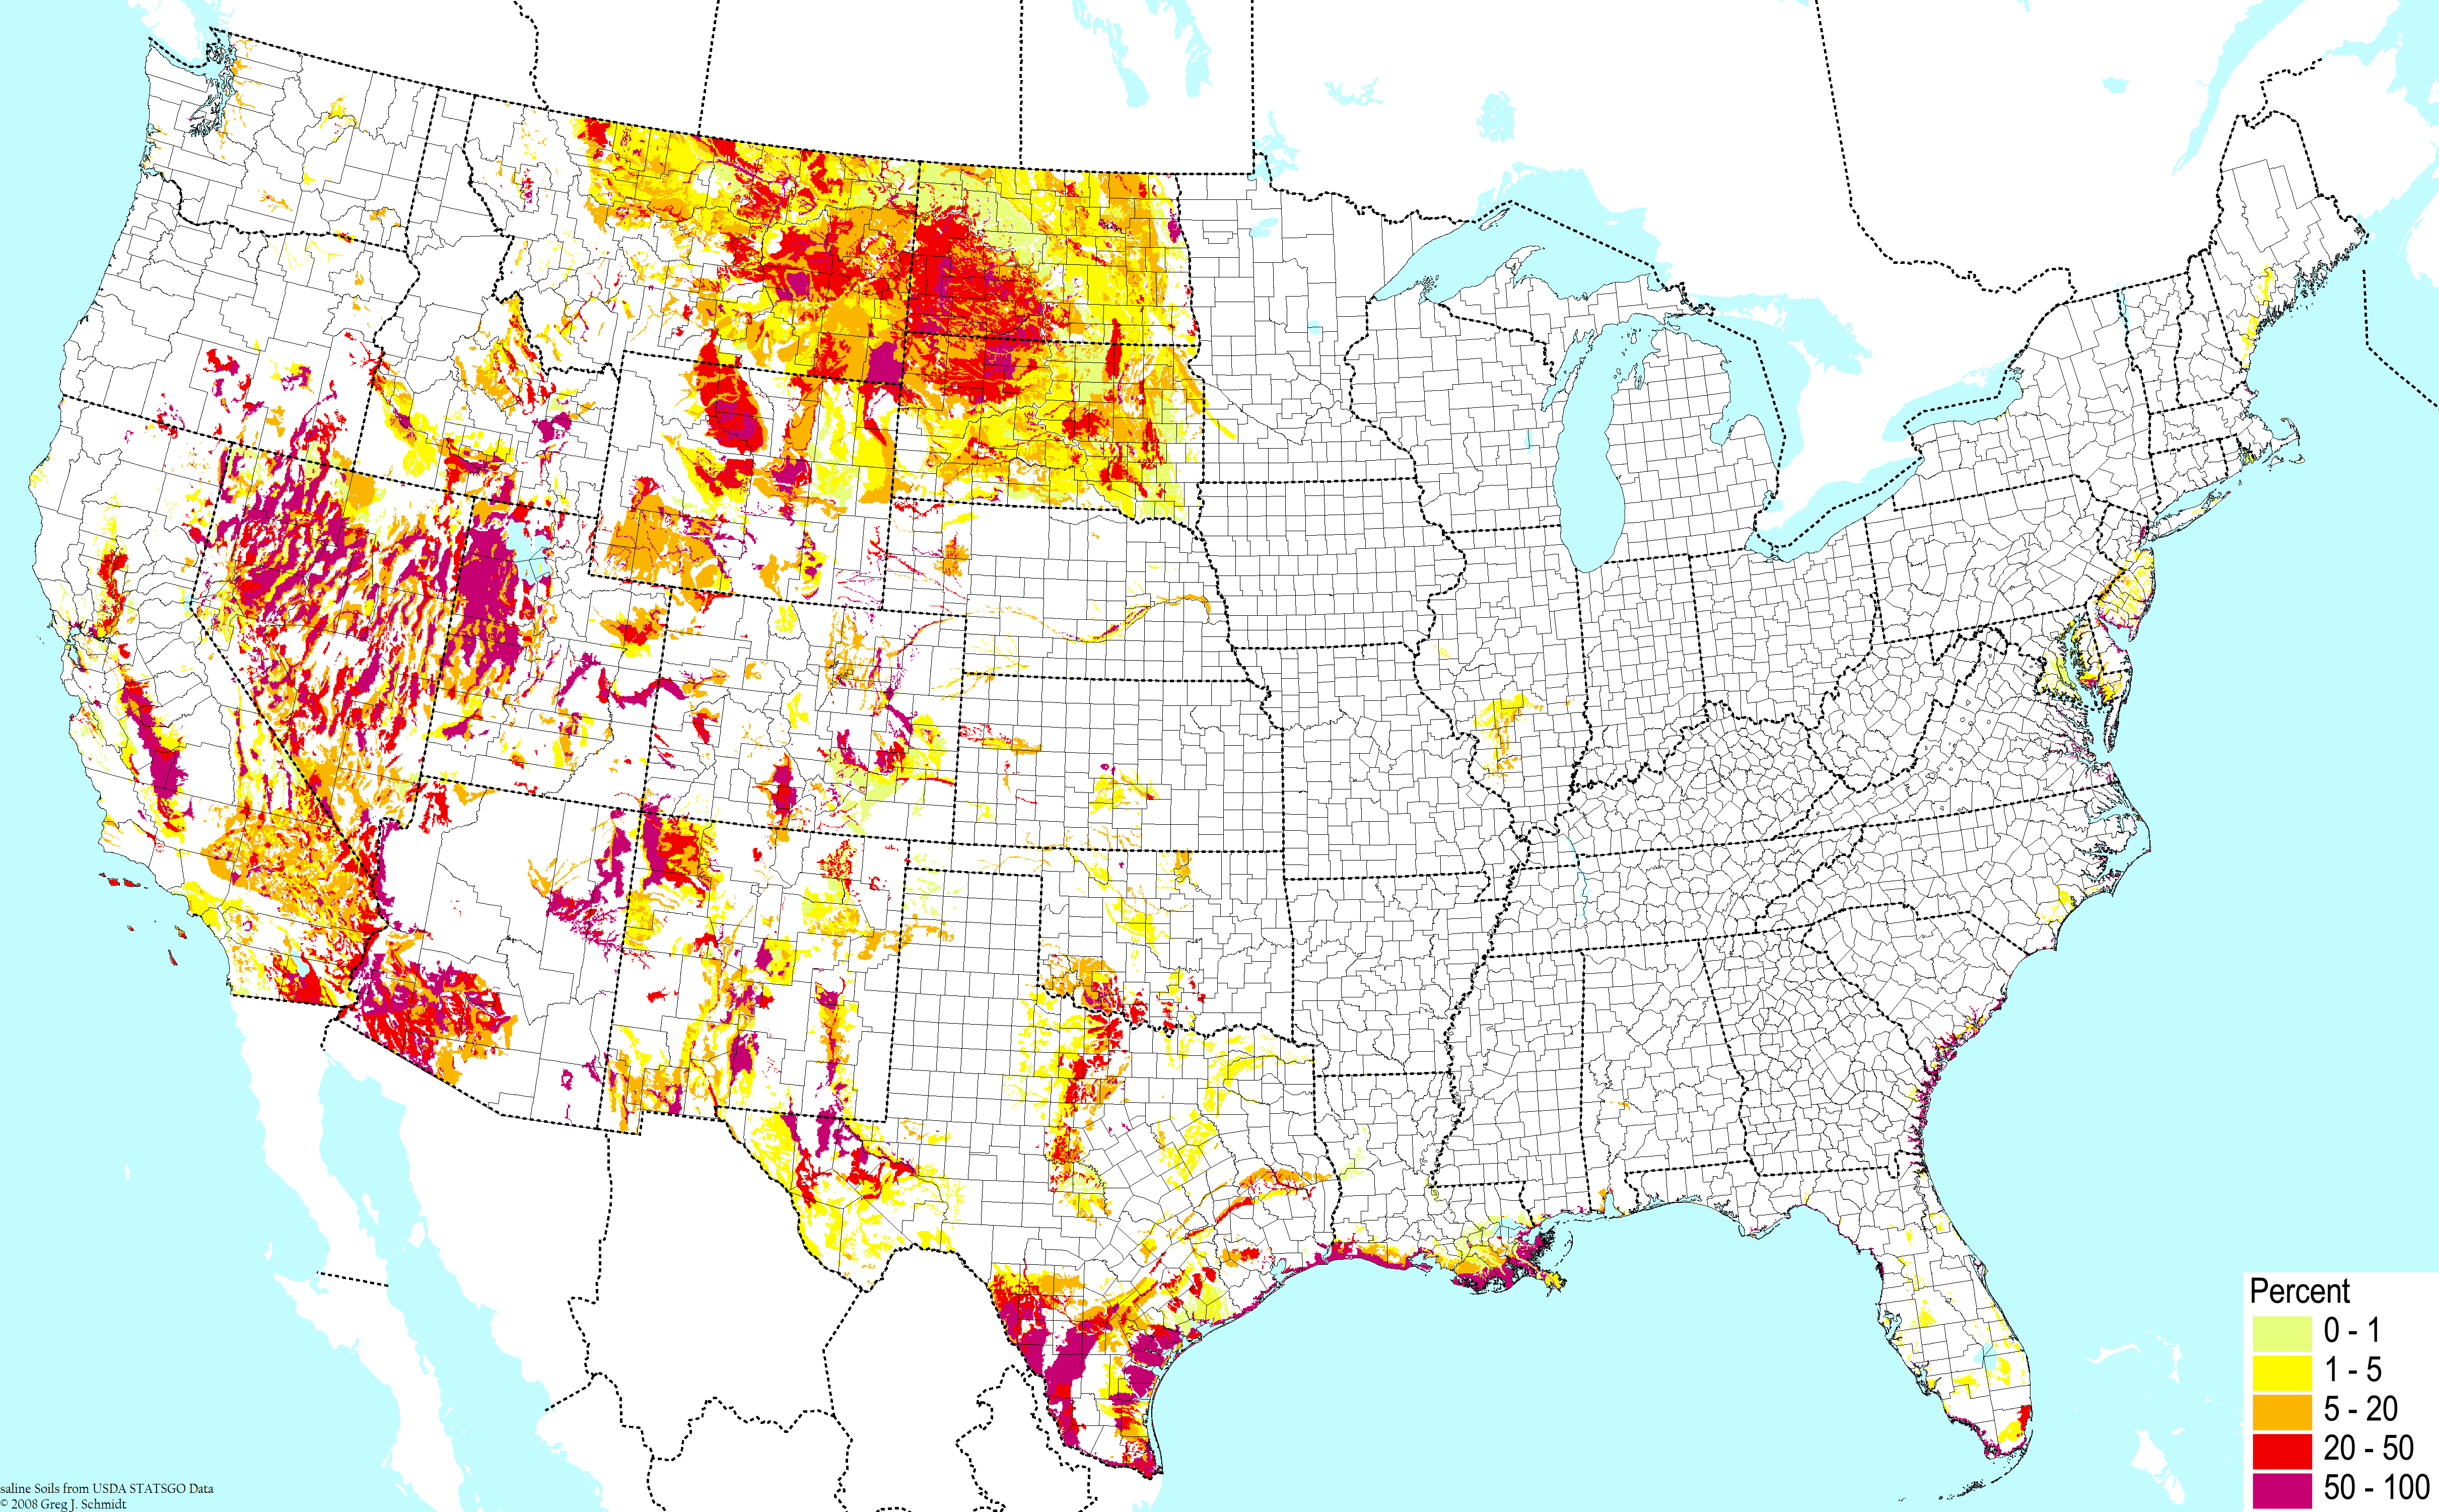
Salty soils (high electric conductivity) ©BONAP | 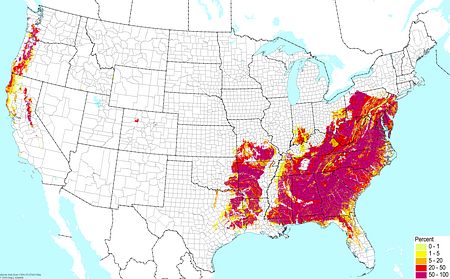
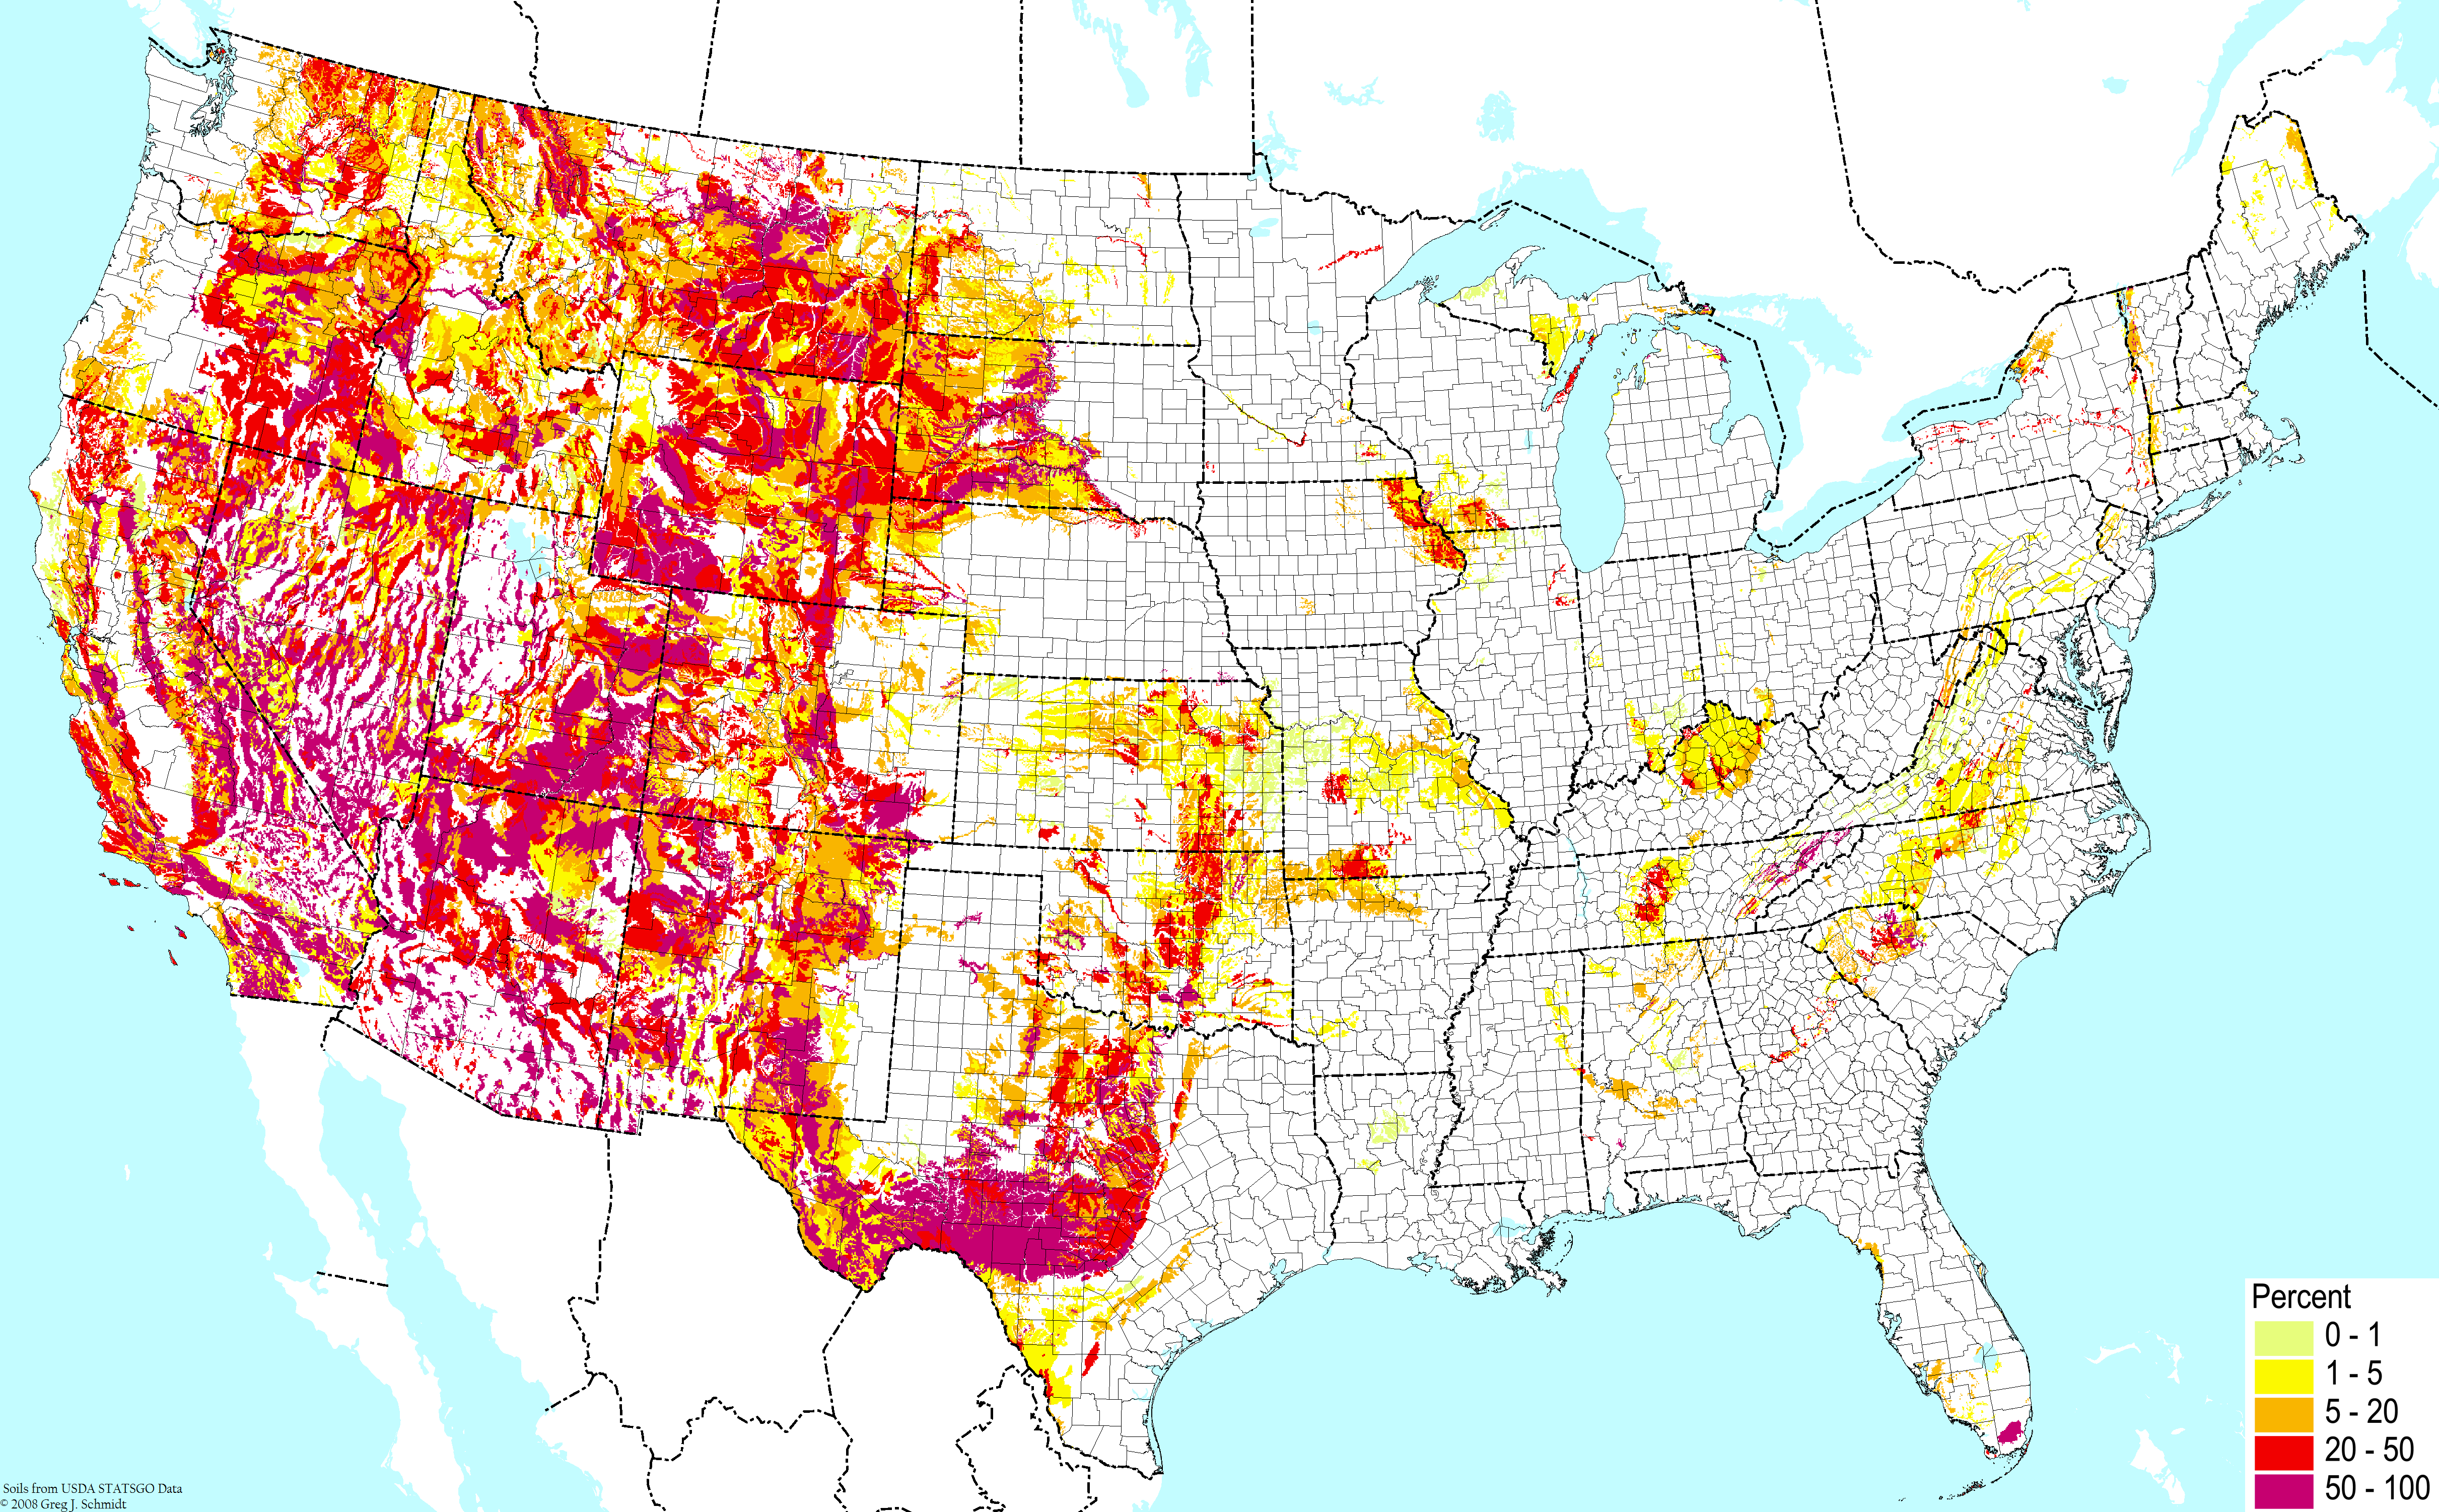
Soils with nutrient-poor clays (excluding wetlands) ©BONAP
|
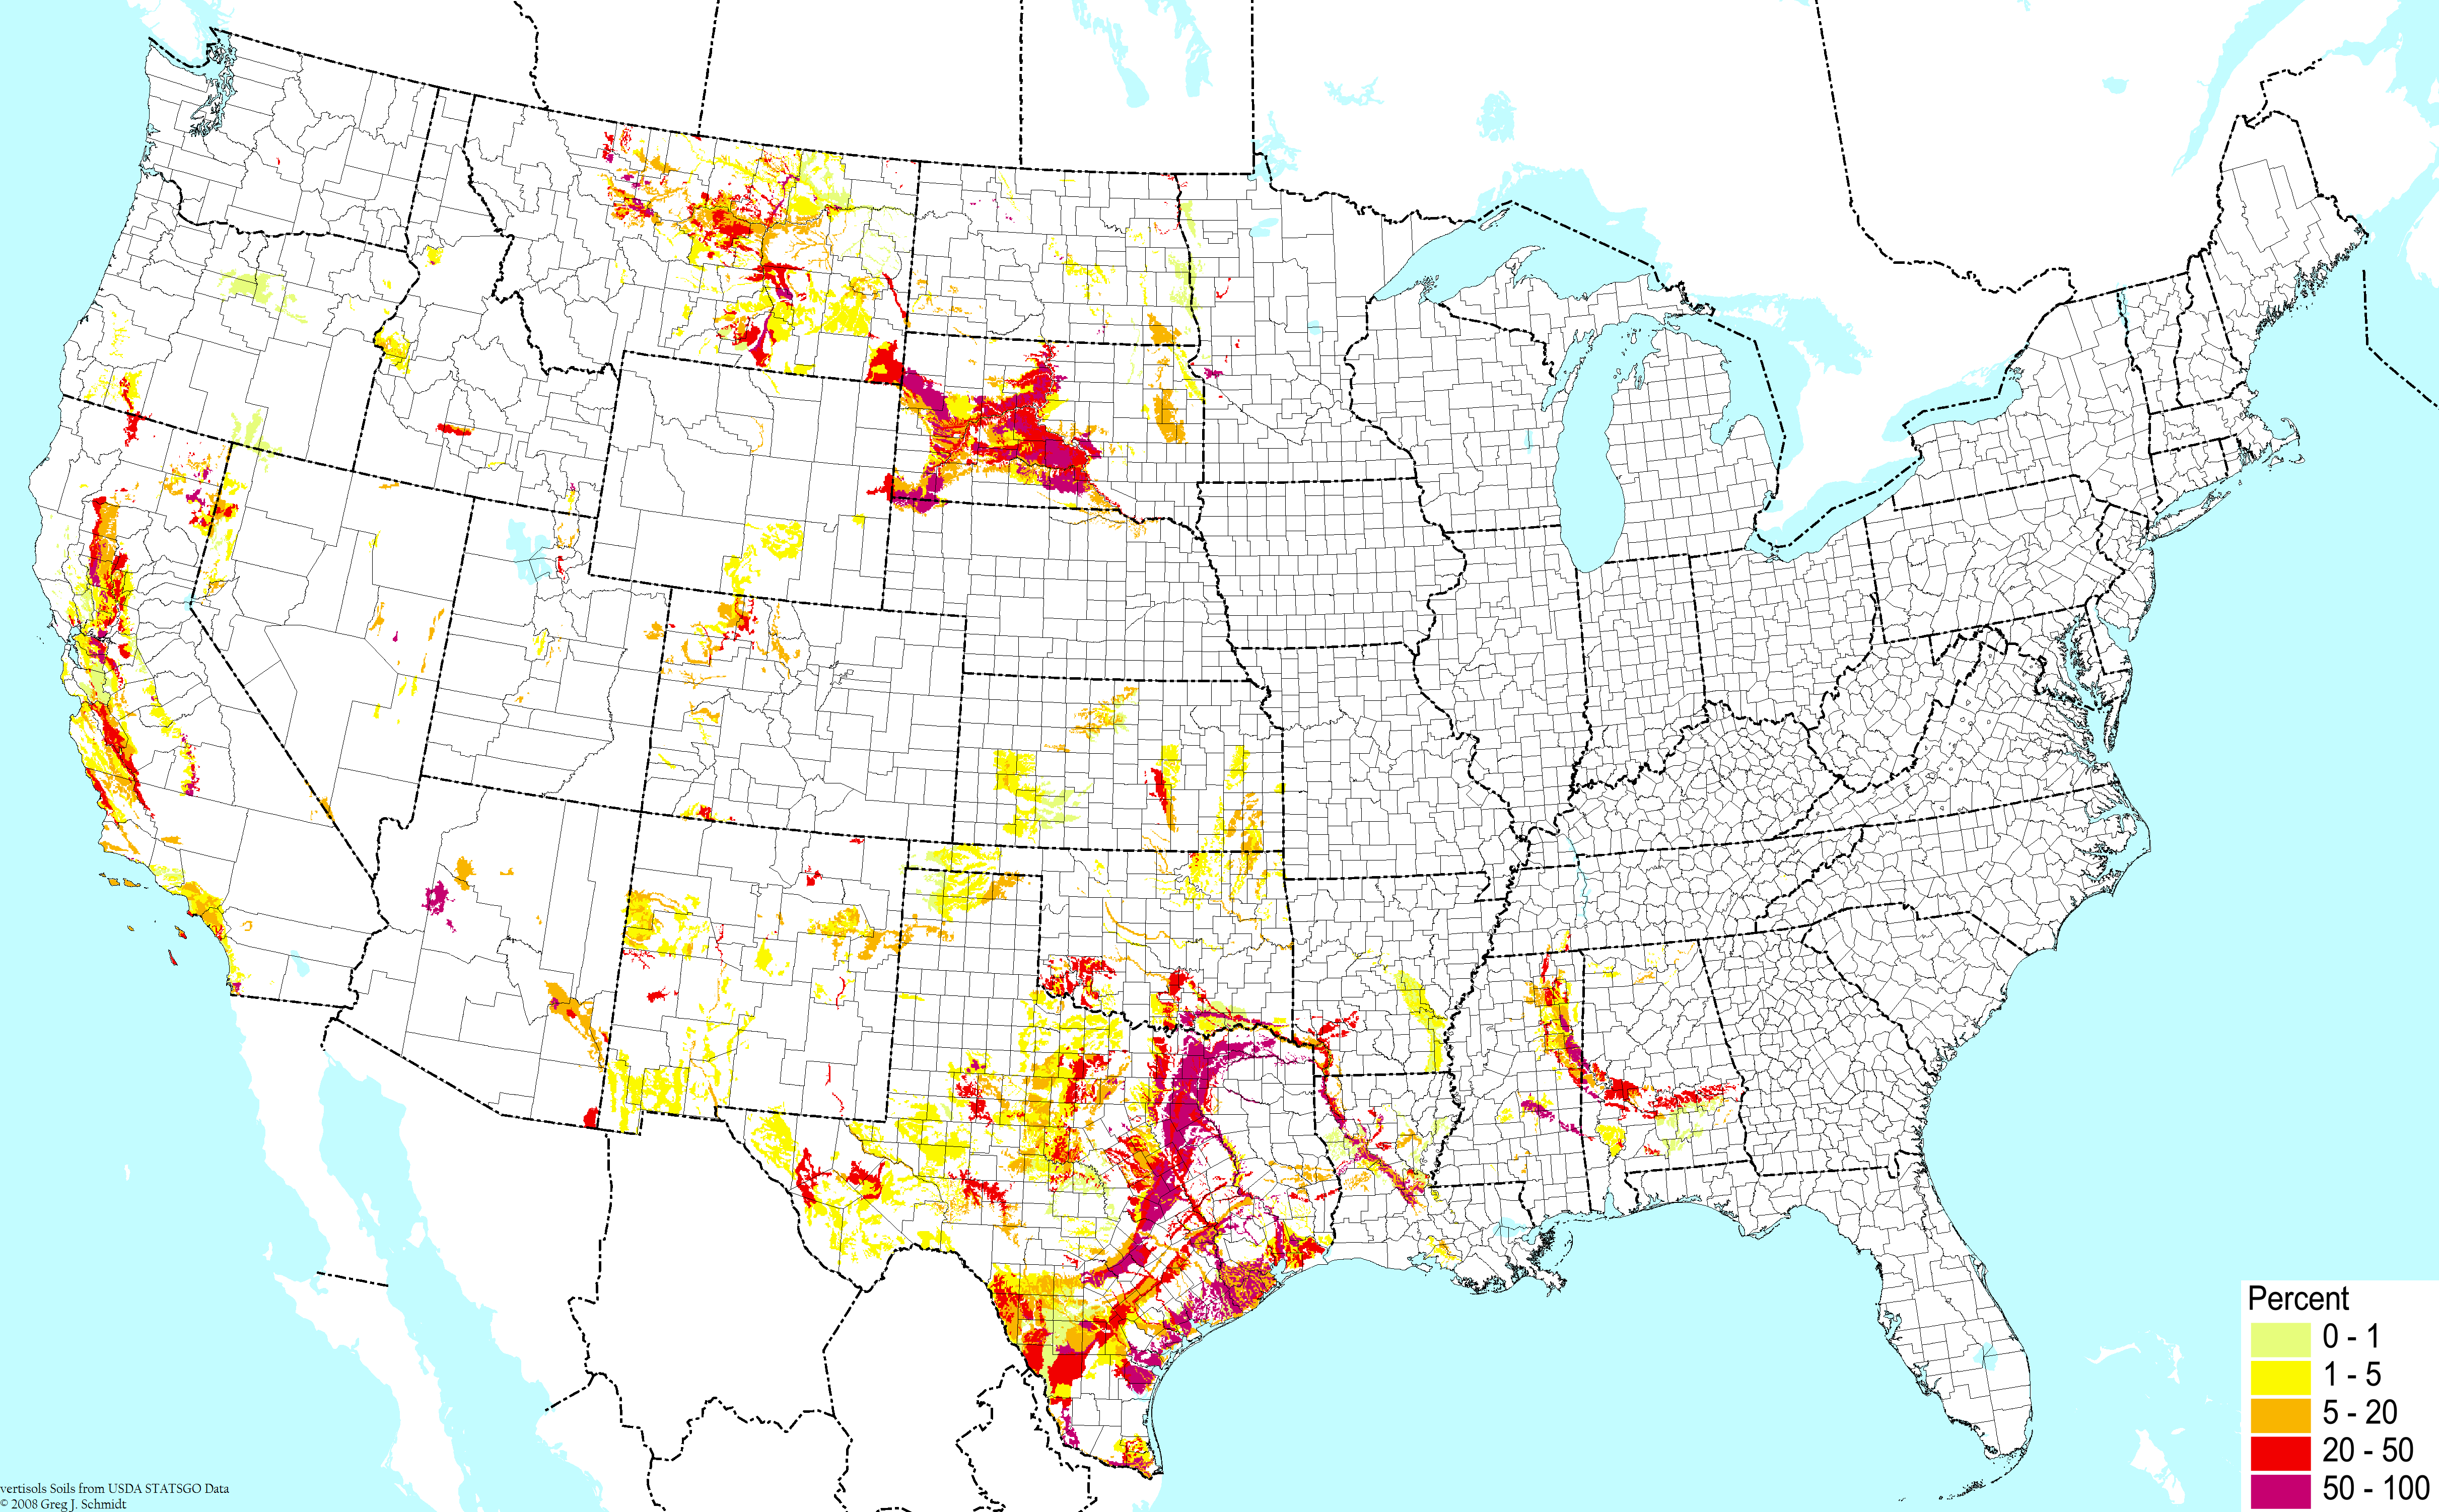
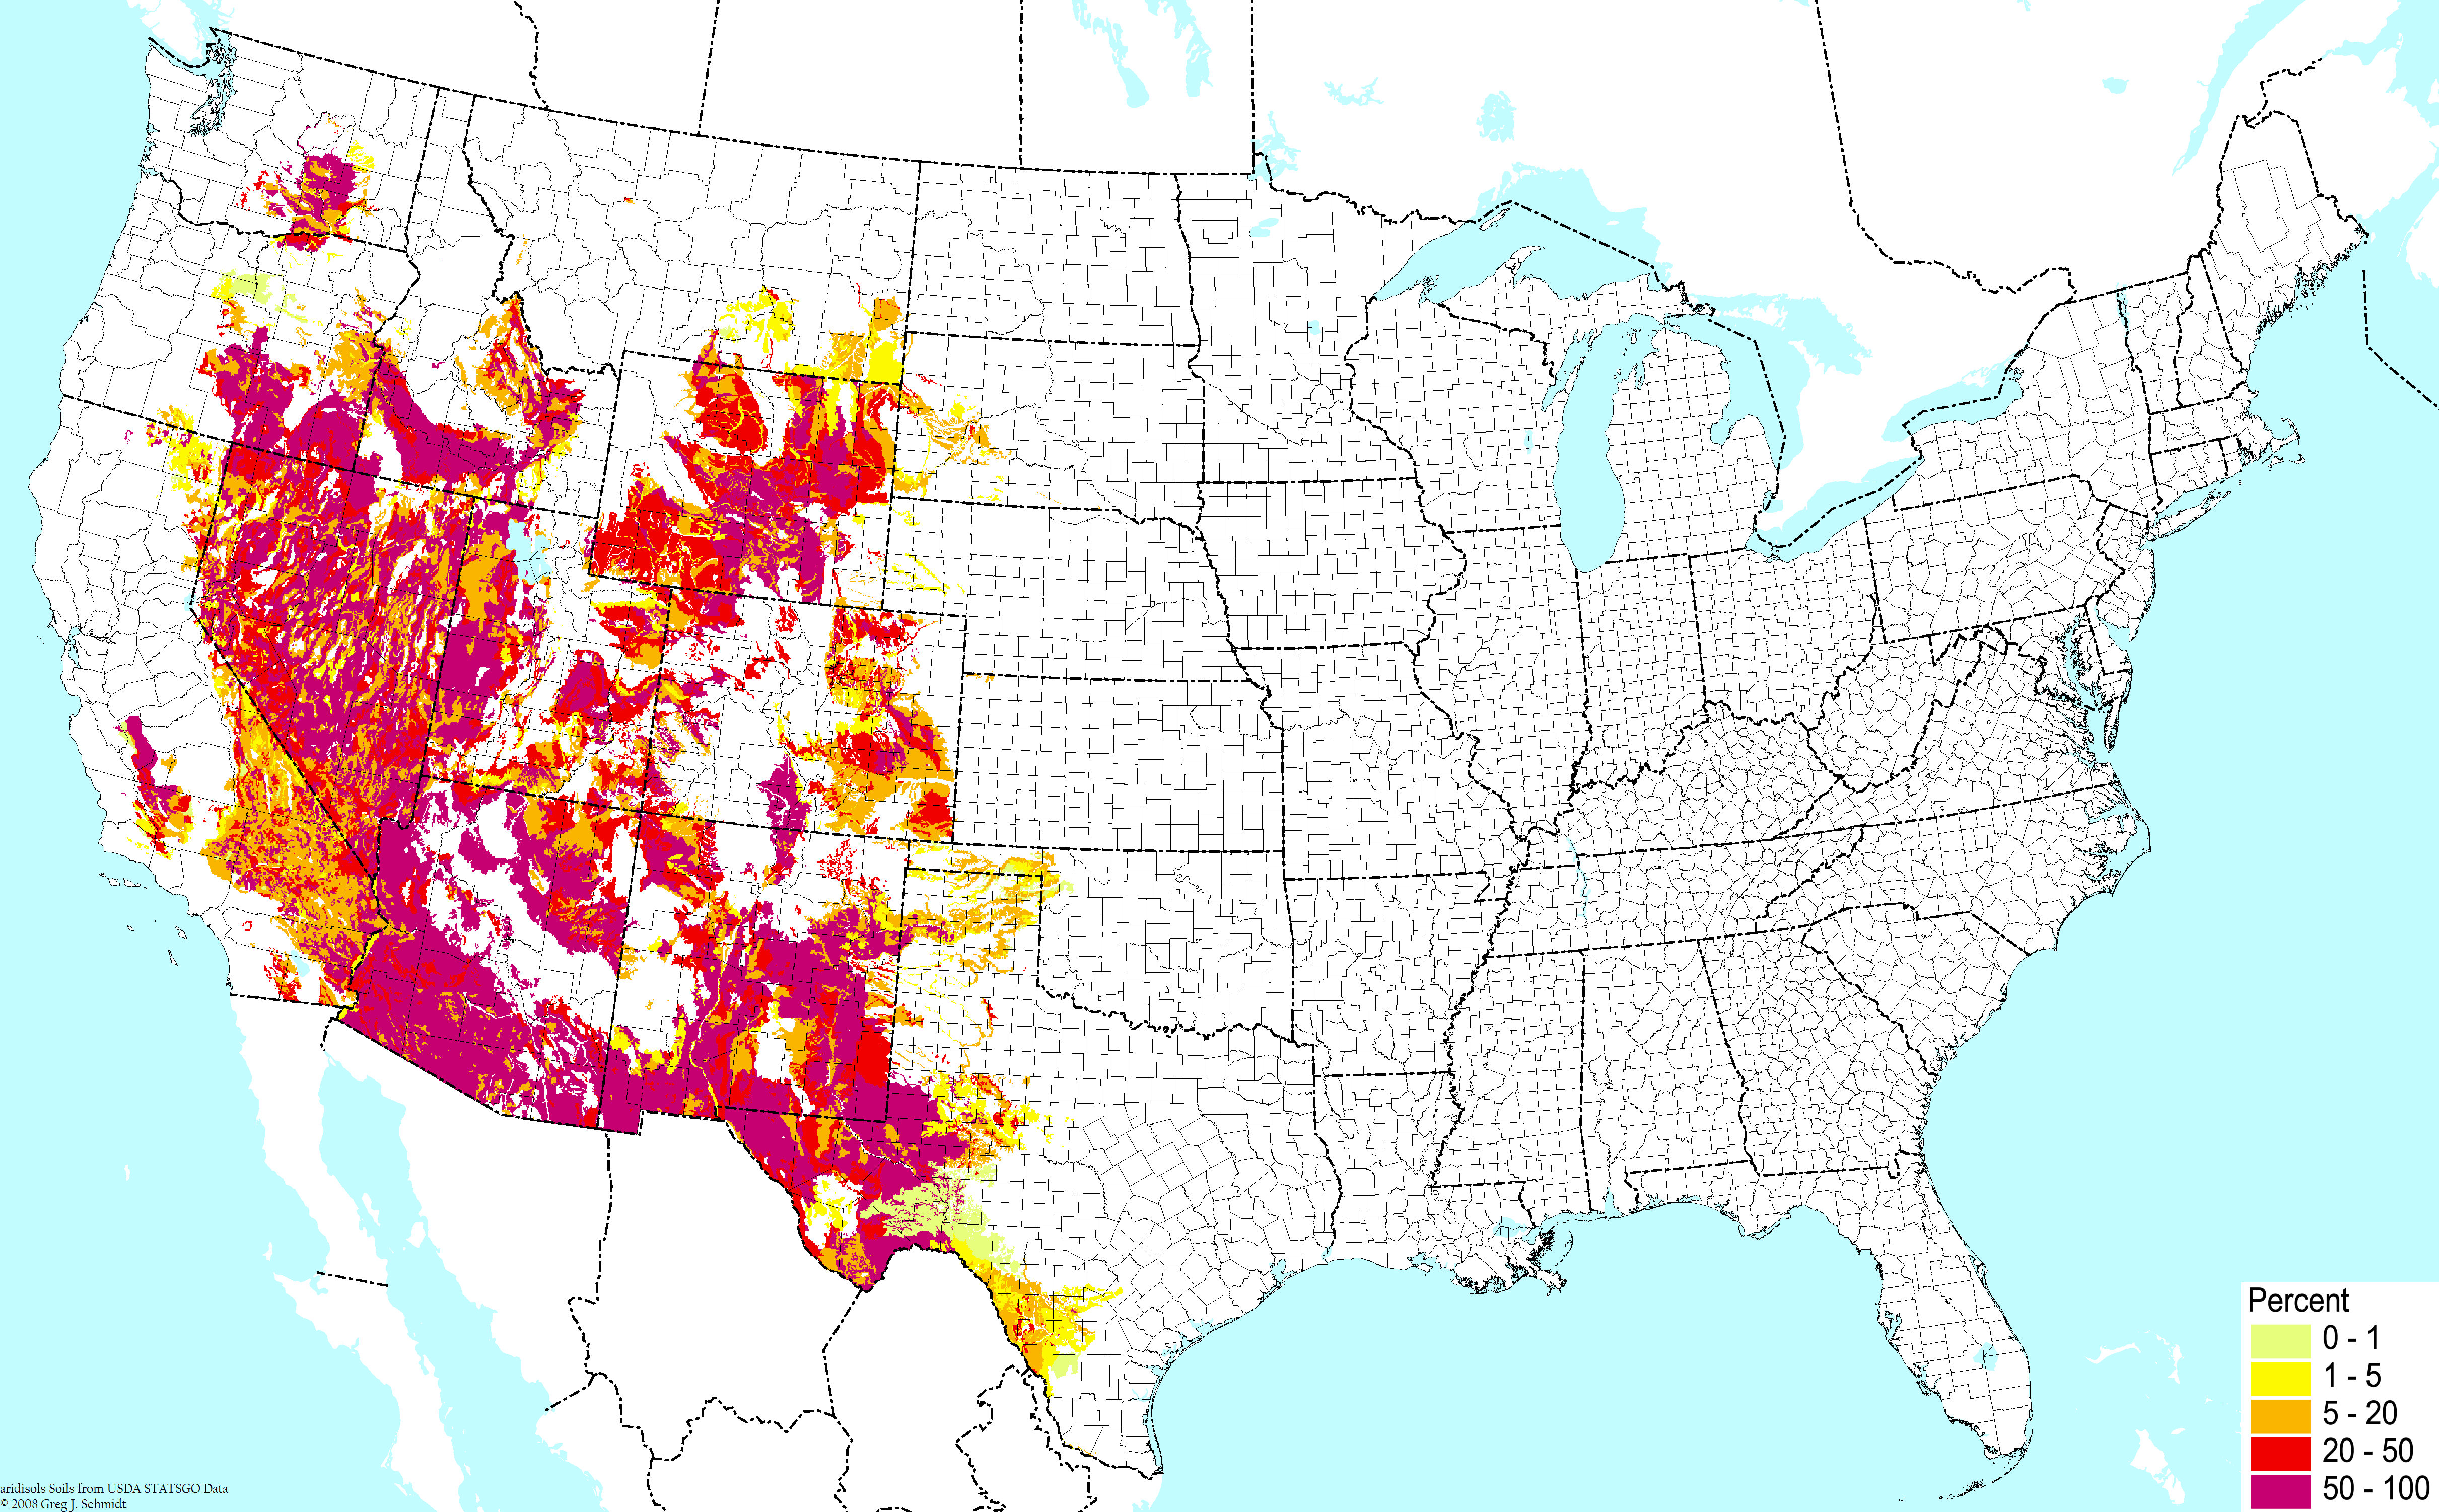
 Shrink/swell clay soils (excluding wetlands) ©BONAP Shrink/swell clay soils (excluding wetlands) ©BONAP | 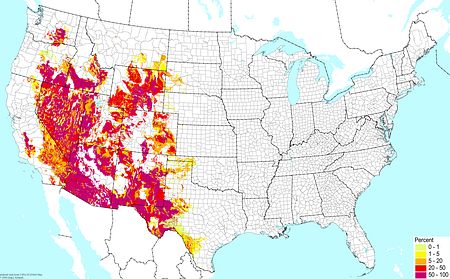 Desert soils (excluding salt flats and gypsum) ©BONAP Desert soils (excluding salt flats and gypsum) ©BONAP | 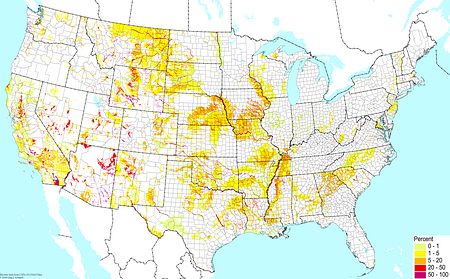
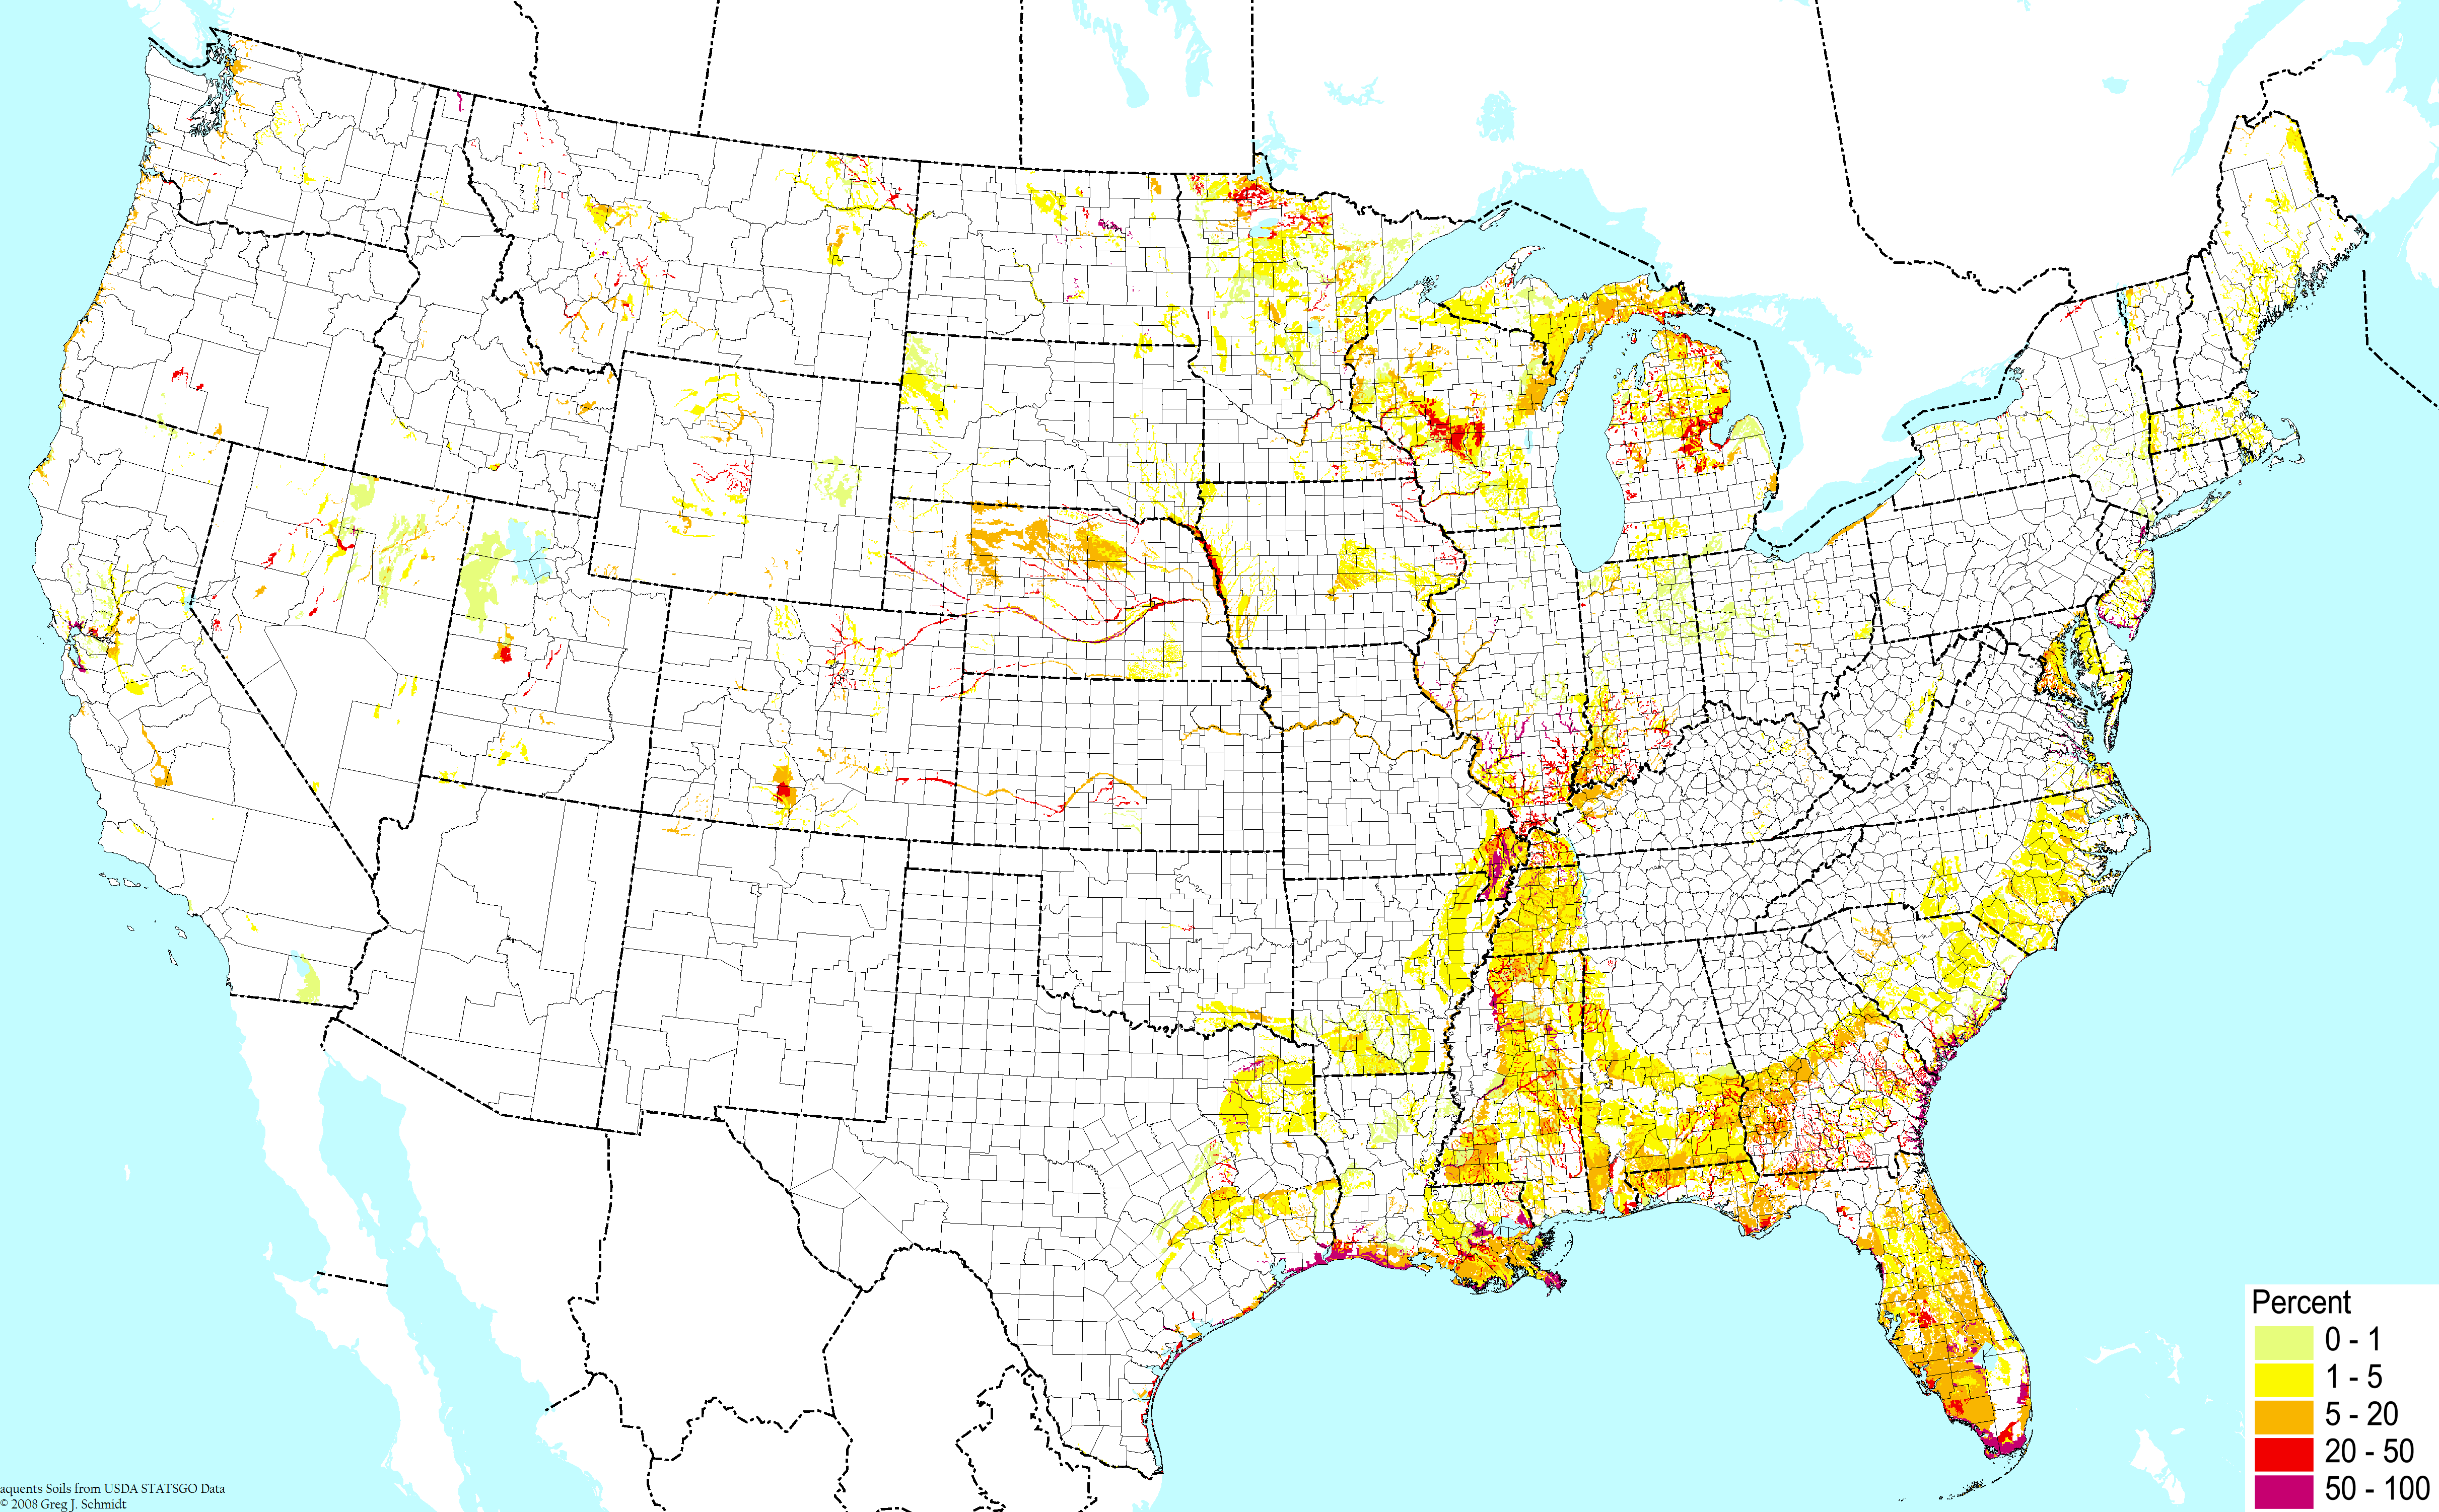
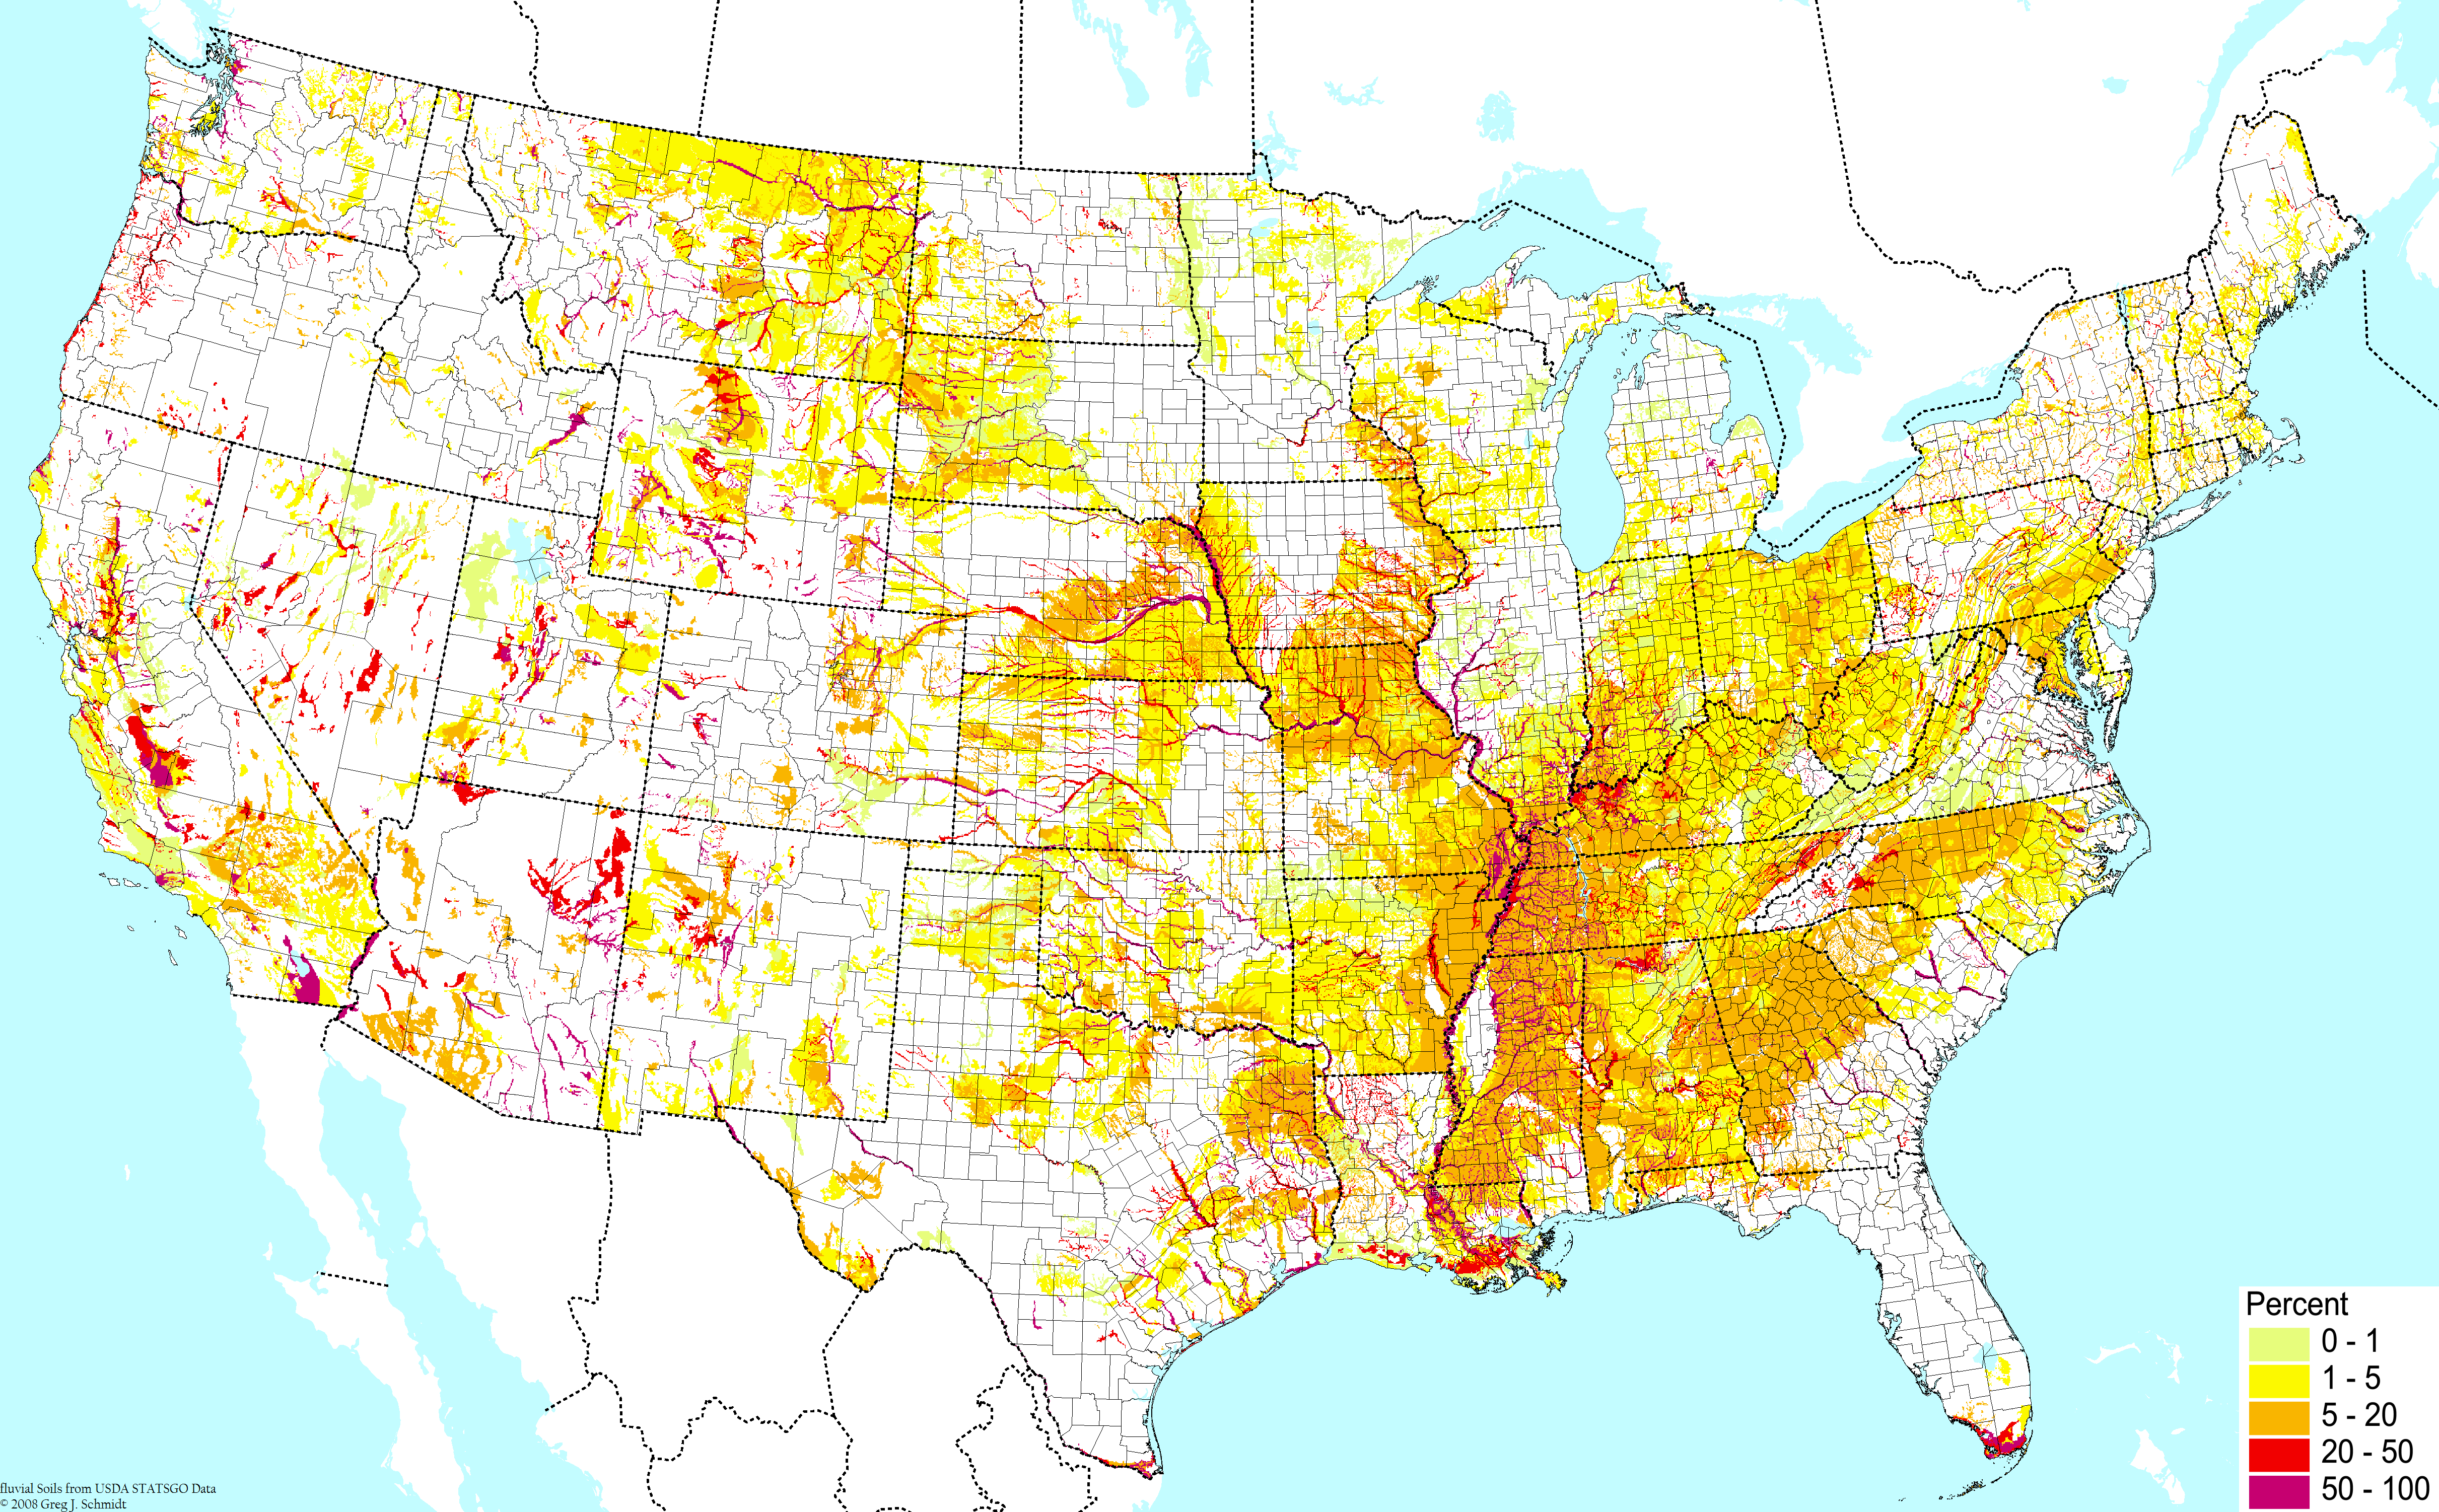
Non-wetland floodplain soils ©BONAP |
 Various soils with elements of a floodplain soil ©BONAP Various soils with elements of a floodplain soil ©BONAP |  Upland organic soils ©BONAP Upland organic soils ©BONAP | 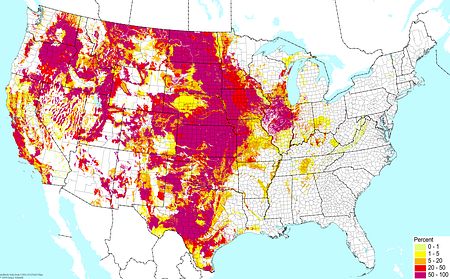
Prairie soils (excluding wetlands) ©BONAP |
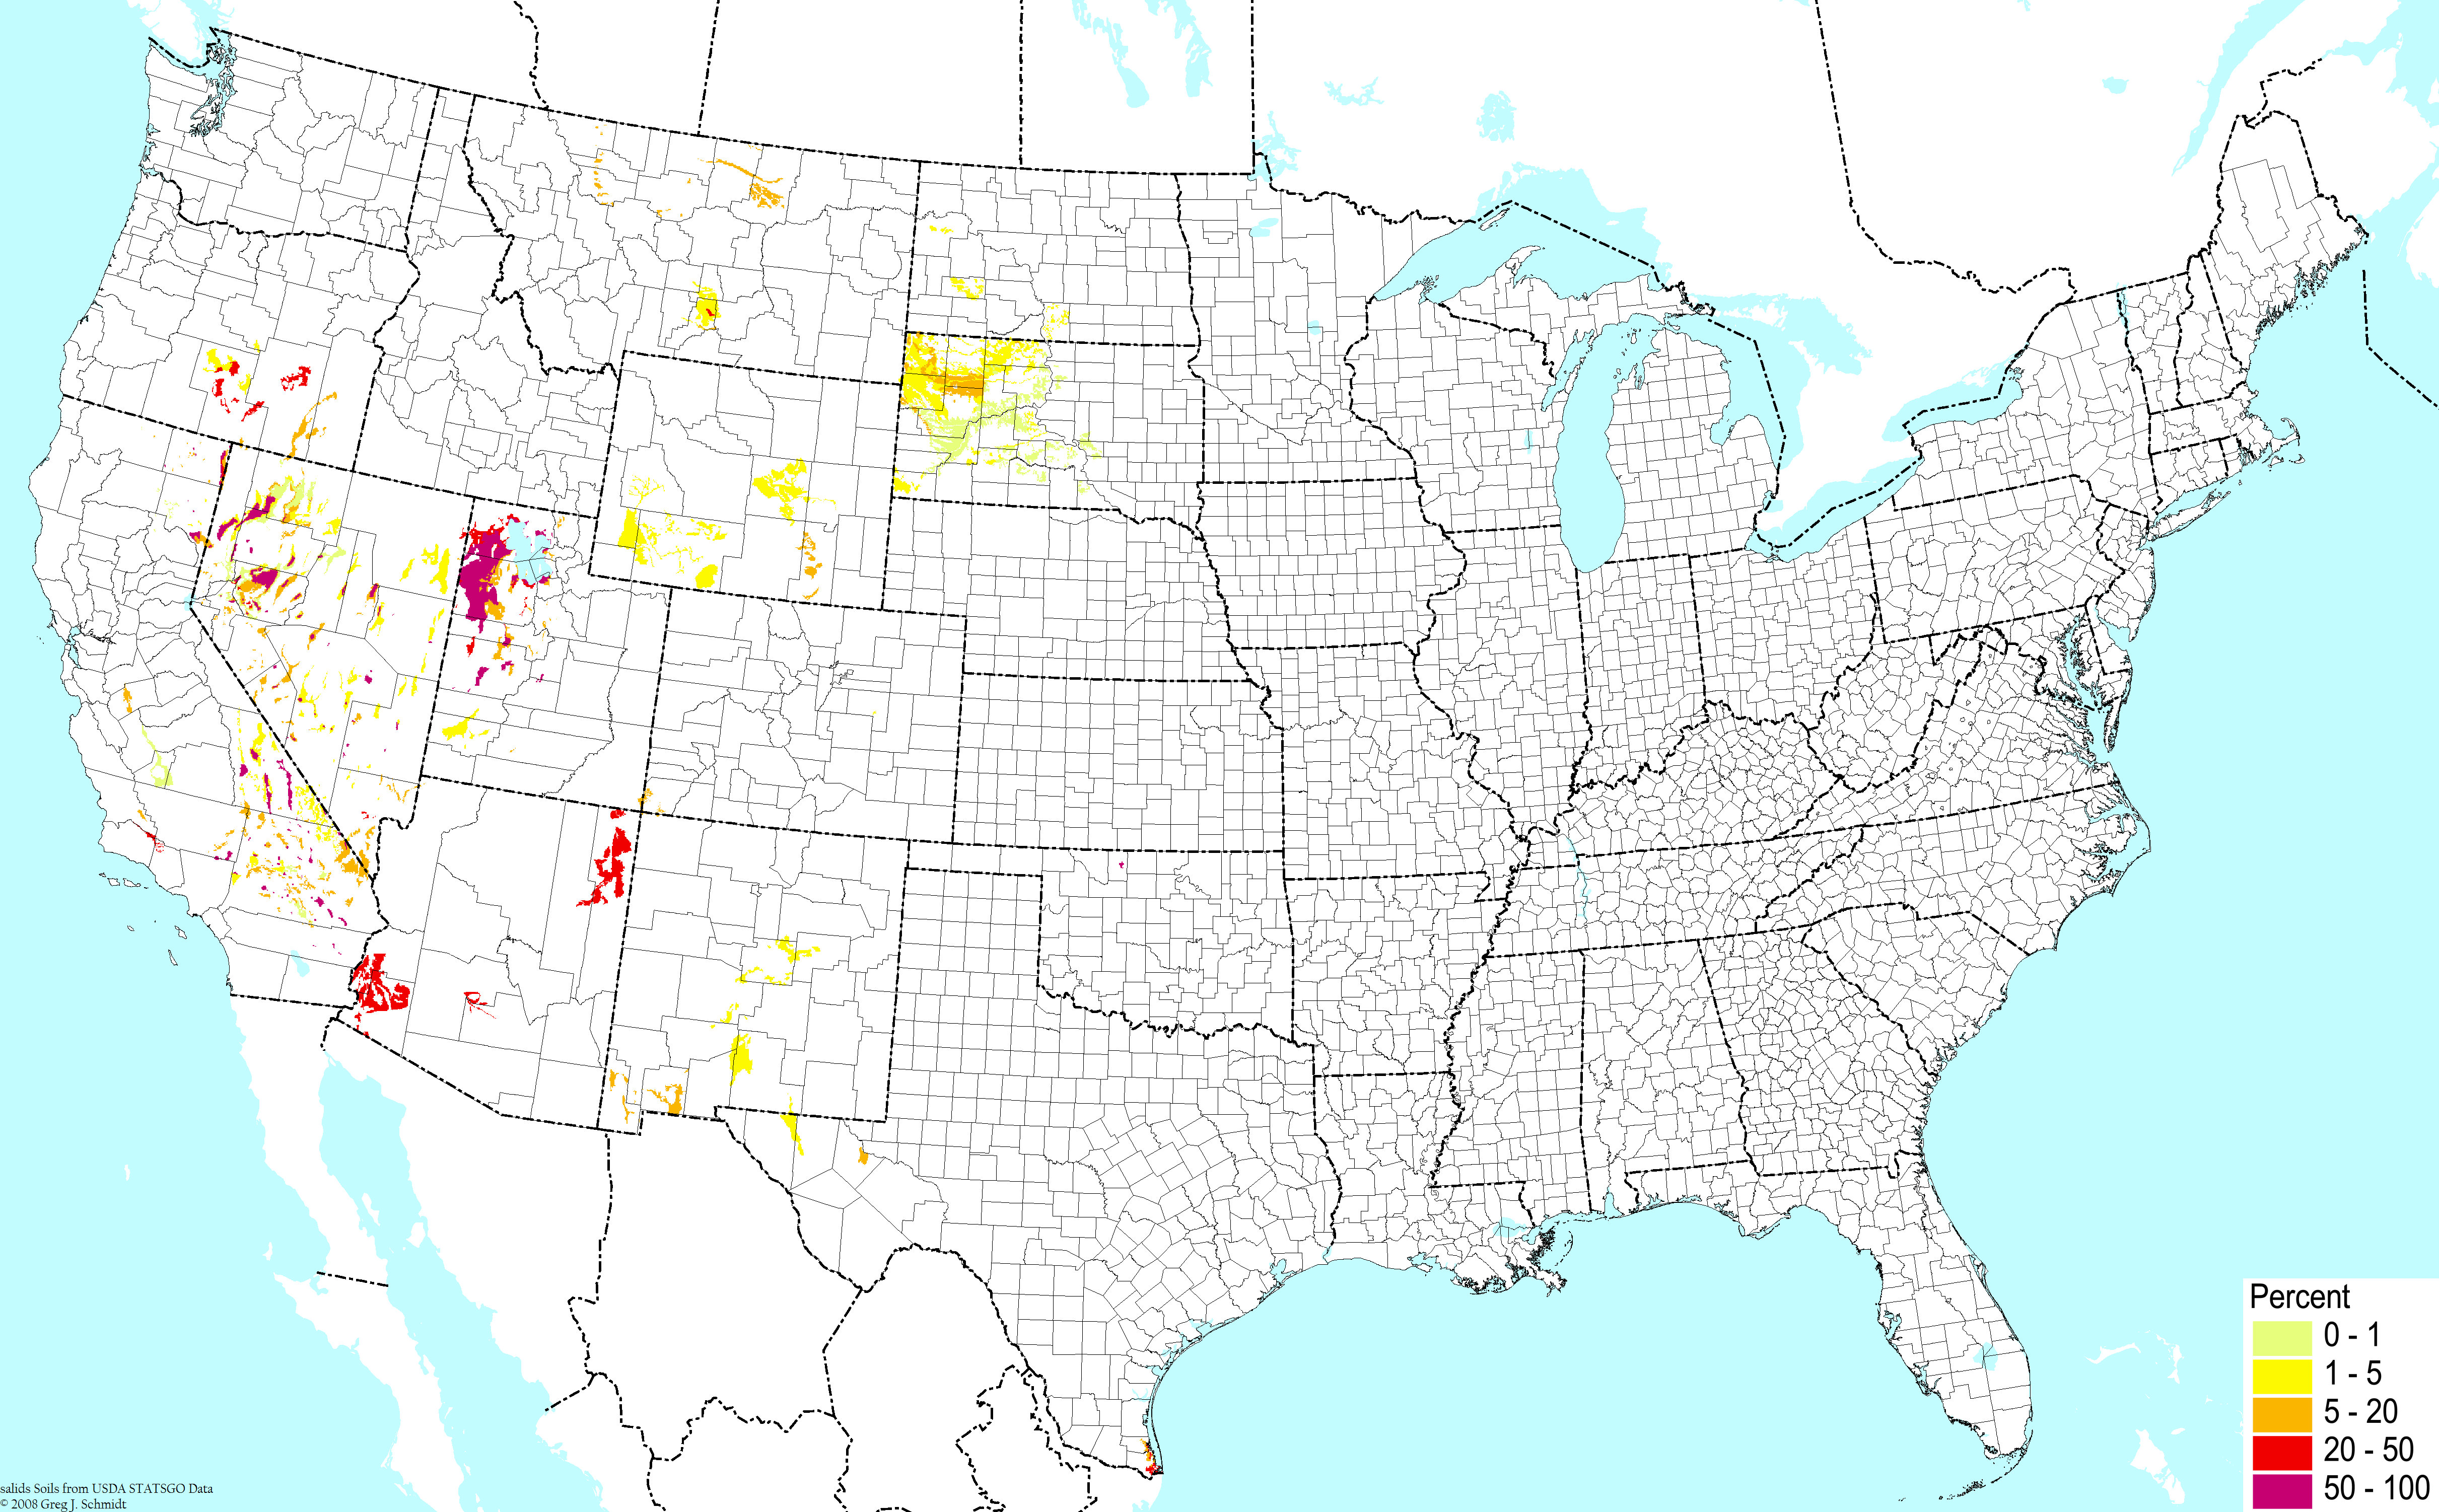
Salt flats ©BONAP | 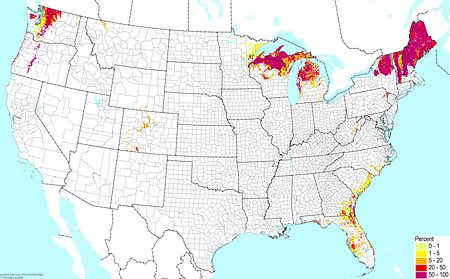
Pine forest soils (excluding wetlands) ©BONAP | 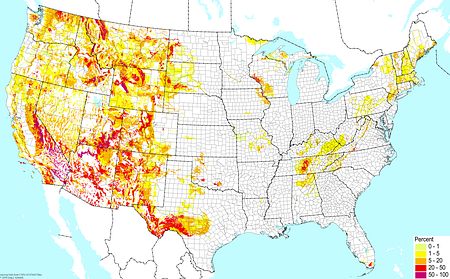
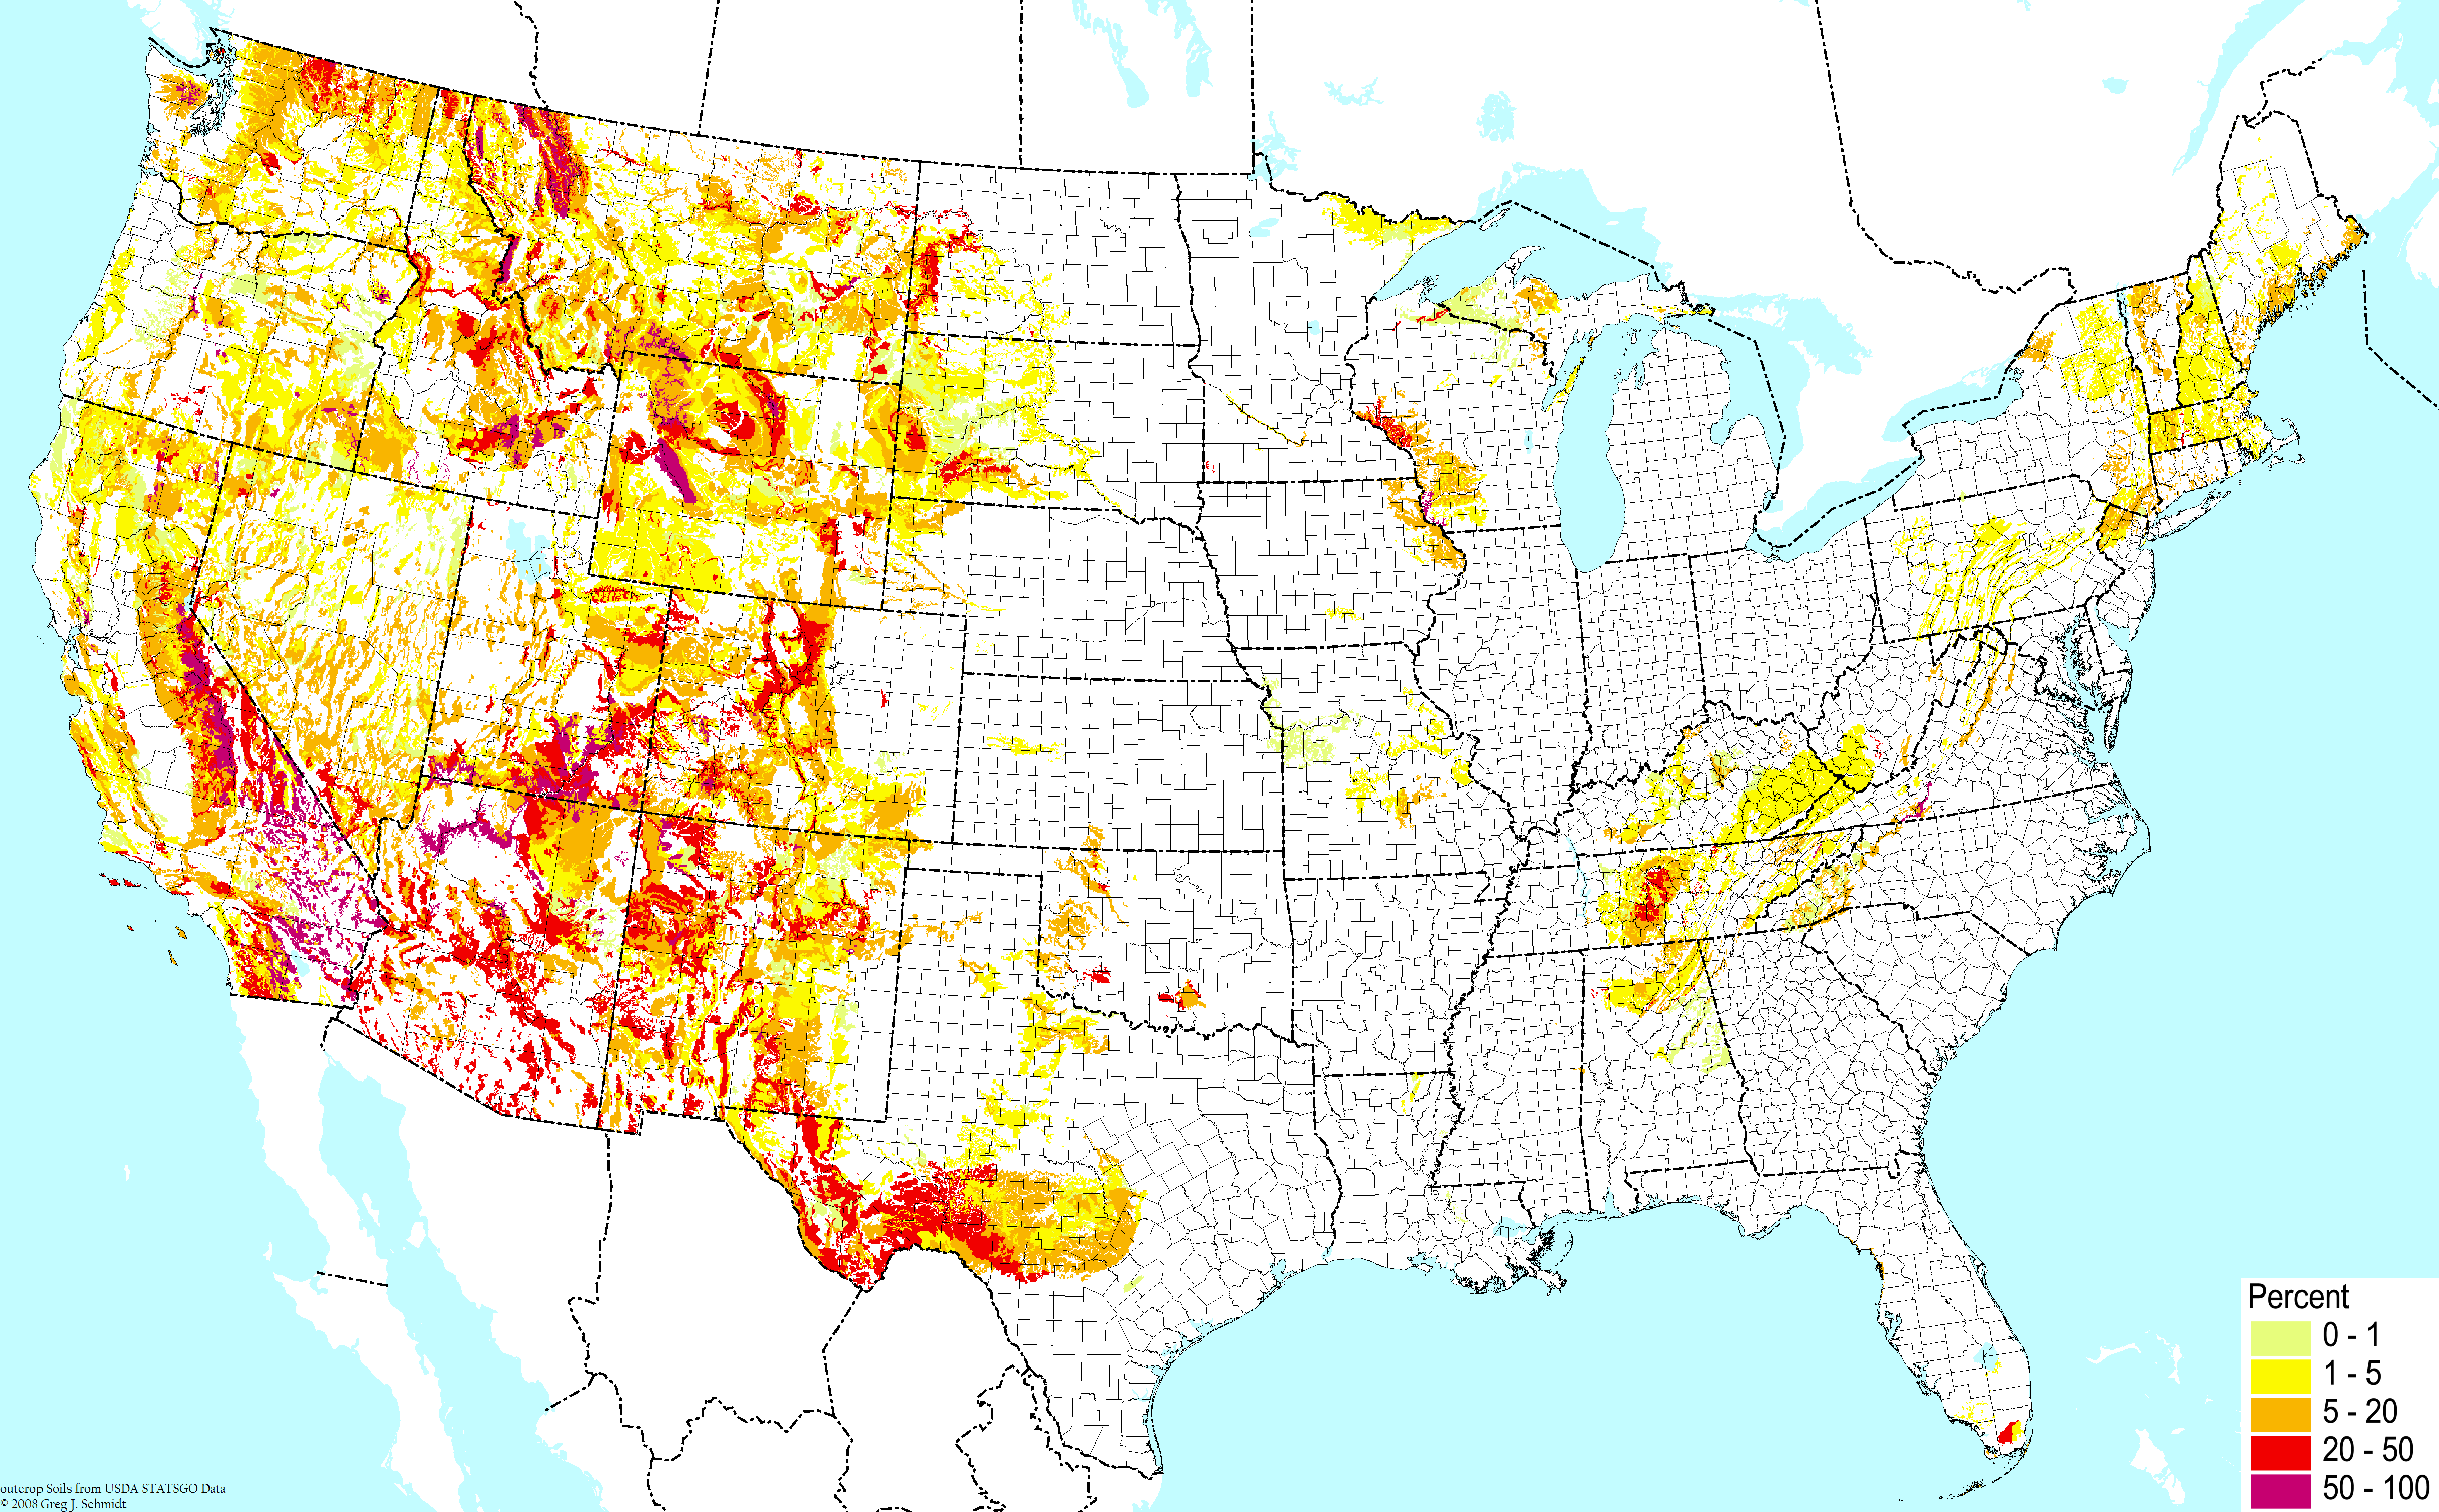
Rock outcrops ©BONAP
|
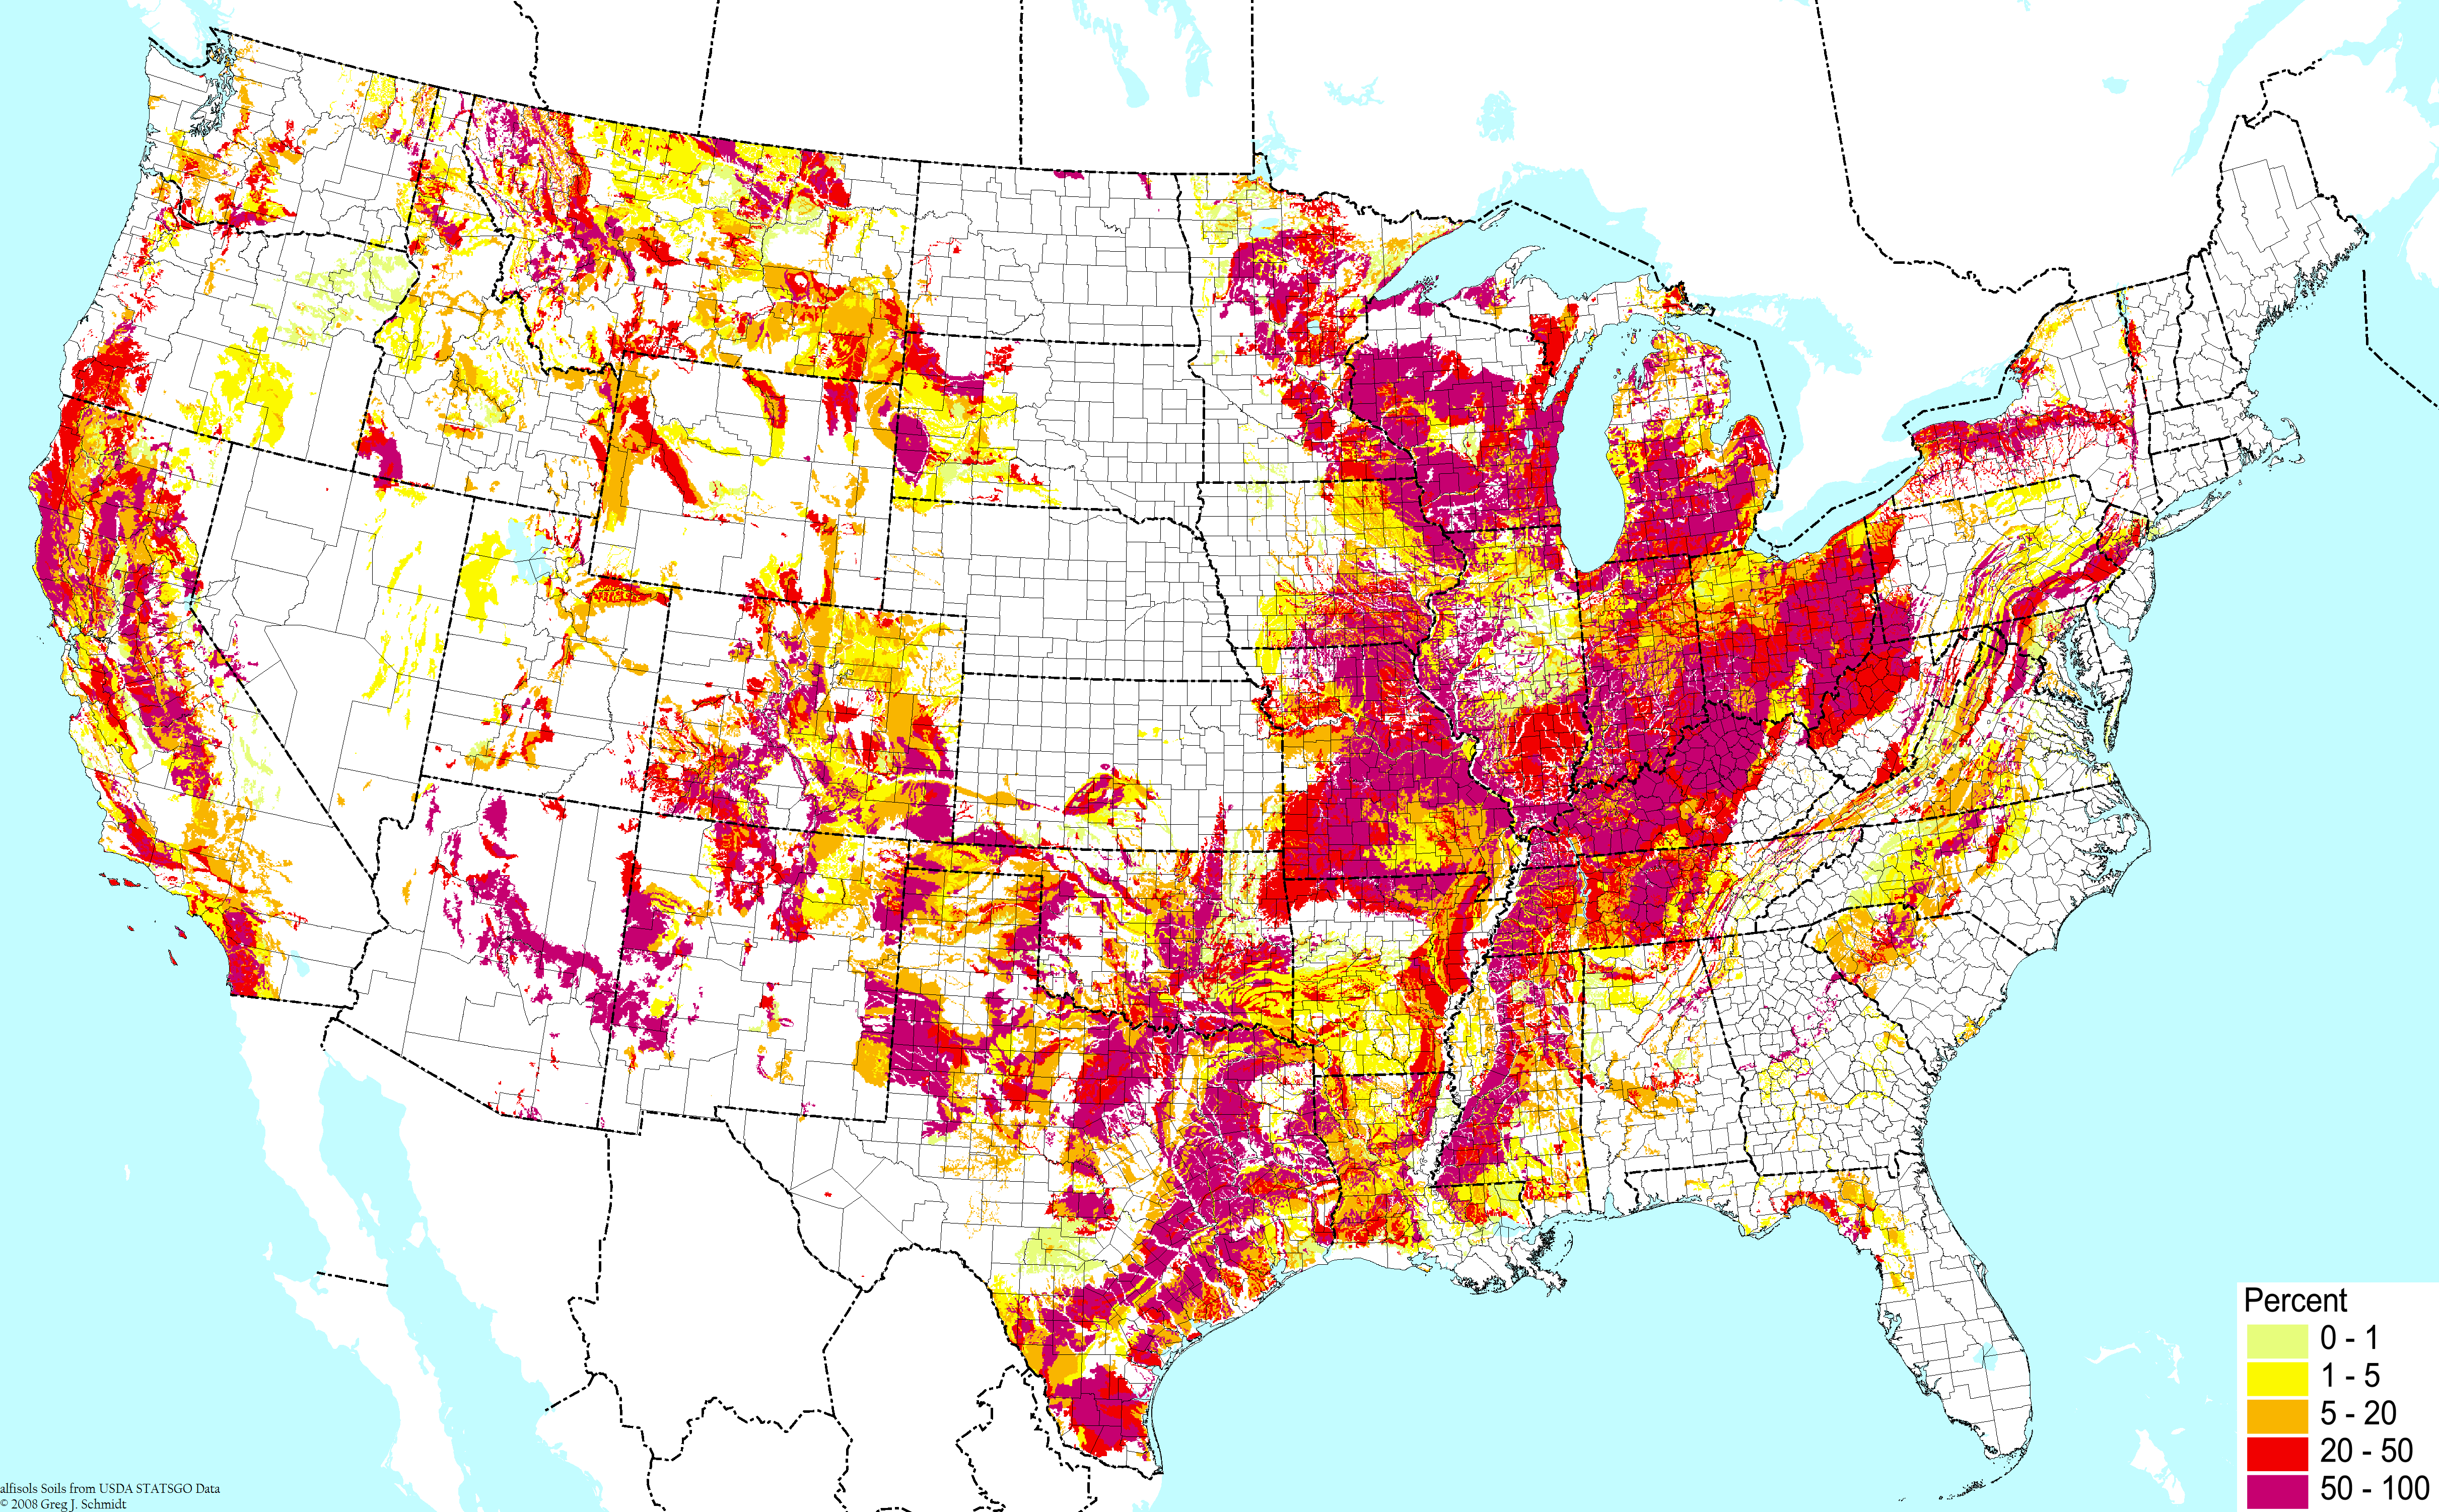
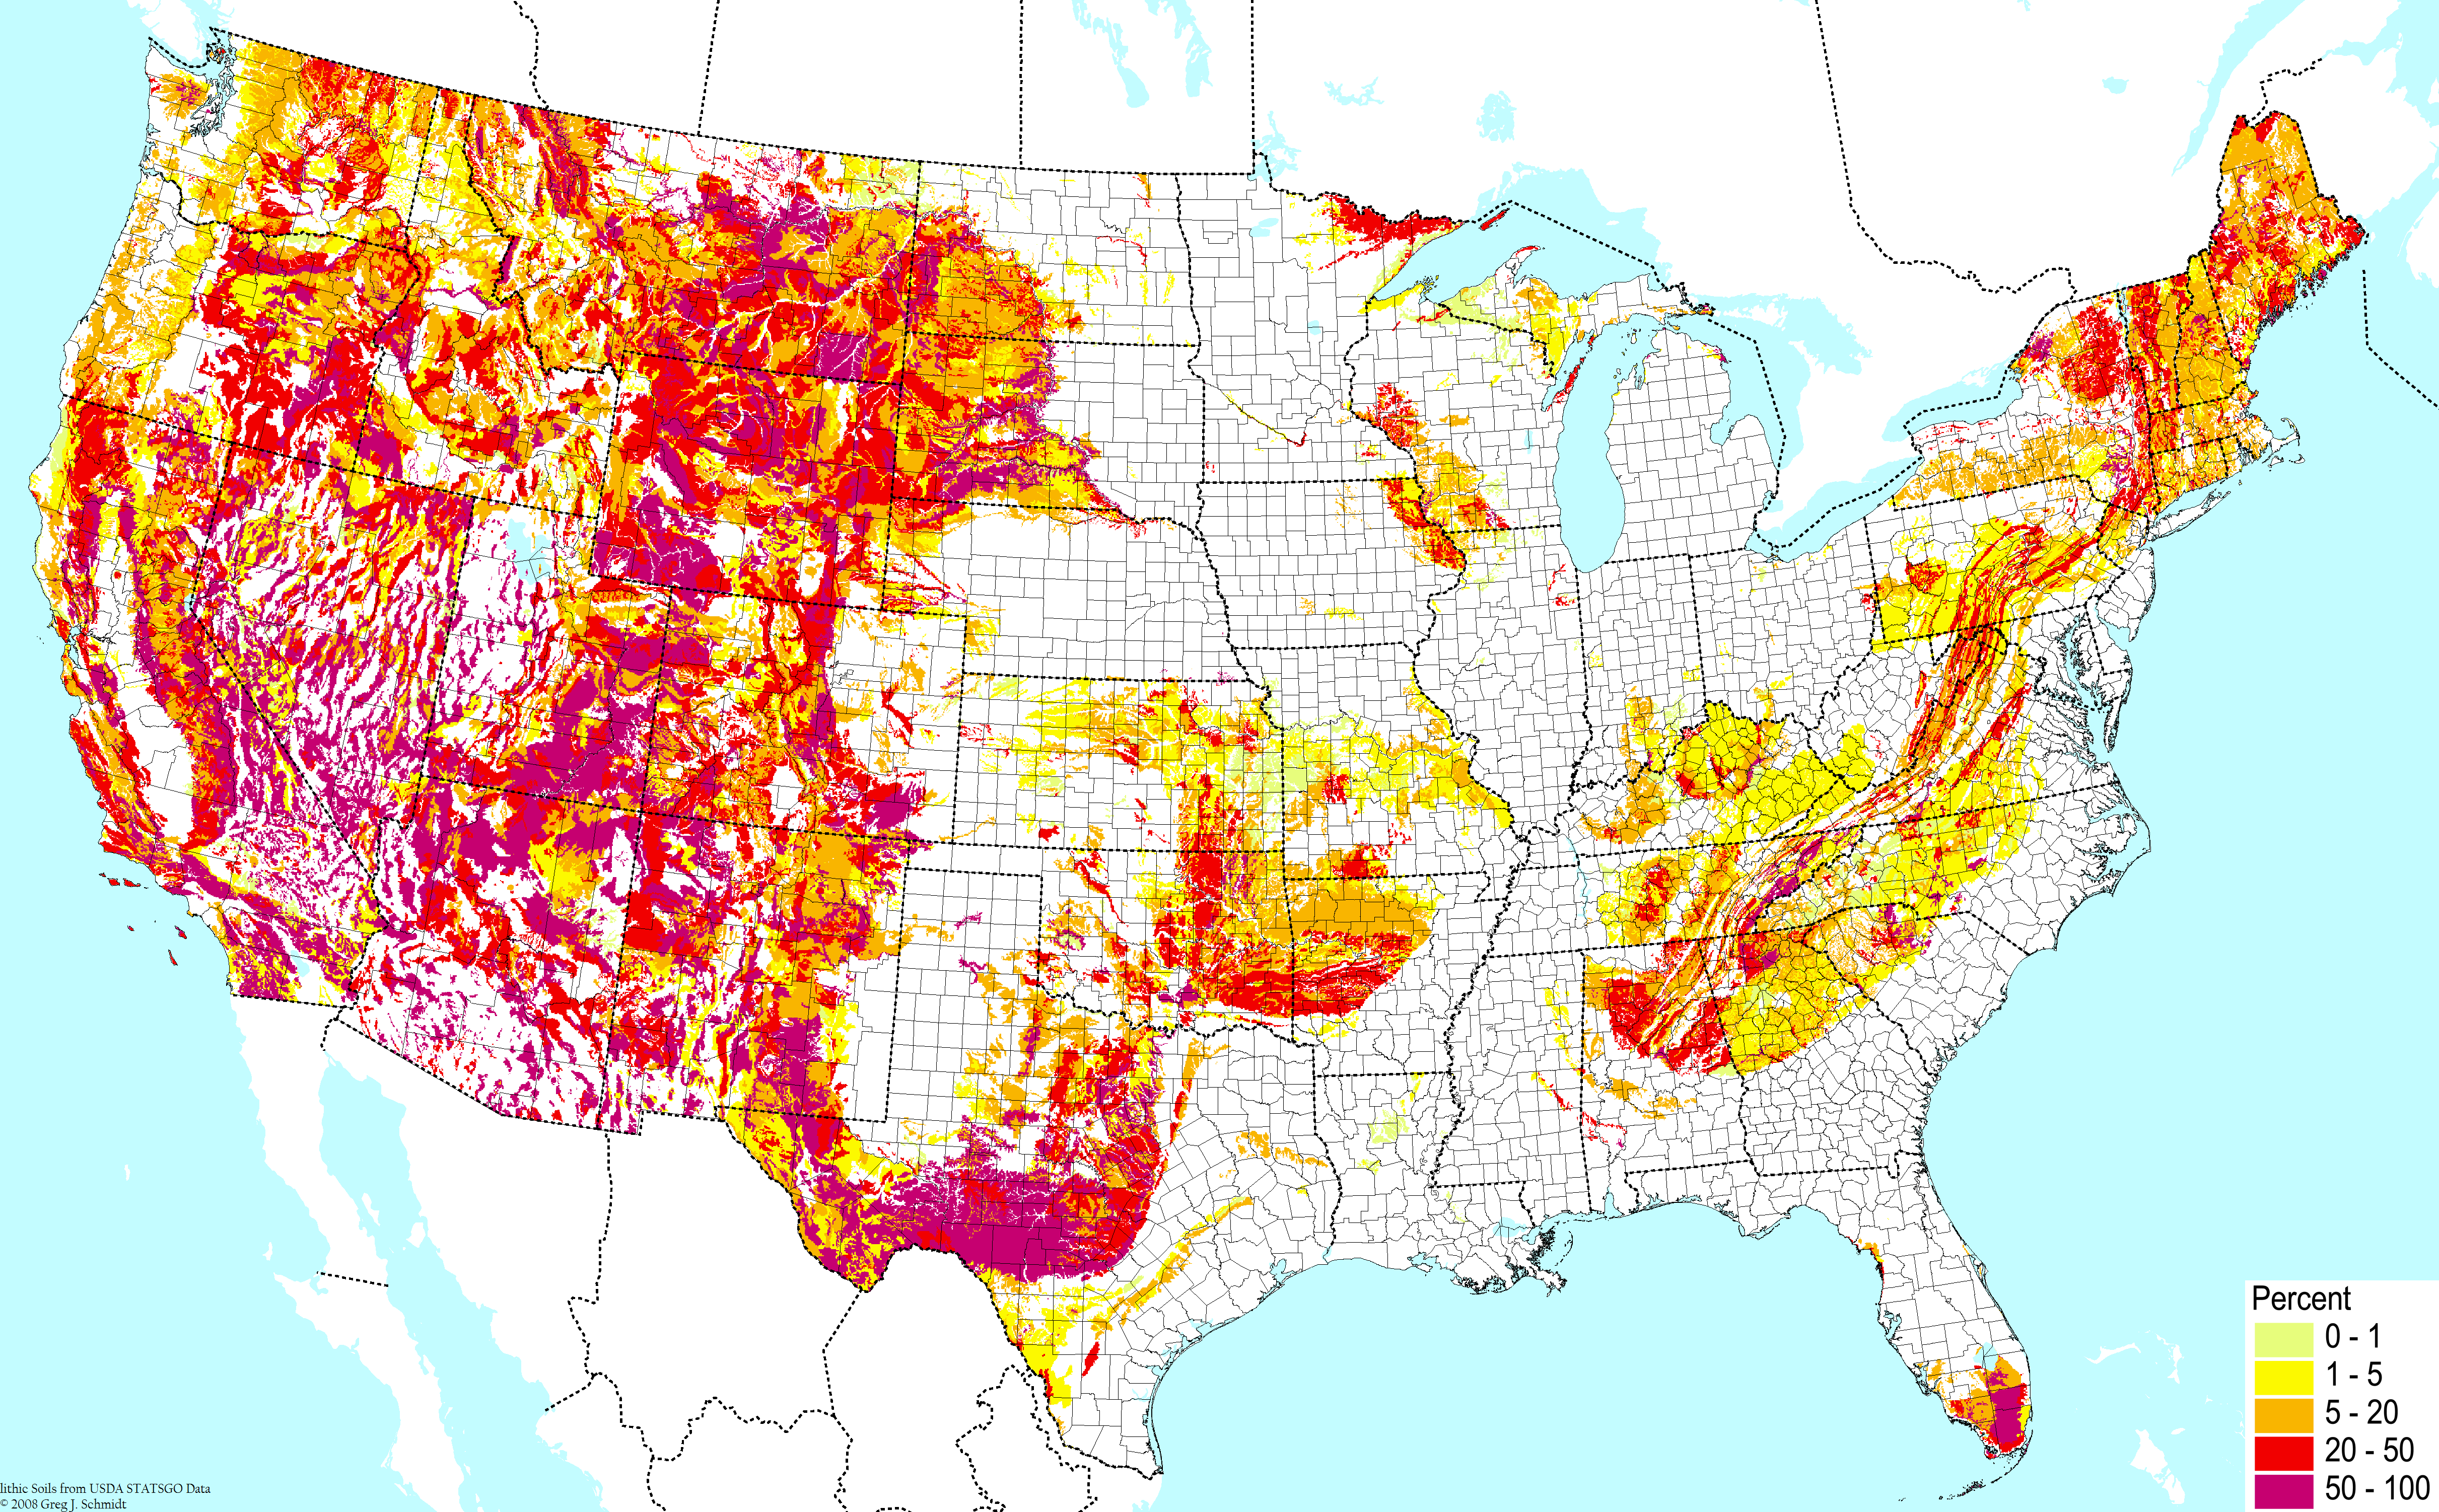
 Weakly developed soils (excluding wetlands) ©BONAP Weakly developed soils (excluding wetlands) ©BONAP |  Shallow soils (bedrock within a half meter of the surface) ©BONAP Shallow soils (bedrock within a half meter of the surface) ©BONAP | 
Man-made/modified soils ©BONAP |
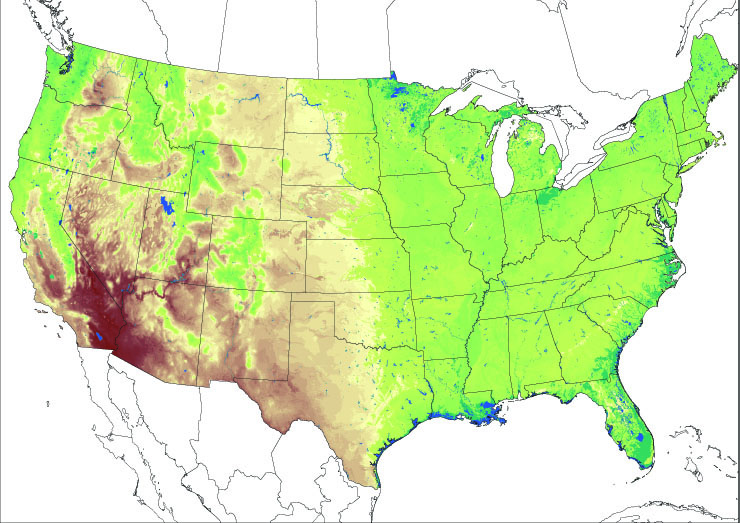
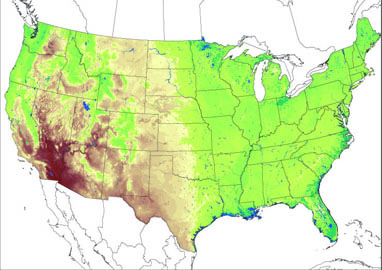 Soil moisture based on average drainage and climate ©BONAP | 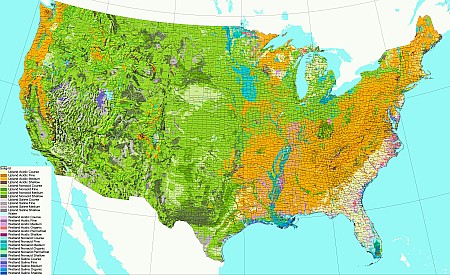
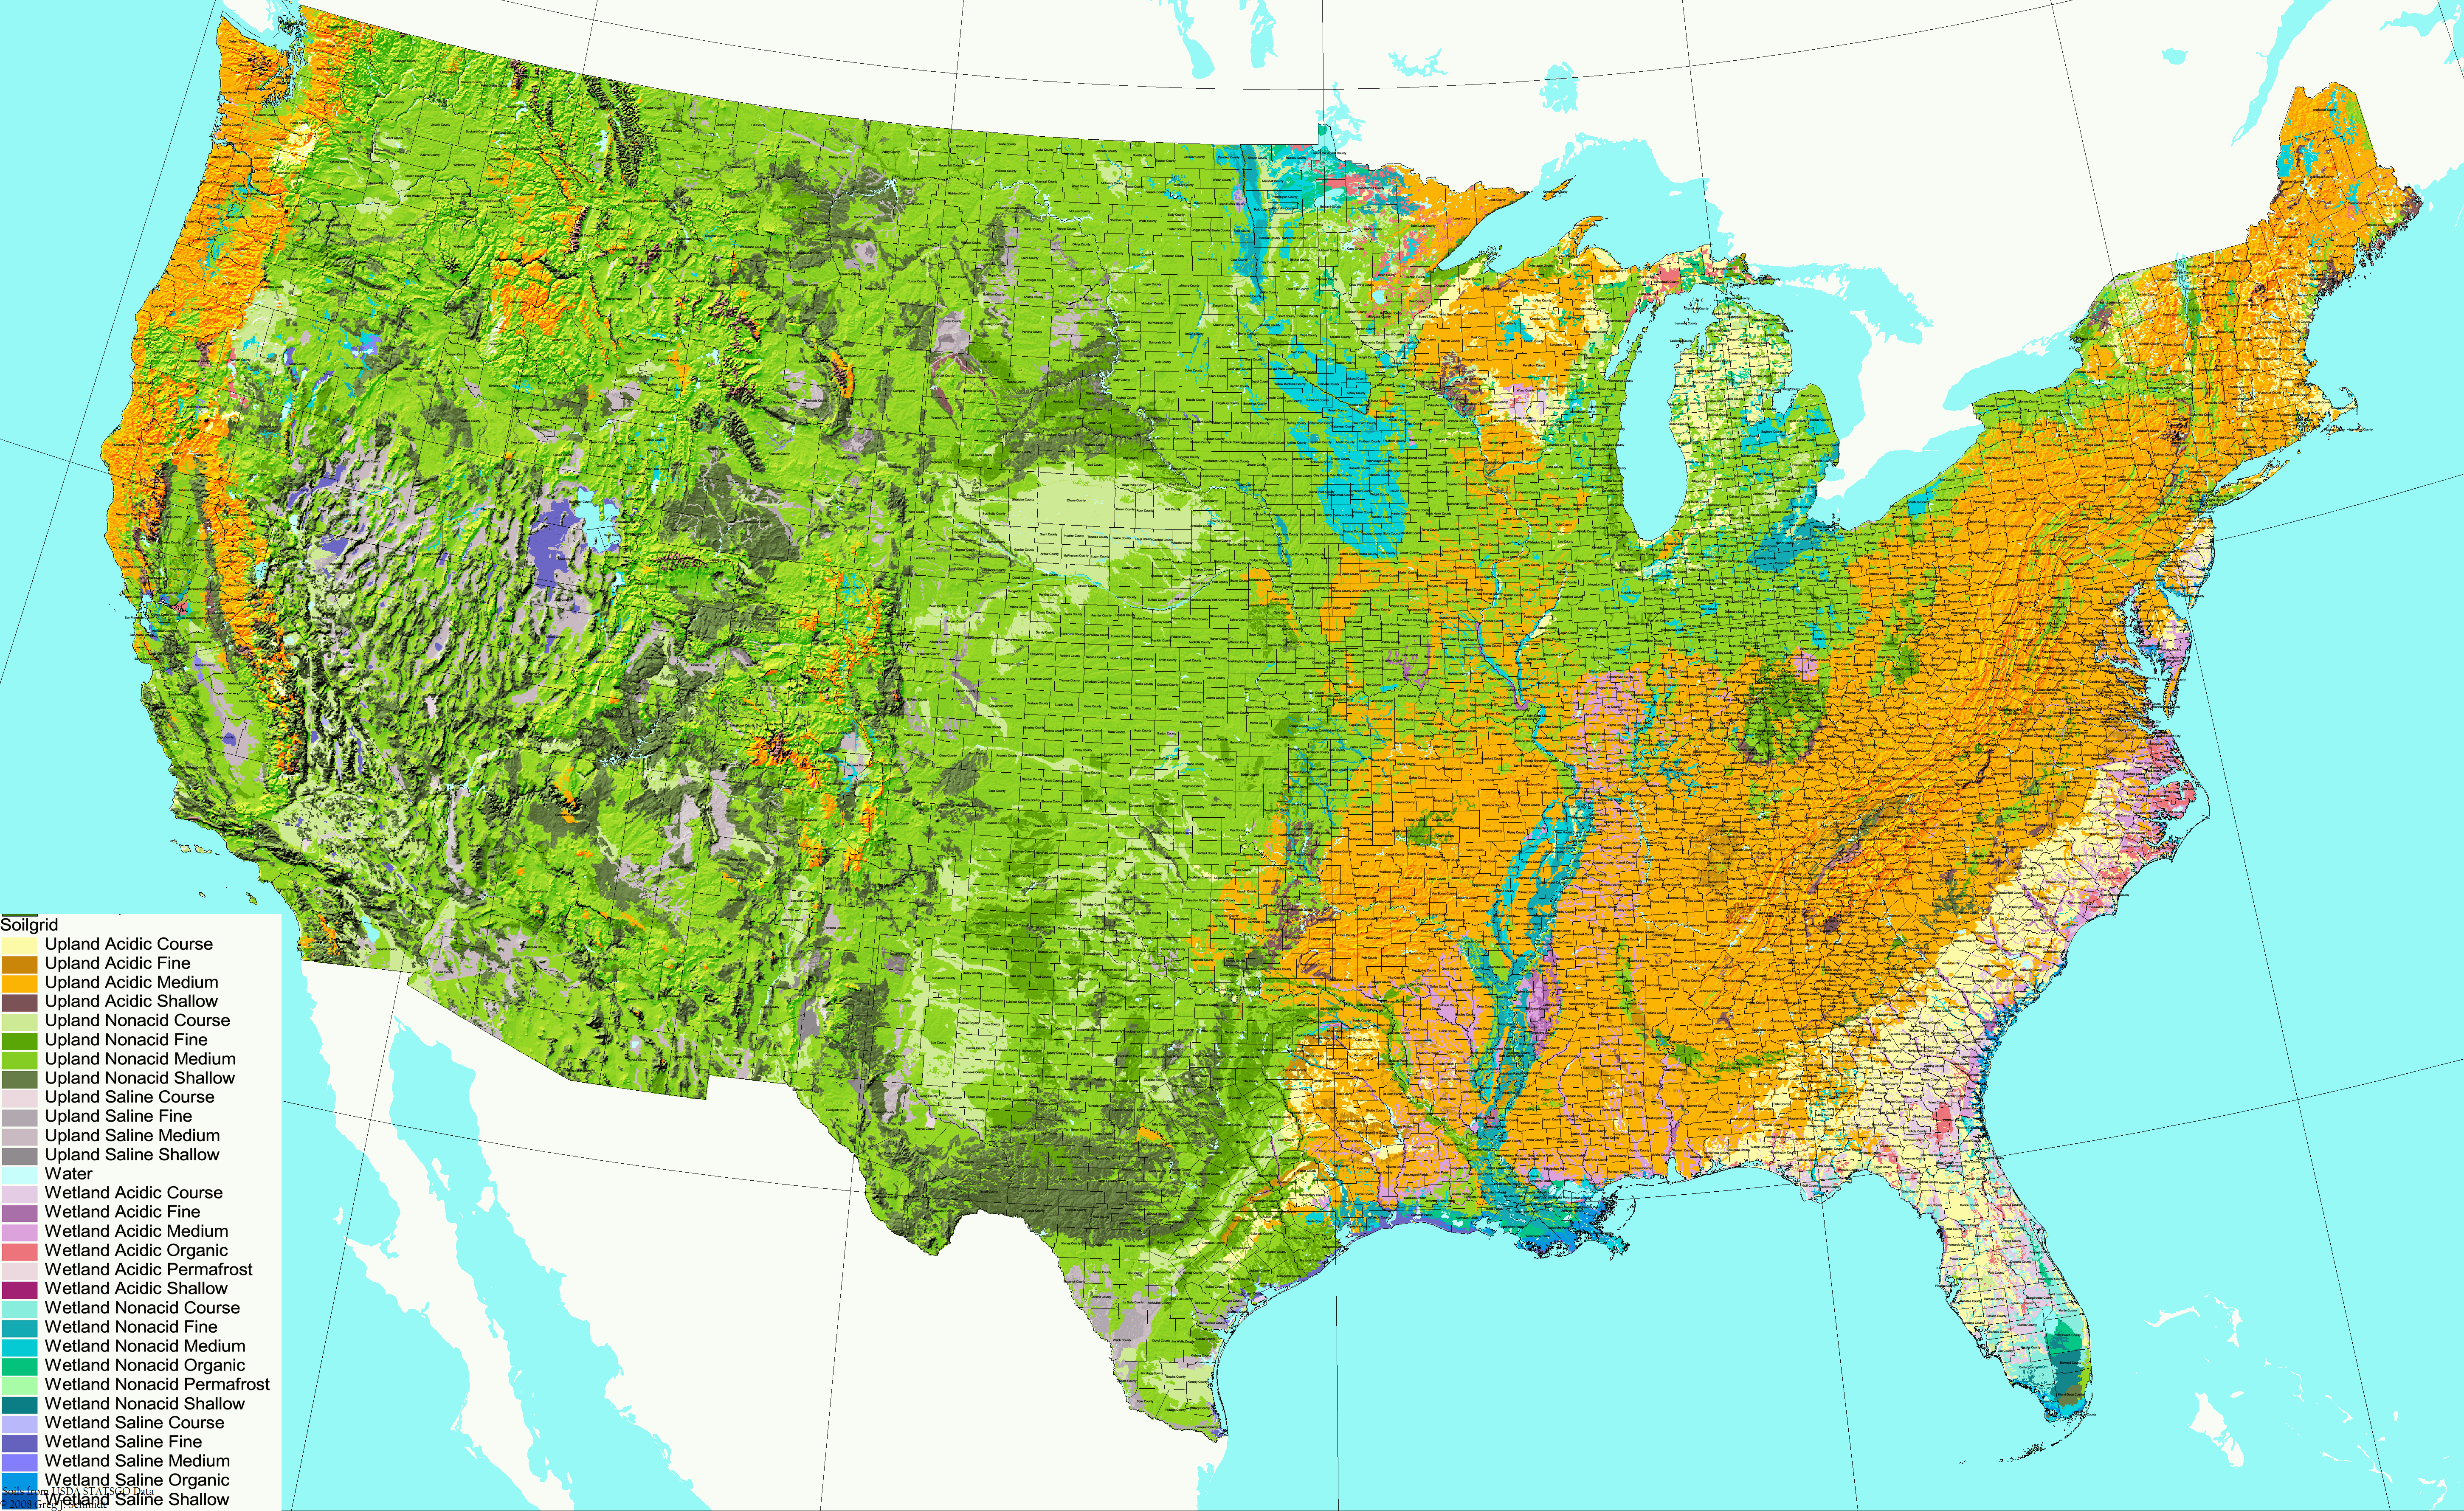
Soils of the lower 48 US states, based on dominant soil pH, textures, and wetland status (data from NRCS) ©BONAP | 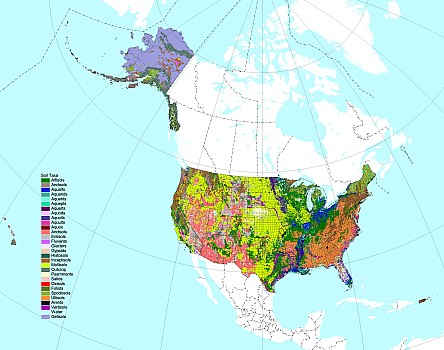
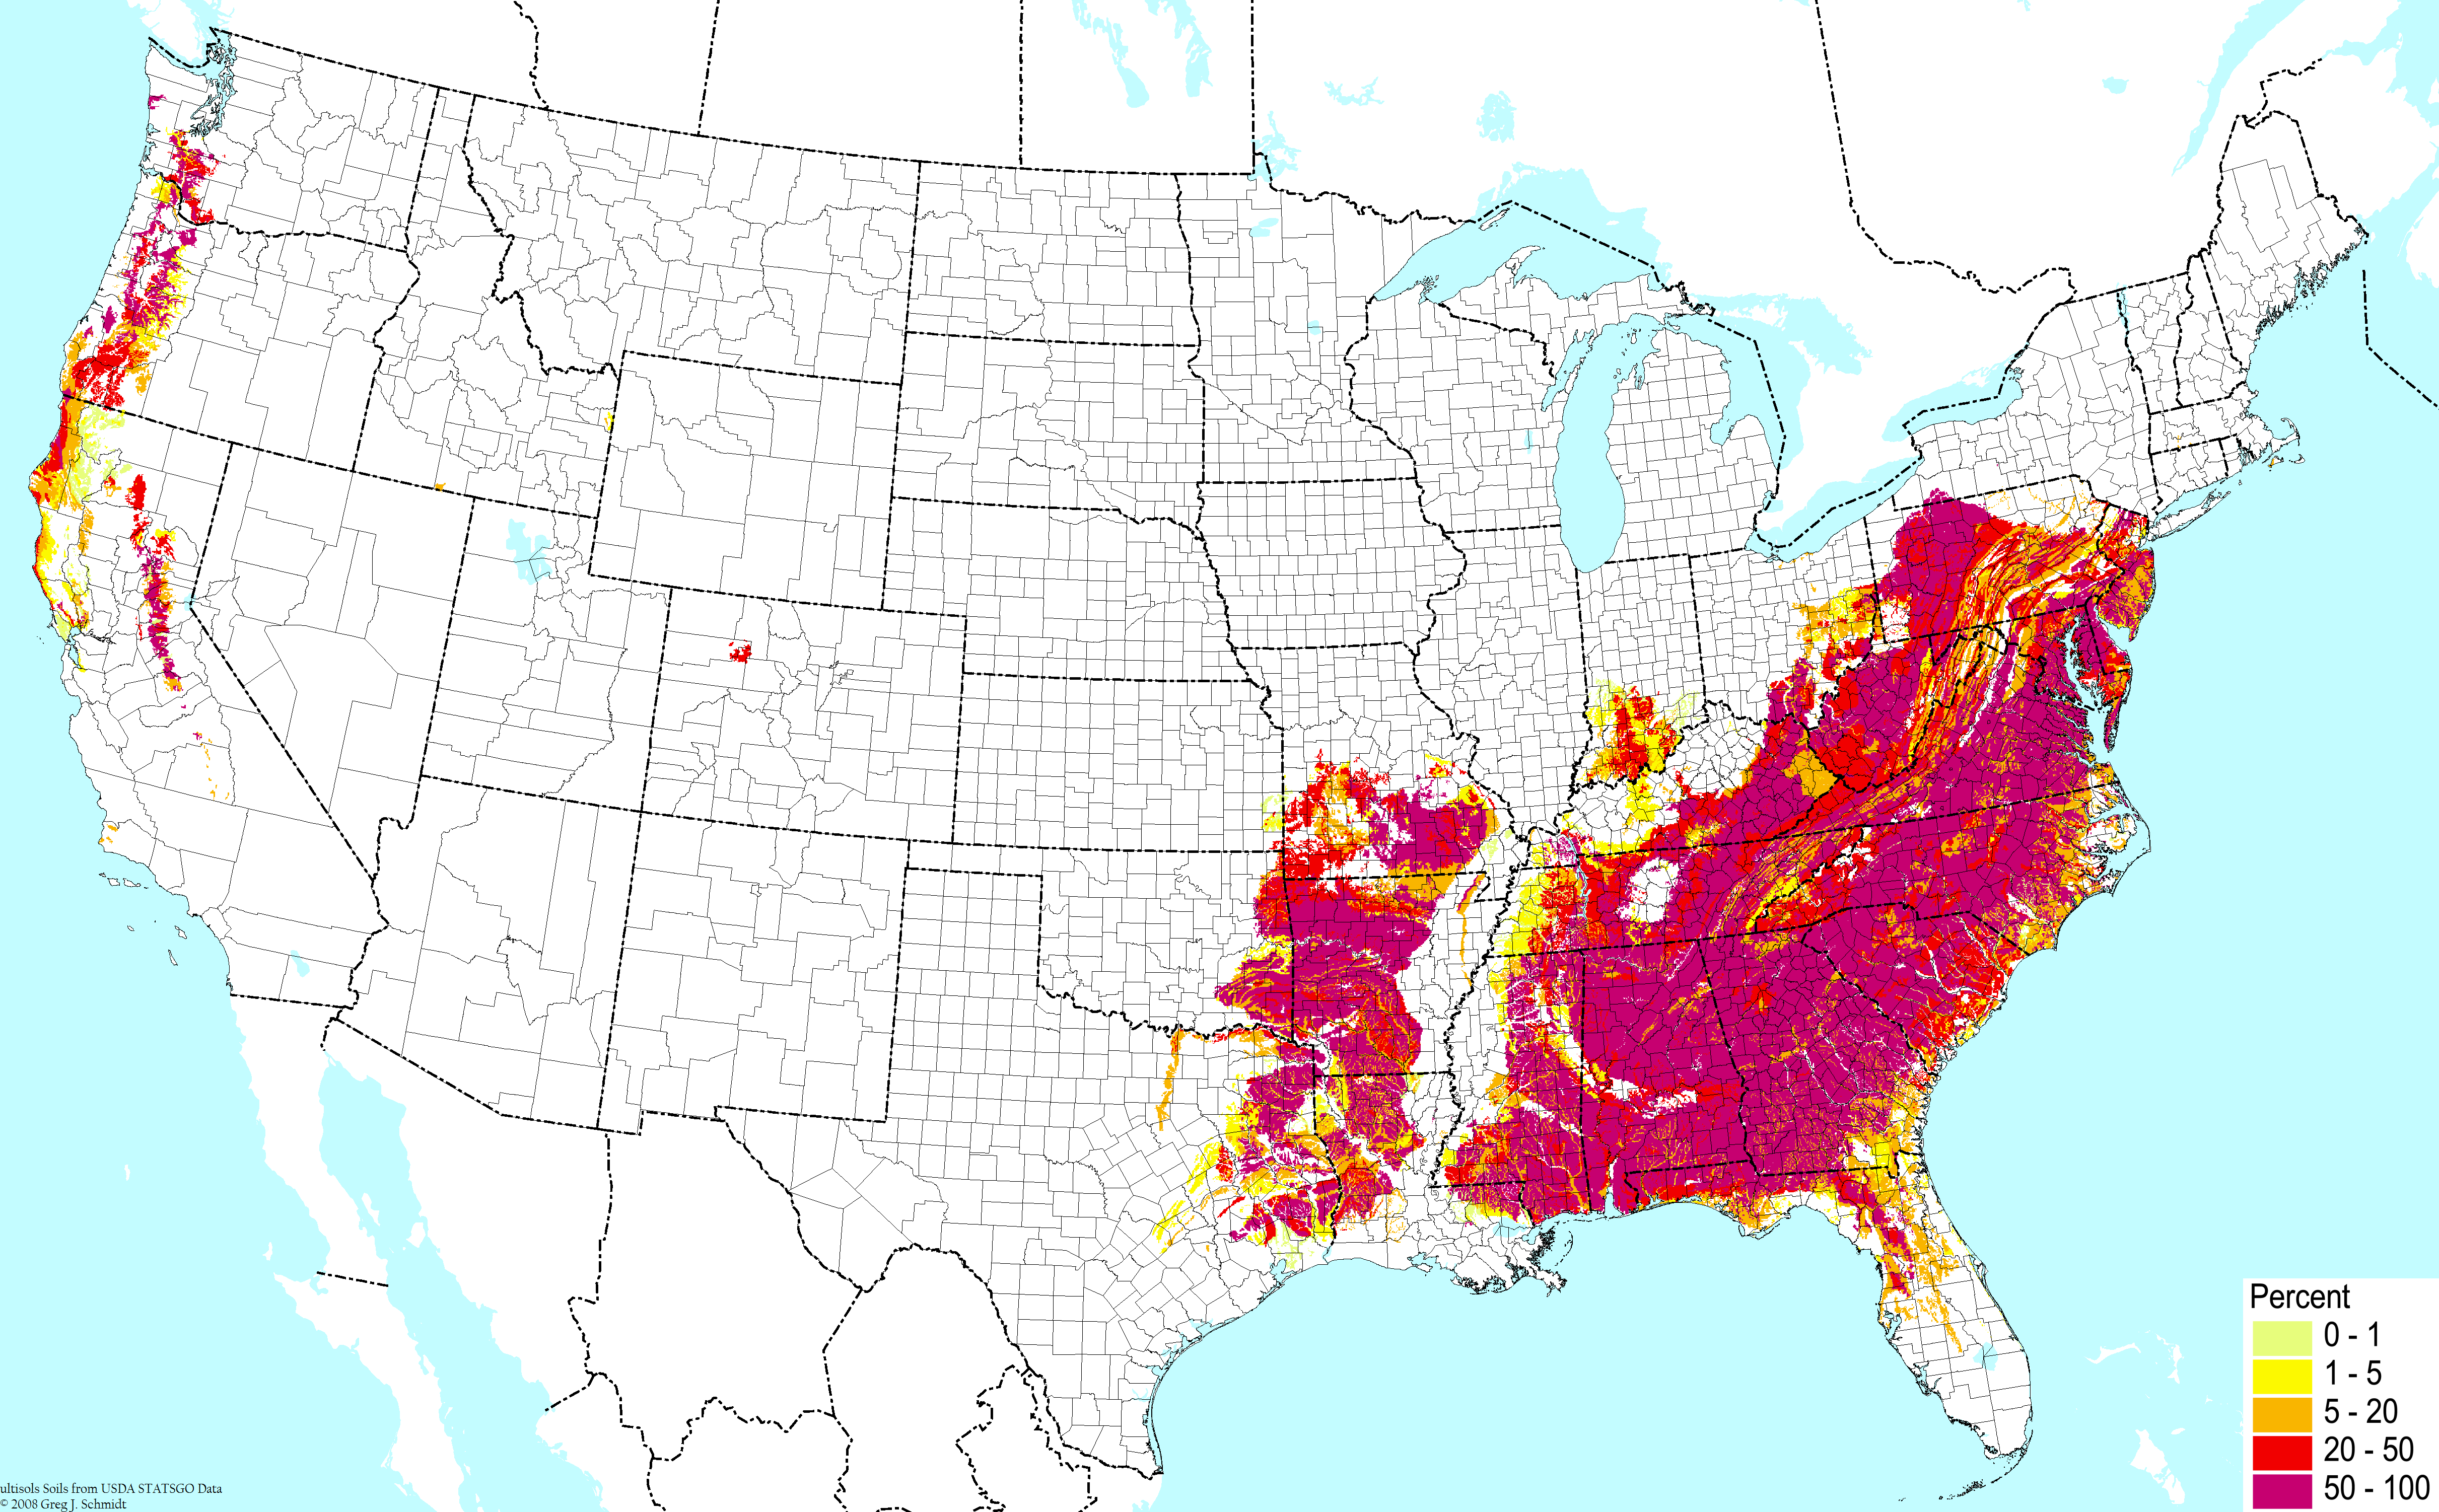
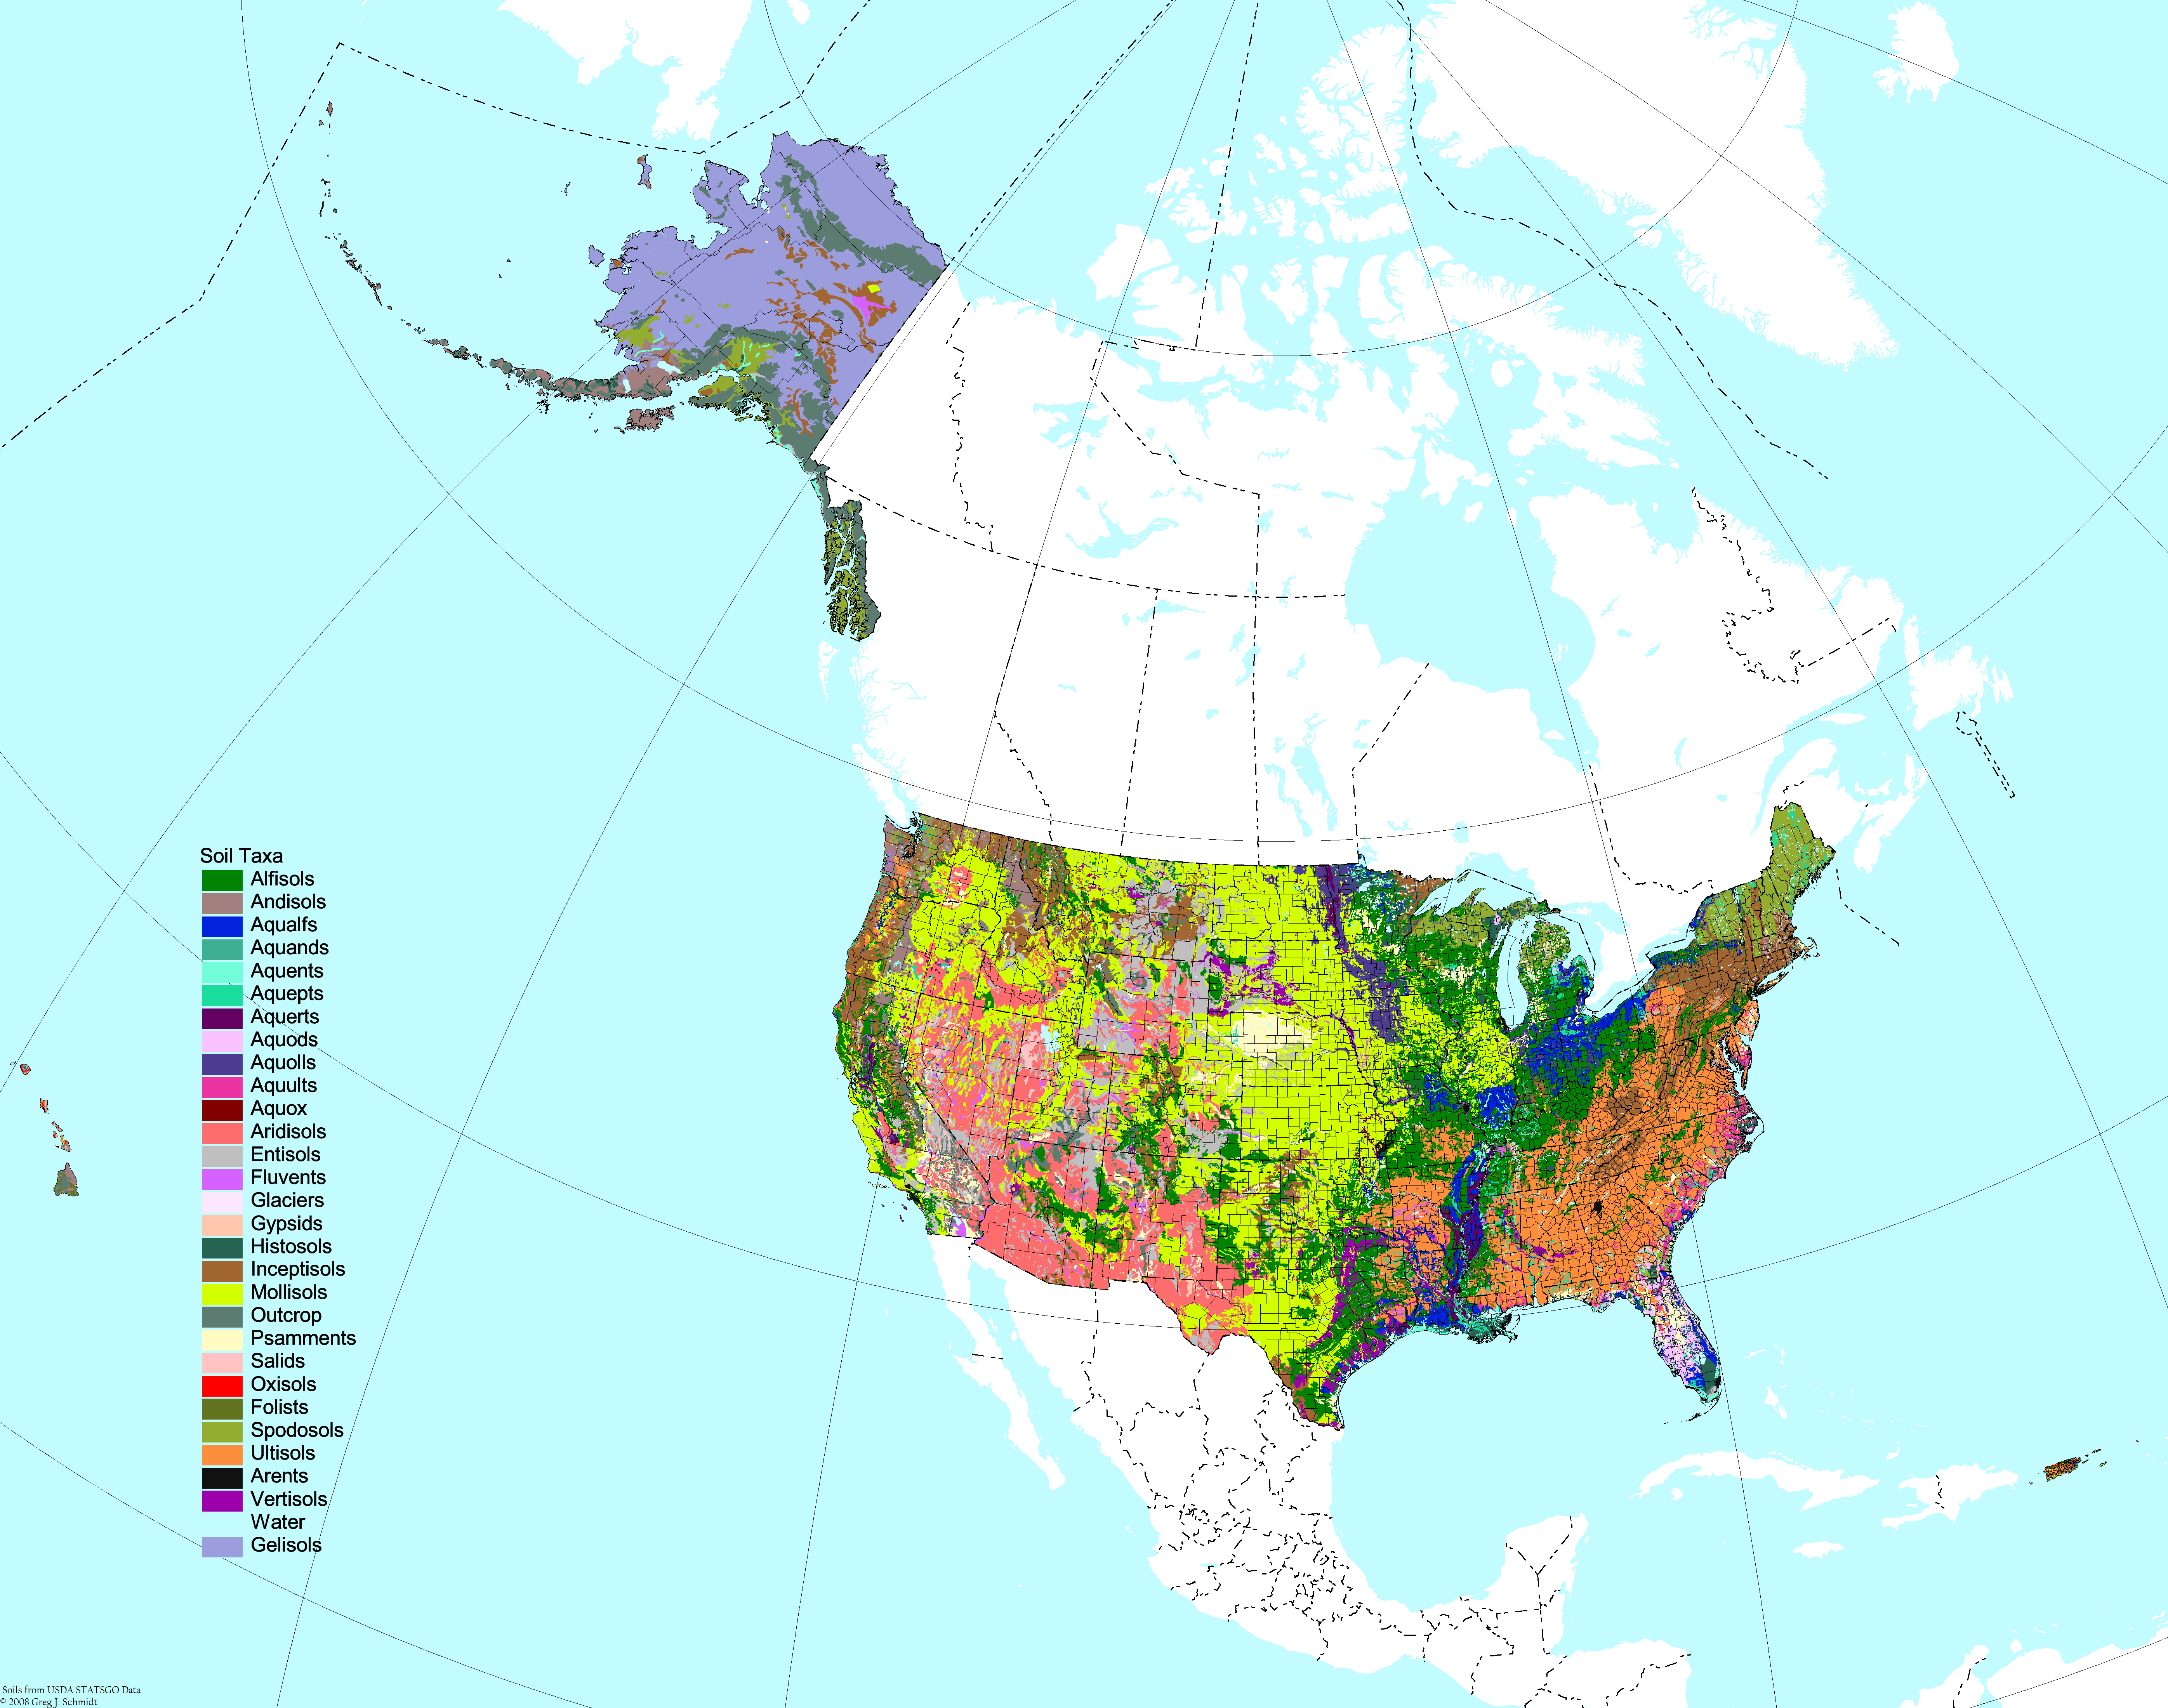
Soil orders and selected suborders of the United States, based on Soil Taxonomy of the USDA NRCS ©BONAP |
| | |


