Floristic Tension Zones

•Floristic provinces or zones are large geographic areas composed of similar plant species or plant groupings. The boundary lines seperating floristic zones are generally drawn according to obvious physiographic boundaries. However, if there are no major physiographic differences between floristic areas, boundaries may need to be set according to the actual geographic area where species composition or plant groupings change. These transitional areas are often referred to as "tension zones". They represent phytogeogrphic areas where species or plant groupings (in some cases scores of species) achieve their maximum range limits either latitudinally or longitudinally. Such tension zones form obvious boundaries (e.g., tension zones between the northern and southern floras of the Great Lakes or the tension zone between the Piedmont and Coastal Plains of the Atlantic Coast states). Floristic tension zones in the U.S. have been historically delimited by plotting species range limits and quantifying the number of range edges crossing each U.S. county. The tension zone line is drawn through counties with the highest numbers of species.
•An alternative method is to classify each species as either fundamentally northern or southern and then calculate the percent composition by northern versus southern species. However, the classification of a species' predominant range can be arbitrary. Each species, therefore, can be given a score based on its average latitude or longitude. Each county is then given a score by averaging the latitude or longitude scores of species that occur there. As demonstrated here, widespread species are given less weight than narrowly distributed species, so that the differences between average scores are not neutralized.
•We used latitude to determine the tension zones between northern and southern floras. We used longitude to determine the tension zones between eastern and western floras.
•When contours are plotted, the areas where the contours are close together represent tension zones between dissimilar floras (regardless of whether they are supported by a physiographic break).
Floristic Tension Zones:
Examples of Individual Species
|
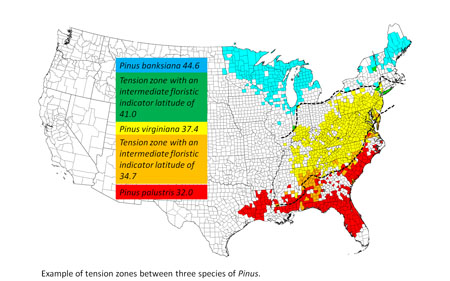
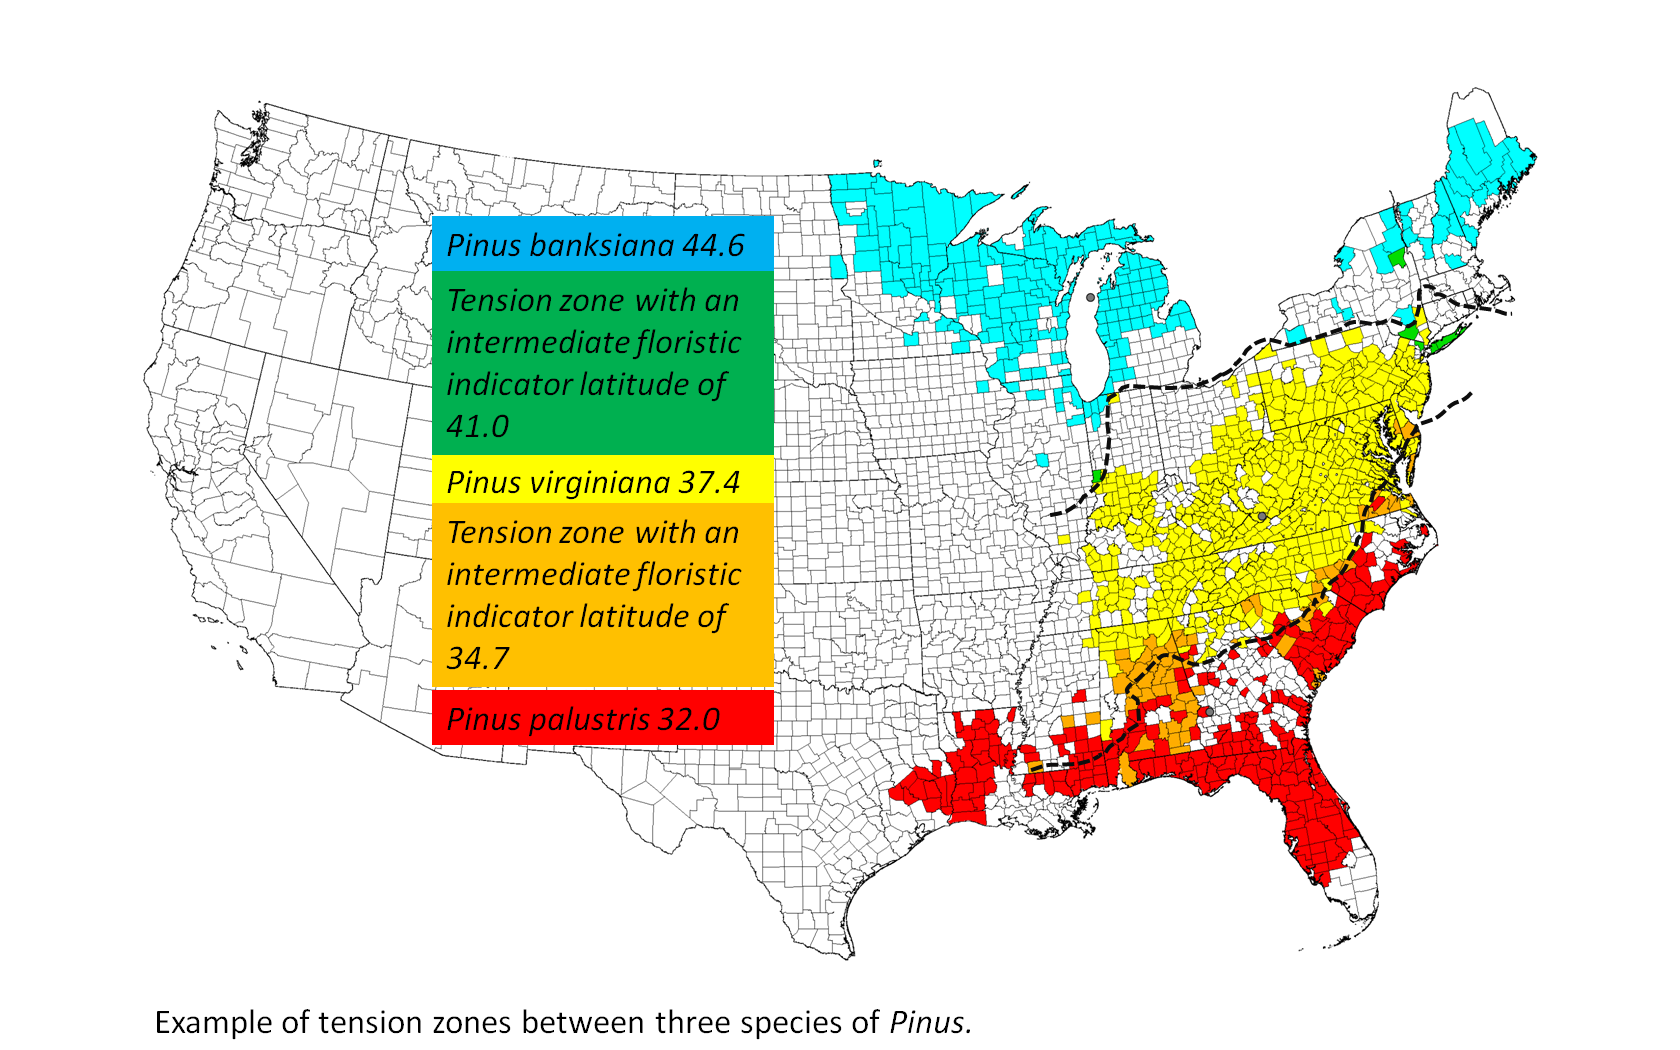
Example of tension zones between three species of Pinus ©BONAP | 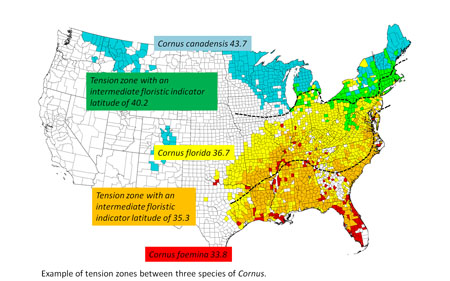
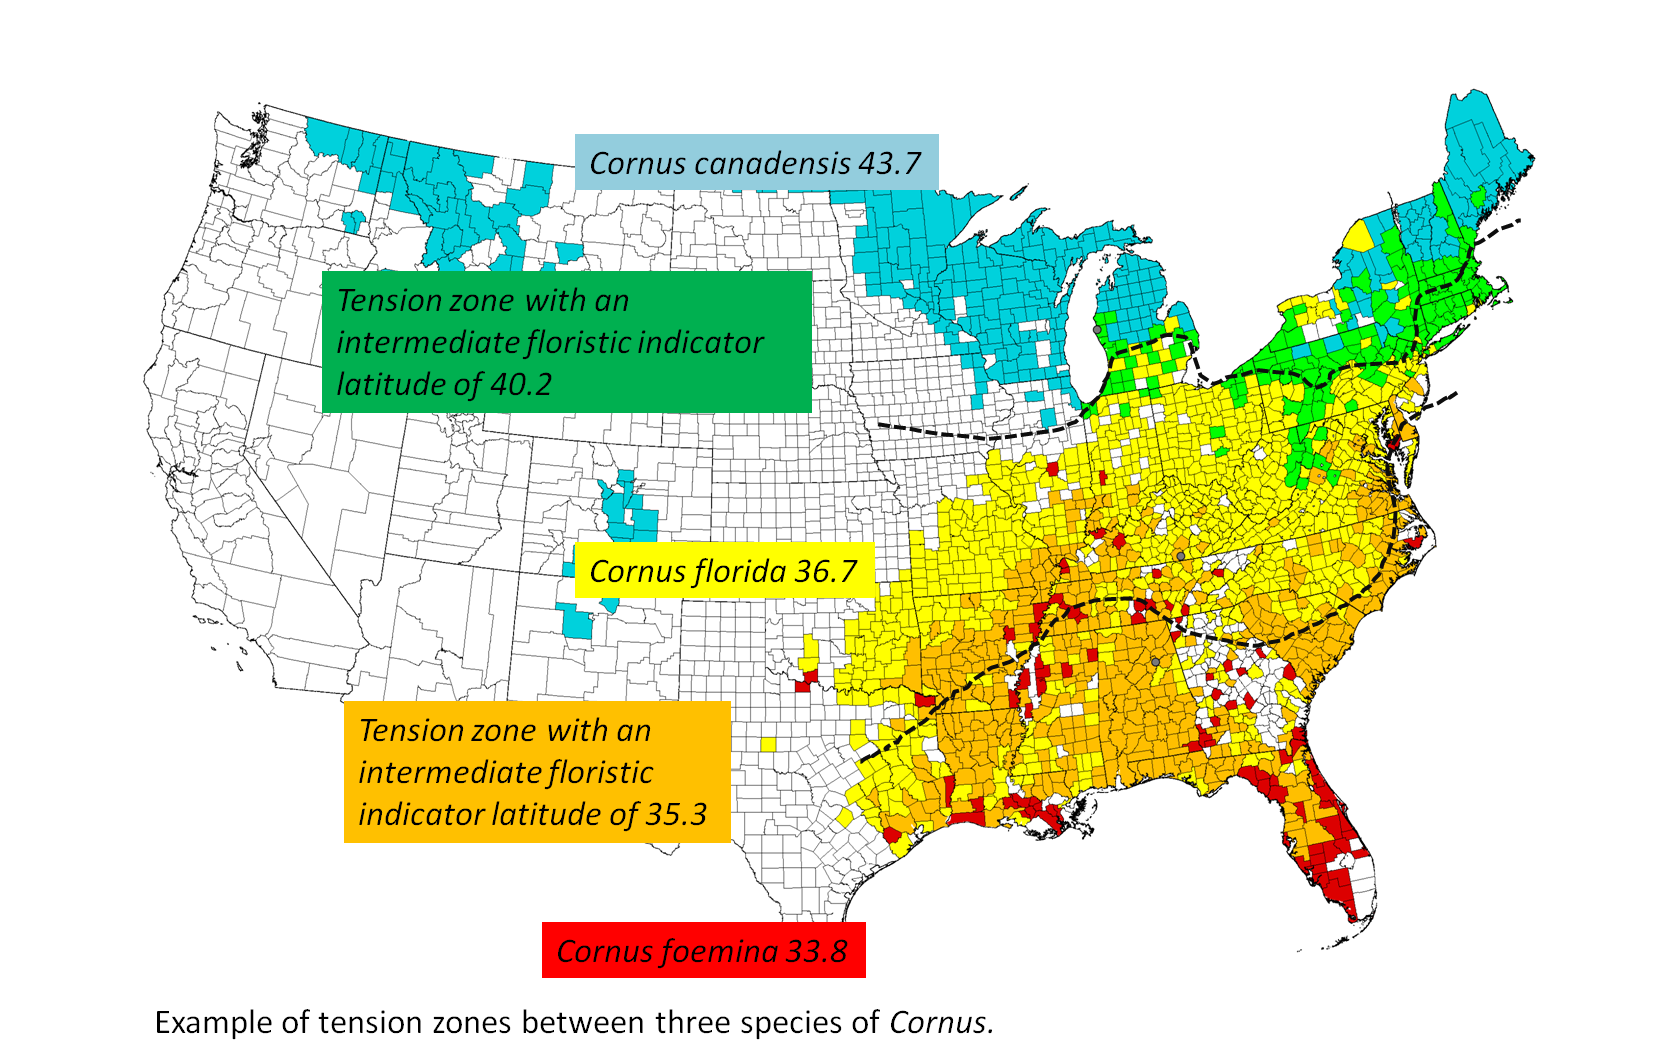
Example of tension zones between three species of Cornus ©BONAP
| 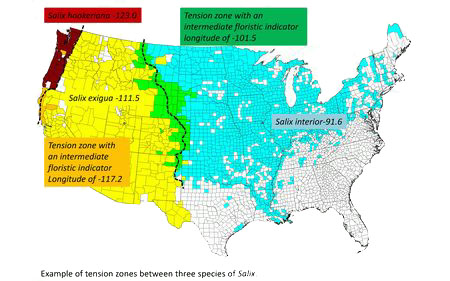
Example of tension zones betwee three species of Salix ©BONAP |
•Three species of Pinus were selected to illustrate the concept of tension zones.
•The northern species - Pinus banksiana
•The middle species - Pinus virginiana
•The southern species - Pinus palustris
•A tension zone could be inferred to run through the counties where the species ranges overlap. However, manually drawing a line for every species to determine the average tension zone is impractical. Using GIS software, it is possible to quantify where such lines can best be drawn. We took the average latitude and longitude of the counties occupied by a each species and in turn, averaged those numbers for each species within each county to get a floristic indicator latitude for each county. Those counties with intermediate values indicates the overlap of a northern and southern flora or an eastern and western flora.
•Average latitude of Pinus banksiana occupied counties: 44.6
•Average latitude of Pinus virginiana occupied counties: 37.4
•Average latitude of Pinus palustris occupied counties: 32.0
•Average of P. banksiana and P. virginiana indicator values: 41.0
•Average of P. virginiana and P. palustis indicator values: 34.7
General Floristic Tension Zones Across The United States
|
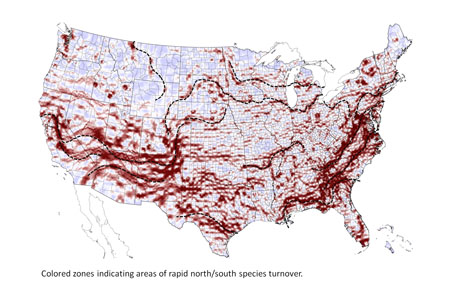
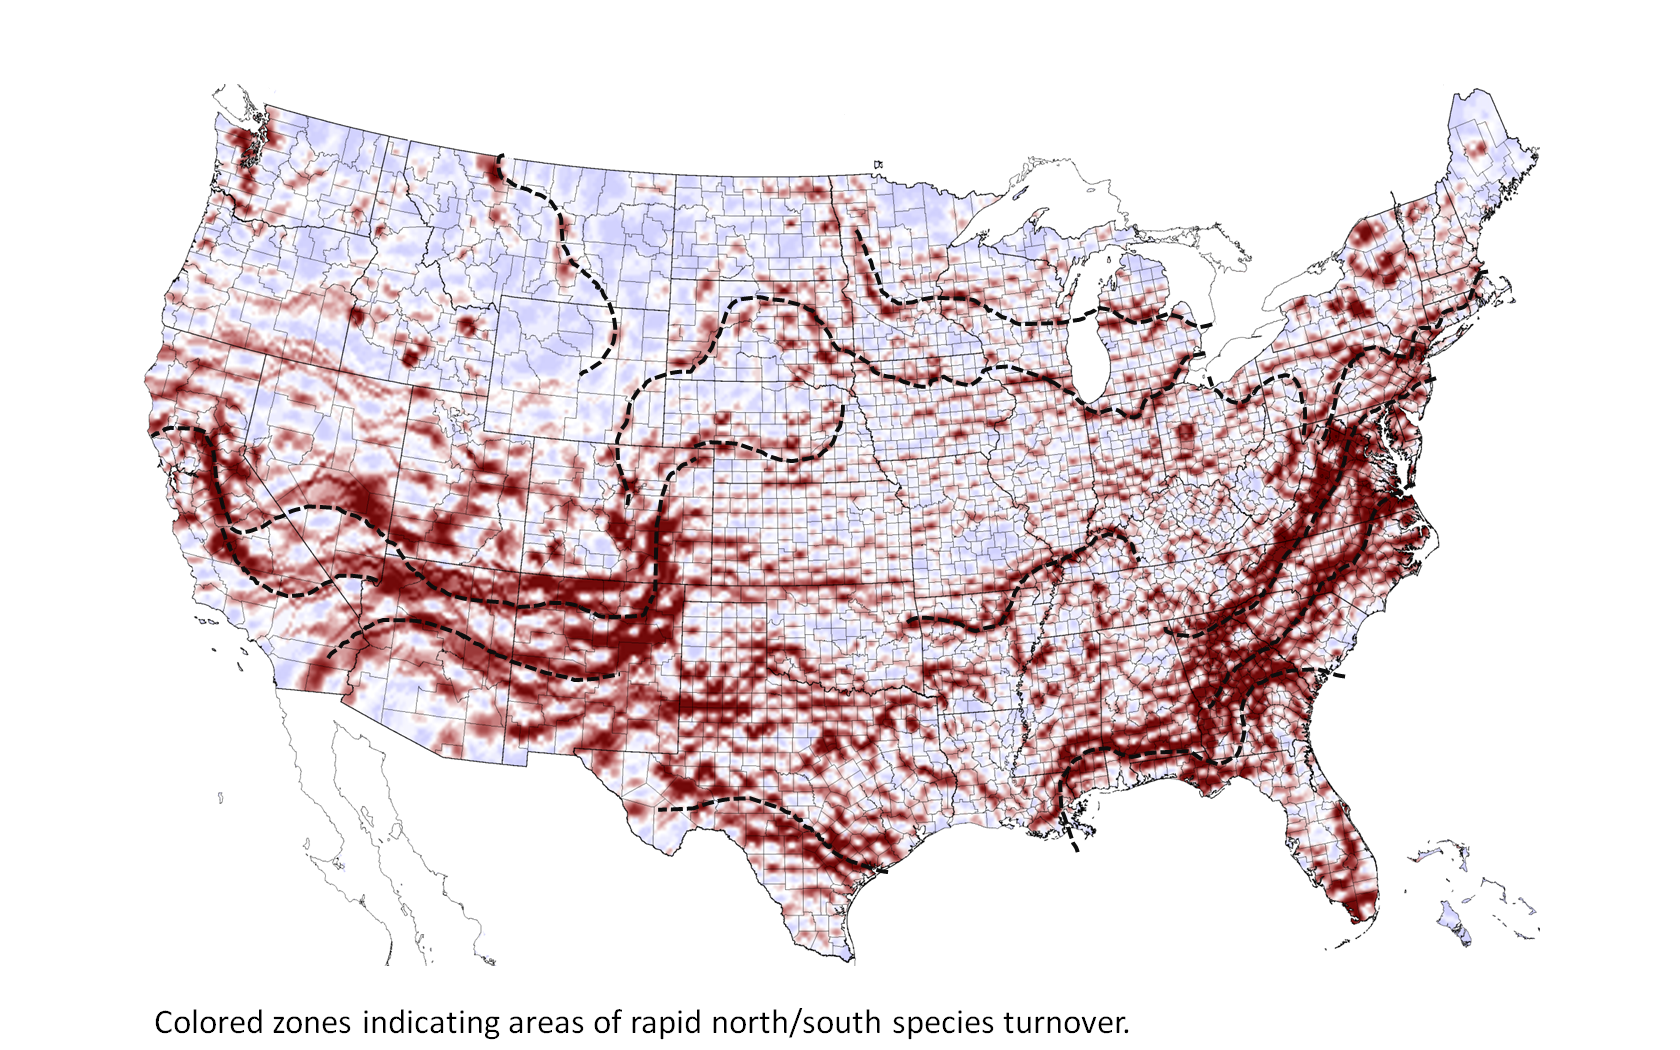
Colored zones indicating areas of rapid north/south species turnover ©BONAP | 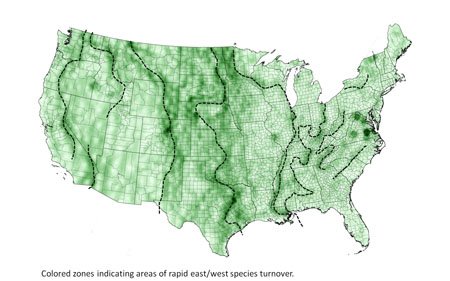
Colored zones indicating areas of rapid east/west species turnover ©BONAP | 
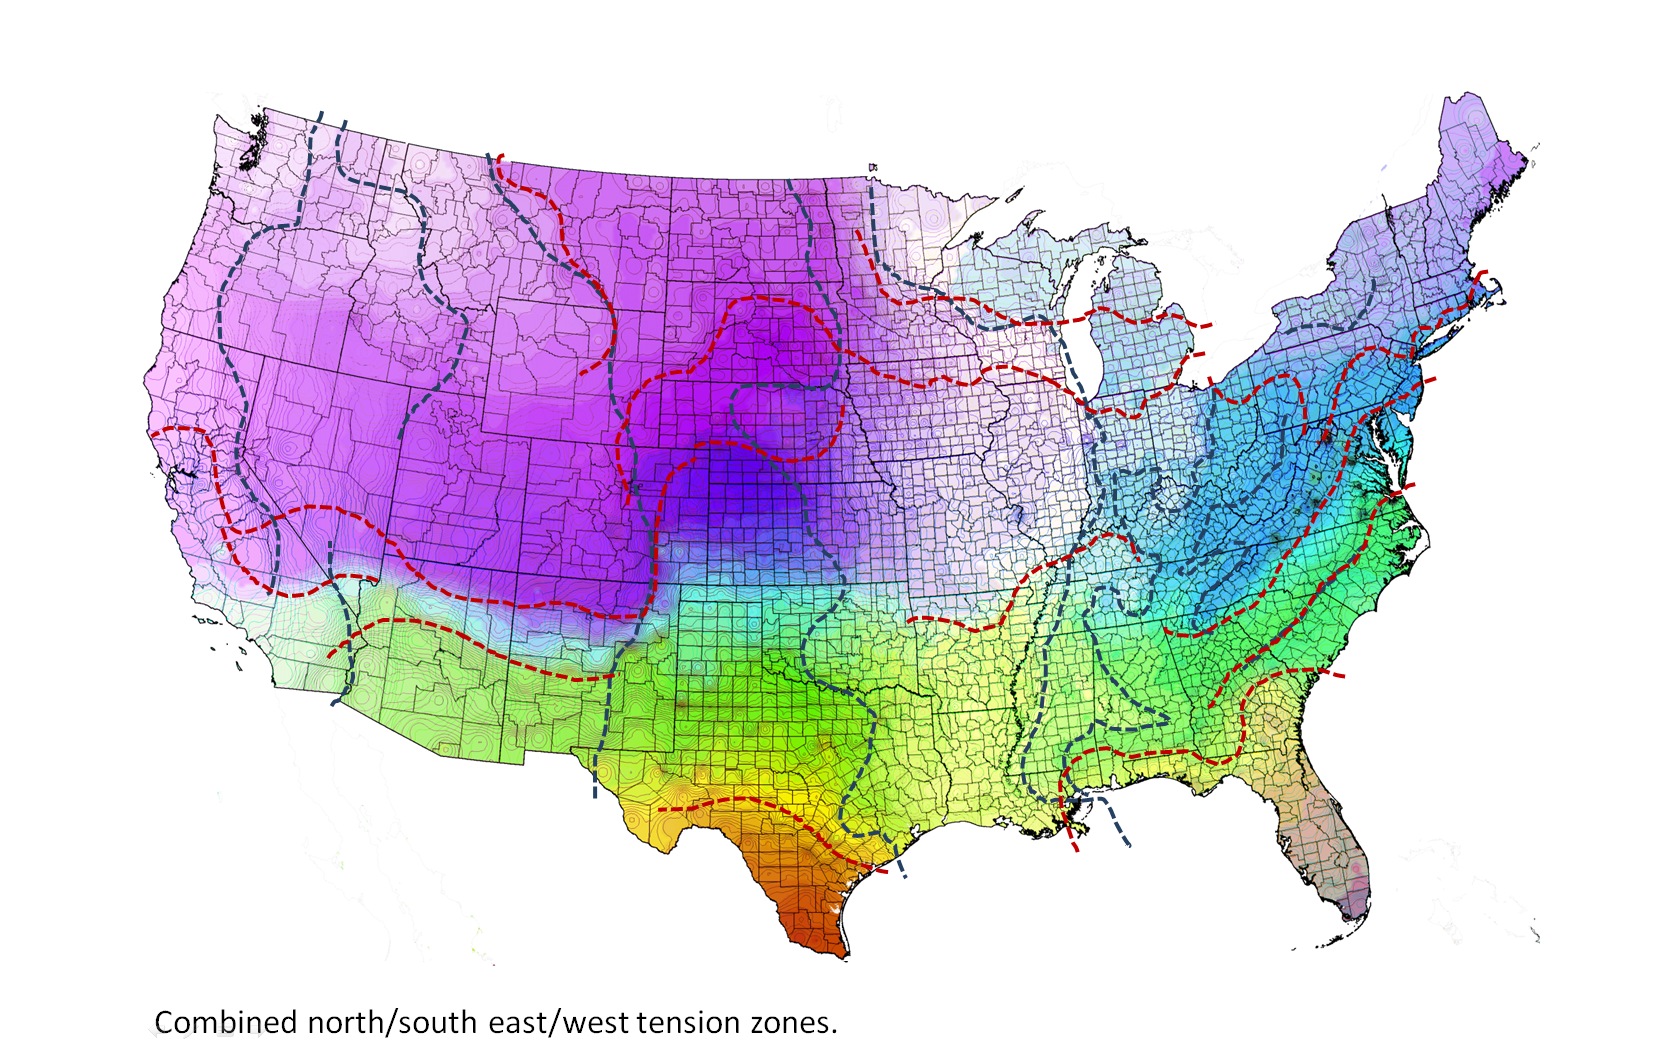
Combined north/south, east/west tension zones ©BONAP |

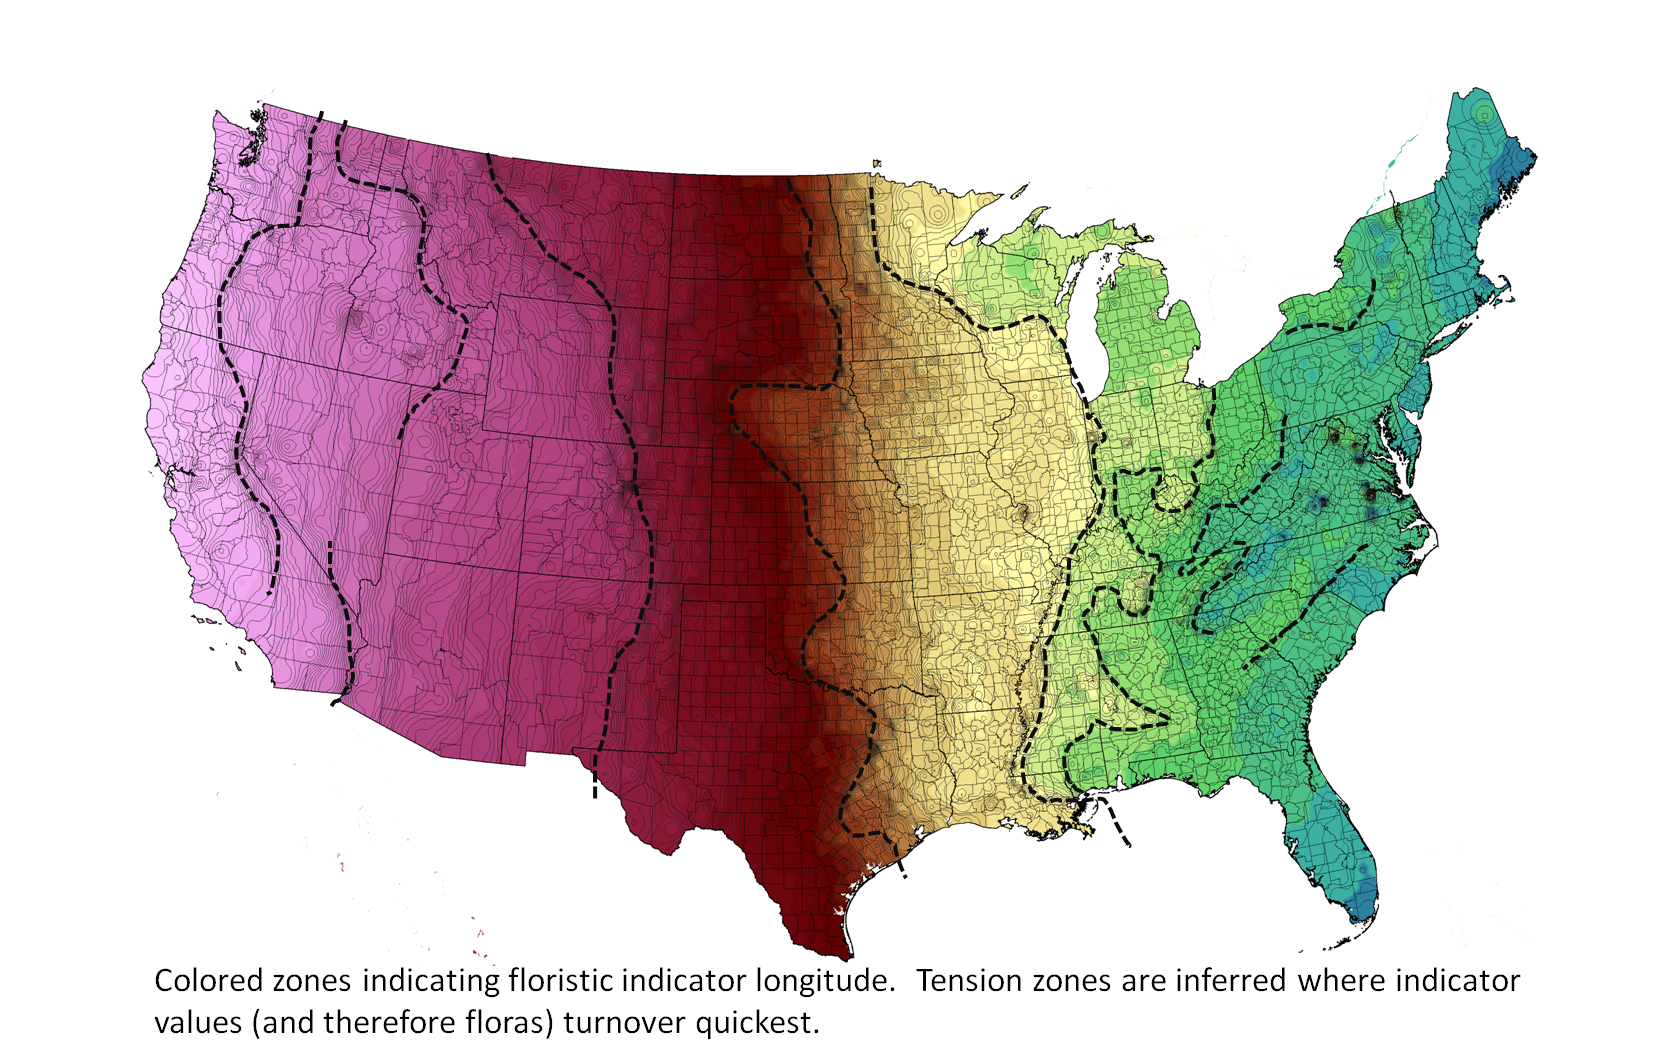
Colored zones indicating floristic indicator longitude. Tension zones are inferred where indicator values (and therefore floras) turnover quickest. ©BONAP | 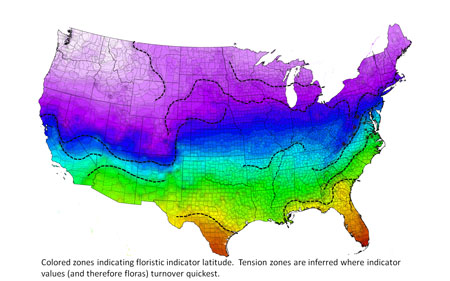
Colored zones indicating floristic indicator latitude. Tension zones are inferred where indicator values (and therefore floras) turnover quickest. ©BONAP | |
| |
| |
•As multiple species are added to the map, every county becomes part of a continuum of intermediate values where the numbers change the most across short distances.
Testable interpretations of peaks and troughs in species diversity
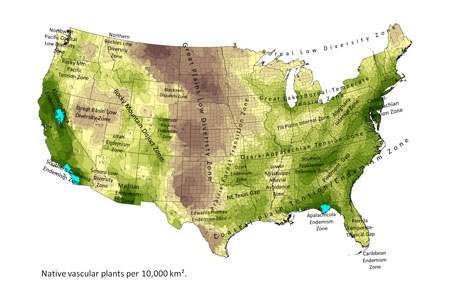
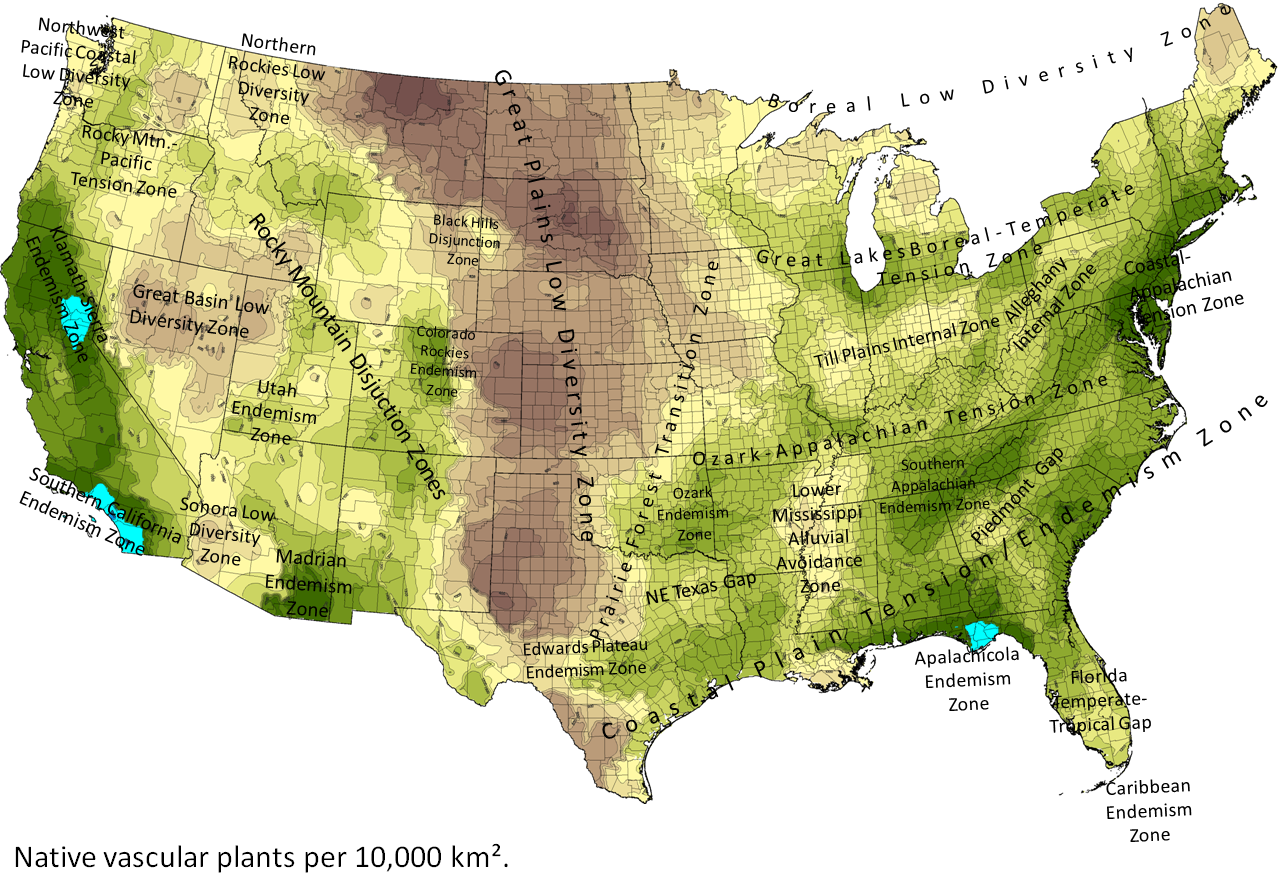
Native vascular plants per 10,000 km². ©BONAP
Peaks
•Tension Zone
–Overlapping Floras – detect by showing high variation in range centers
•Endemism Zone
–Range Limited Flora – detect by showing high diversity of range limited species
•Disjunct Zone
–Disjunct Flora – flora primarily of species with range discontinuity
Troughs
•Gap (interflora gap?)
–Area between non-overlapping zones of endemism
•Internal Zone (intraneous zone?)
–Flora intraneous, not in tension zone
•Avoidance Zone (exdemic zone?)
–Flora limited by lack of suitable habitat for a diverse flora, whereby widespread species may have a range gap in this area rather than having its own flora
•Low Diversity Zone (microflora?)
–Area containing the range centers of many species, but with a fundamentally low diversity flora
Intermediate
•Transition Zone
–Area of species turnover that doesn’t result in peaked diversity due to range overlap, usually due to the adjacent flora having significantly fewer species
Last updated April 2, 2015.